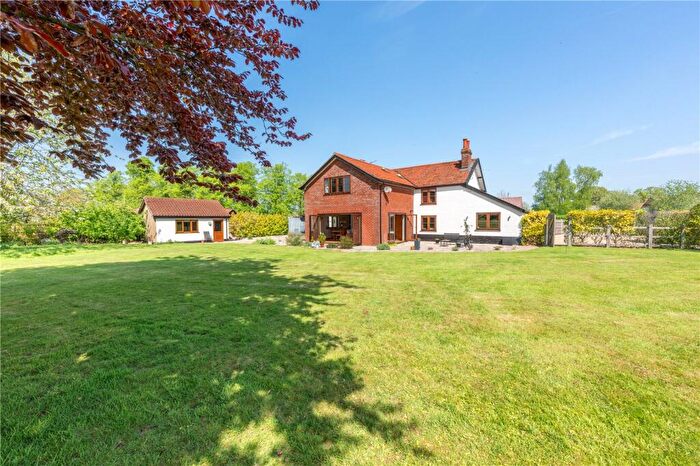
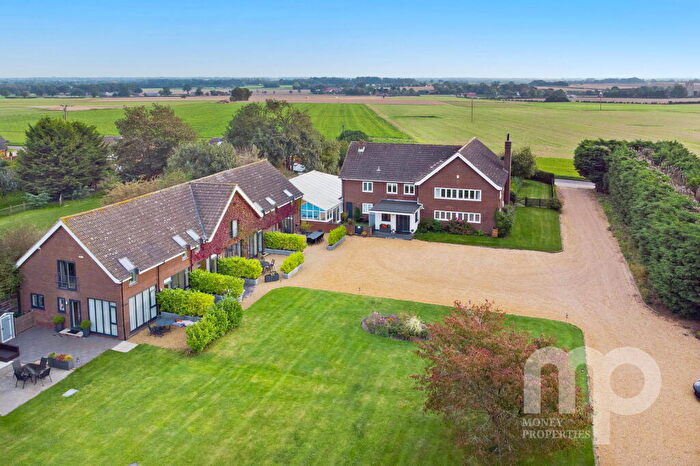
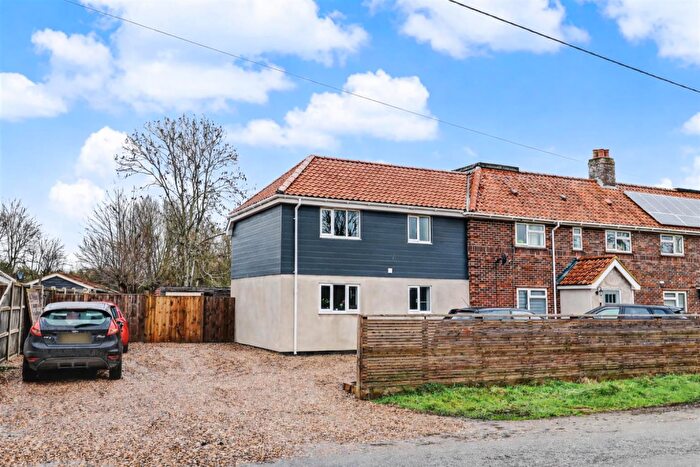
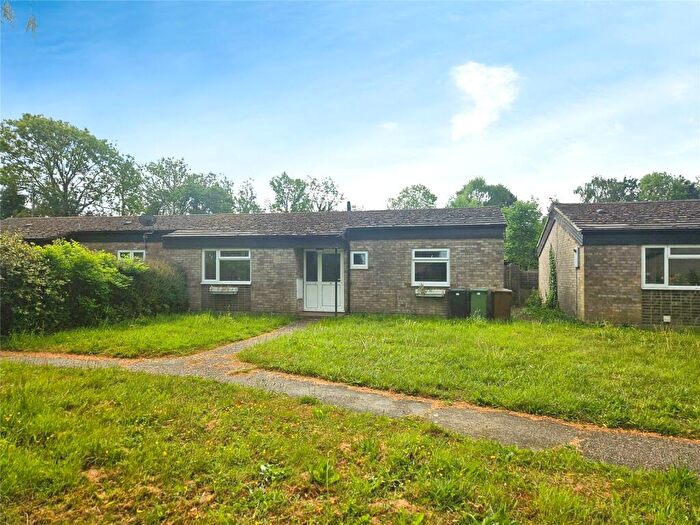
Houses for sale & to rent in Wicklewood, Wymondham
House Prices in Wicklewood
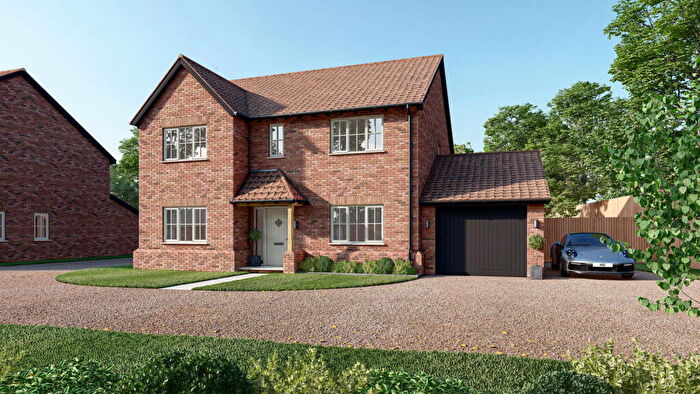
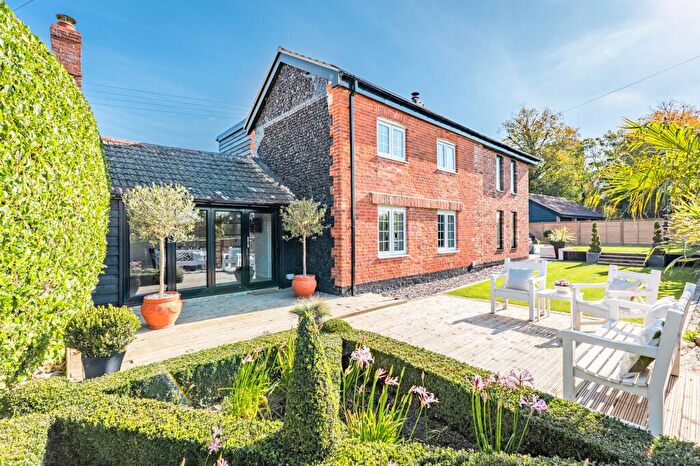
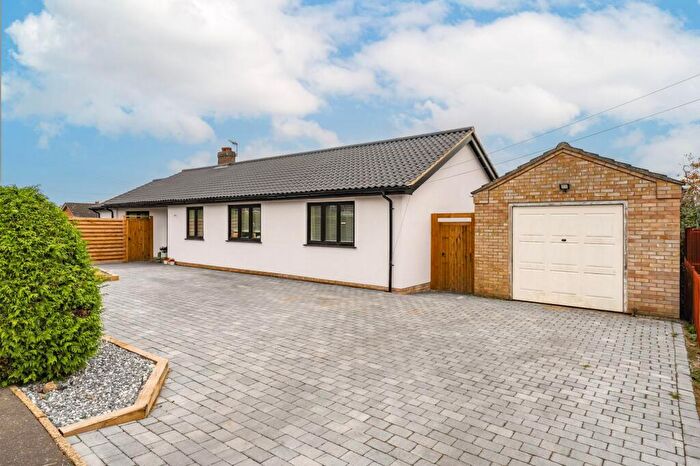
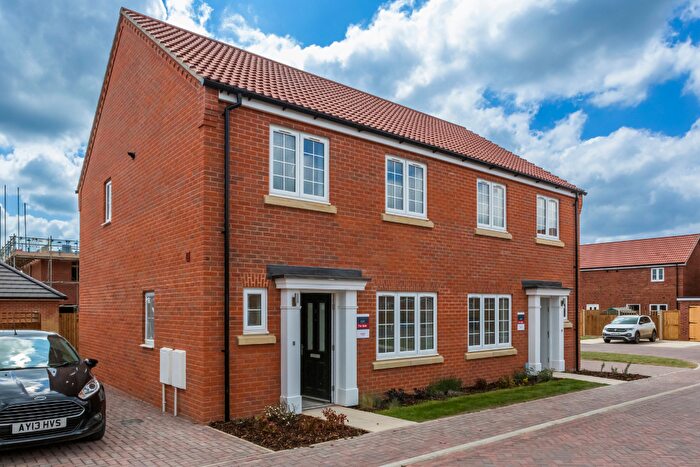
Properties in Wicklewood have an average house price of £456,092.00 and had 47 Property Transactions within the last 3 years¹.
Wicklewood is an area in Wymondham, Norfolk with 590 households², where the most expensive property was sold for £996,000.00.
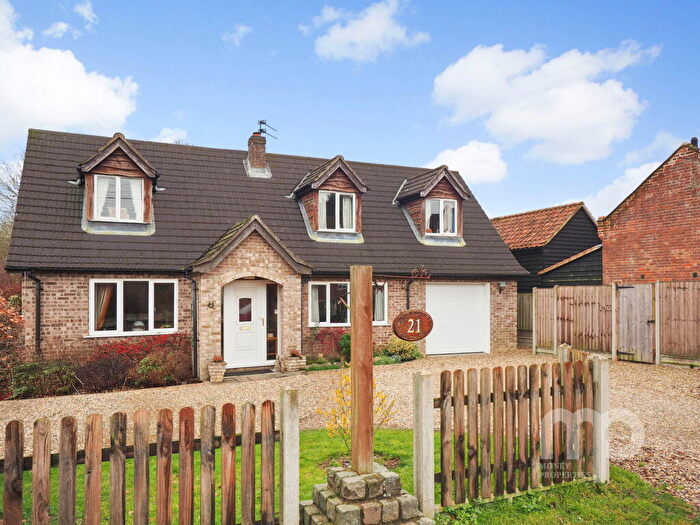
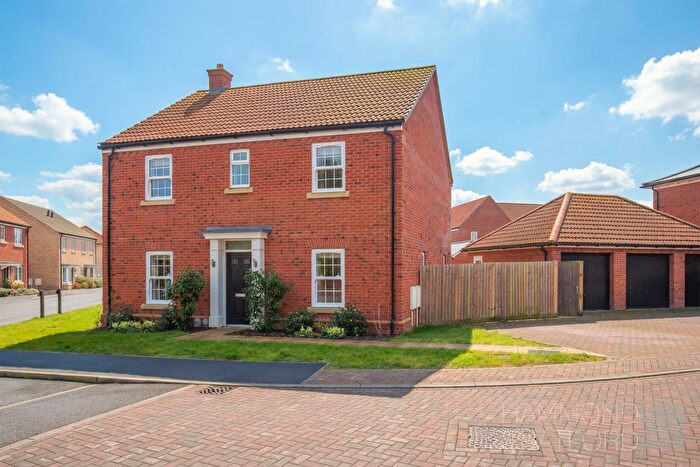
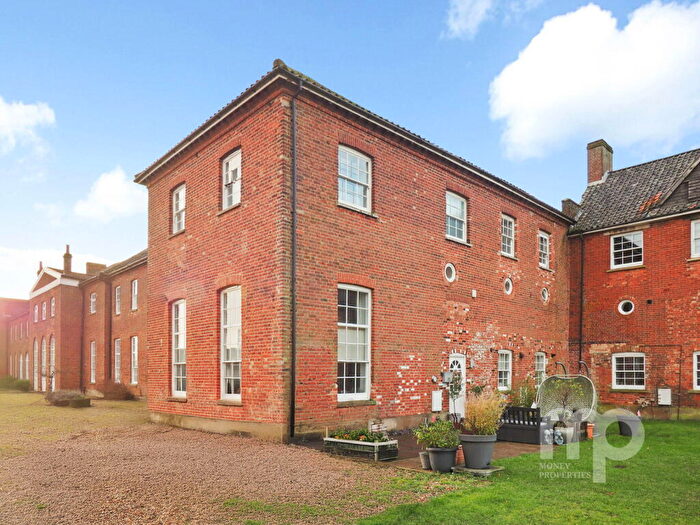
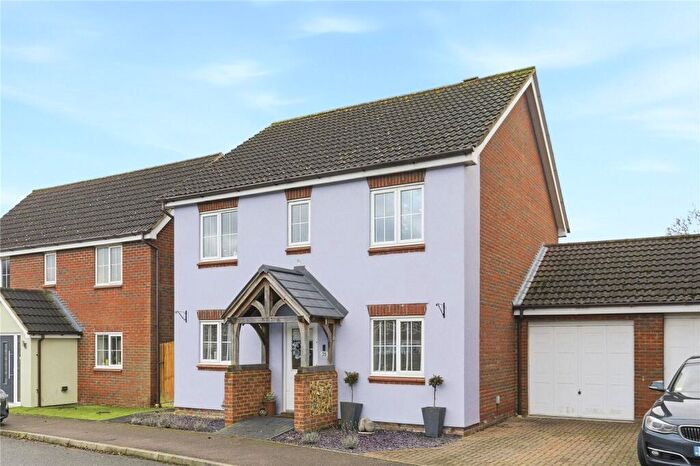
Properties for sale in Wicklewood
Roads and Postcodes in Wicklewood
Navigate through our locations to find the location of your next house in Wicklewood, Wymondham for sale or to rent.
| Streets | Postcodes |
|---|---|
| All Saints Close | NR18 9QT |
| Attleborough Road | NR18 9TU NR18 9TX |
| Beech Mews | NR18 9QU |
| Bucks Lane | NR18 9BL |
| Chapel Road | NR18 9TF |
| Church Lane | NR18 9QH |
| Church Road | NR18 9TH |
| Cooks Terrace | NR18 9QQ |
| Crownthorpe | NR18 9EP NR18 9HU |
| Crownthorpe Road | NR18 9EN NR18 9EW |
| Deopham Road | NR18 9AA NR18 9DF NR18 9DA NR18 9DB NR18 9TS |
| Elm Cottages | NR18 9PW |
| Golf Links Road | NR18 9SU NR18 9TA NR18 9TD |
| Green Lane | NR18 9ET |
| Hackford Road | NR18 9HT NR18 9PZ NR18 9QJ NR18 9GG |
| Hall Lane | NR18 9TB |
| High Common | NR18 9BX |
| High Oak Lane | NR18 9QR |
| High Oak Road | NR18 9PN NR18 9QP NR18 9QS |
| High Street | NR18 9AJ NR18 9QA NR18 9QE |
| Hill Road | NR18 9UB |
| Hillside Crescent | NR18 9QD |
| Home Farm Lane | NR18 9US |
| Hookwood Lane | NR18 9TZ |
| Hospital Road | NR18 9PR |
| Laurel Close | NR18 9AG |
| London Road | NR18 9ST |
| Low Road | NR18 9BU |
| Low Street | NR18 9EU NR18 9QG |
| Milestone Lane | NR18 9QL |
| Mill Hill Lane | NR18 9DD |
| Mill Lane | NR18 9TN |
| Mill View Way | NR18 9BQ |
| Morleyfield Lane | NR18 9QN NR18 9TL |
| Norwich Road | NR18 9HA |
| Robert Andrew Close | NR18 9AE |
| St Georges | NR18 9PD |
| Station Cottages | NR18 9HD |
| Station Road | NR18 9HB NR18 9HQ |
| Stone Brigg | NR18 9TR |
| Swingy Lane | NR18 9TJ |
| The Green | NR18 9EY NR18 9PX NR18 9PT |
| The Oaks | NR18 9QX |
| Vicarage Road | NR18 9TW |
| Whitehouse Lane | NR18 9PP |
| Wicklewood Rise | NR18 9QW |
| Wood Lane | NR18 9PU |
| Wymondham Road | NR18 9ES |
| NR18 9EX NR18 9EZ NR18 9TE NR18 9TT NR18 9SX NR18 9SY NR18 9SZ |
Transport near Wicklewood
- FAQ
- Price Paid By Year
- Property Type Price
Frequently asked questions about Wicklewood
What is the average price for a property for sale in Wicklewood?
The average price for a property for sale in Wicklewood is £456,092. This amount is 45% higher than the average price in Wymondham. There are 485 property listings for sale in Wicklewood.
What streets have the most expensive properties for sale in Wicklewood?
The streets with the most expensive properties for sale in Wicklewood are Mill View Way at an average of £800,000, Home Farm Lane at an average of £745,000 and Low Street at an average of £624,333.
What streets have the most affordable properties for sale in Wicklewood?
The streets with the most affordable properties for sale in Wicklewood are Cooks Terrace at an average of £136,000, Station Road at an average of £285,000 and High Street at an average of £304,052.
Which train stations are available in or near Wicklewood?
Some of the train stations available in or near Wicklewood are Wymondham, Spooner Row and Attleborough.
Property Price Paid in Wicklewood by Year
The average sold property price by year was:
| Year | Average Sold Price | Price Change |
Sold Properties
|
|---|---|---|---|
| 2025 | £468,776 | 17% |
14 Properties |
| 2024 | £387,052 | -39% |
19 Properties |
| 2023 | £537,107 | 4% |
14 Properties |
| 2022 | £516,517 | 10% |
28 Properties |
| 2021 | £464,625 | 12% |
40 Properties |
| 2020 | £410,266 | -10% |
15 Properties |
| 2019 | £452,250 | 24% |
10 Properties |
| 2018 | £343,996 | -38% |
14 Properties |
| 2017 | £474,825 | 8% |
20 Properties |
| 2016 | £439,077 | 28% |
29 Properties |
| 2015 | £317,428 | 7% |
21 Properties |
| 2014 | £294,325 | 8% |
27 Properties |
| 2013 | £269,620 | -62% |
25 Properties |
| 2012 | £436,807 | 15% |
24 Properties |
| 2011 | £372,889 | 24% |
15 Properties |
| 2010 | £284,250 | -4% |
12 Properties |
| 2009 | £295,812 | -1% |
27 Properties |
| 2008 | £297,849 | 5% |
21 Properties |
| 2007 | £283,369 | 8% |
30 Properties |
| 2006 | £261,661 | -14% |
21 Properties |
| 2005 | £299,576 | 21% |
19 Properties |
| 2004 | £236,091 | 3% |
17 Properties |
| 2003 | £229,214 | 24% |
21 Properties |
| 2002 | £174,176 | 4% |
36 Properties |
| 2001 | £167,681 | 34% |
29 Properties |
| 2000 | £109,909 | -12% |
22 Properties |
| 1999 | £122,632 | 28% |
31 Properties |
| 1998 | £88,681 | 3% |
17 Properties |
| 1997 | £85,601 | -2% |
20 Properties |
| 1996 | £86,891 | 23% |
23 Properties |
| 1995 | £67,014 | - |
21 Properties |
Property Price per Property Type in Wicklewood
Here you can find historic sold price data in order to help with your property search.
The average Property Paid Price for specific property types in the last three years are:
| Property Type | Average Sold Price | Sold Properties |
|---|---|---|
| Semi Detached House | £321,000.00 | 11 Semi Detached Houses |
| Detached House | £508,041.00 | 33 Detached Houses |
| Terraced House | £305,000.00 | 2 Terraced Houses |
| Flat | £530,000.00 | 1 Flat |

