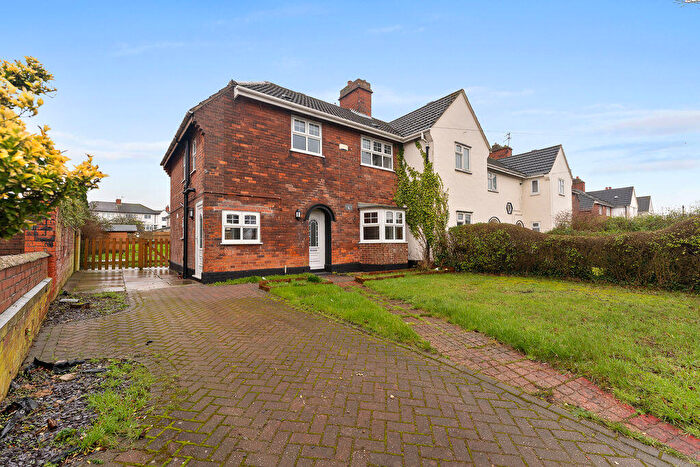
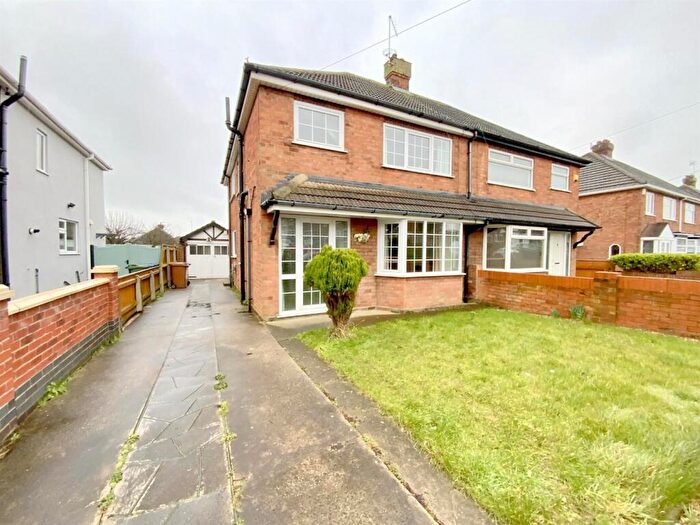
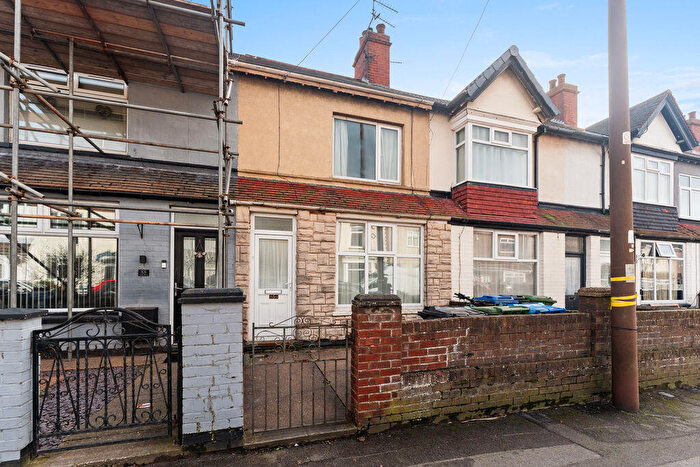
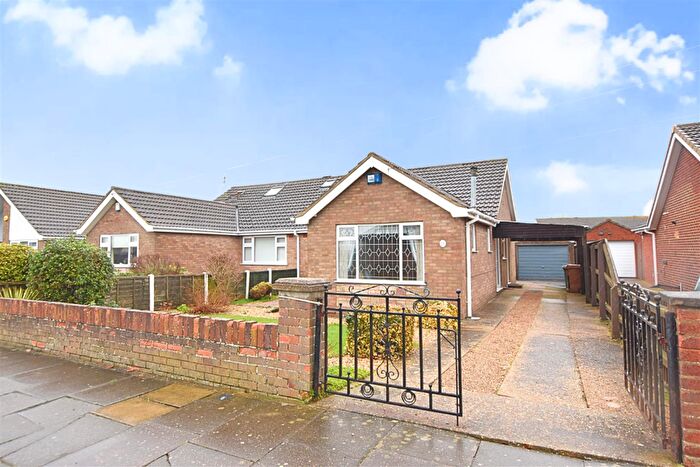
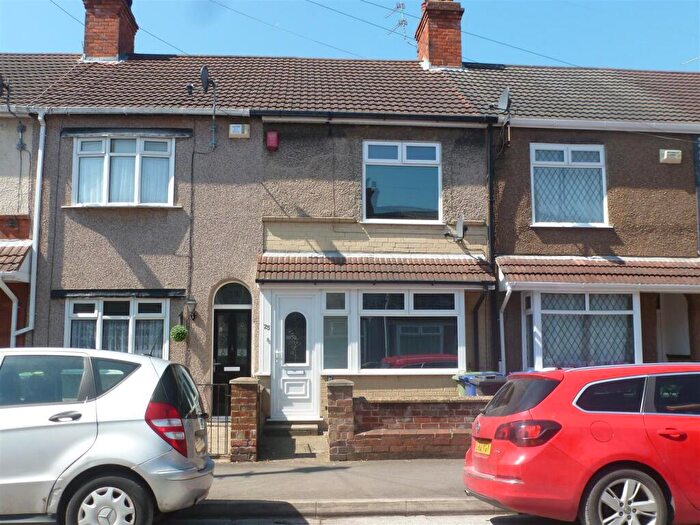
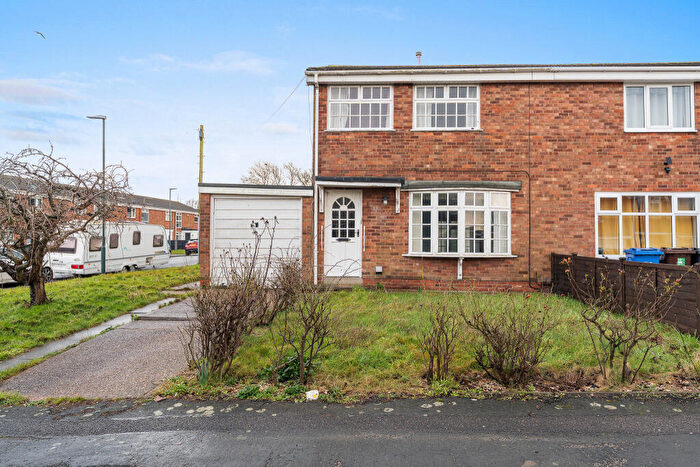
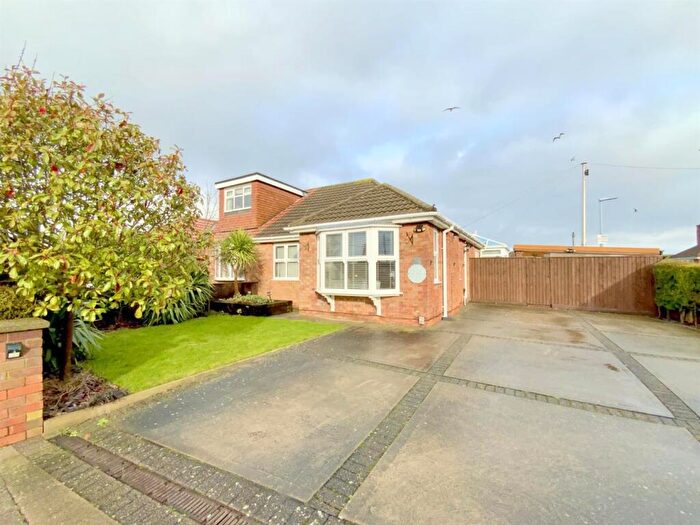
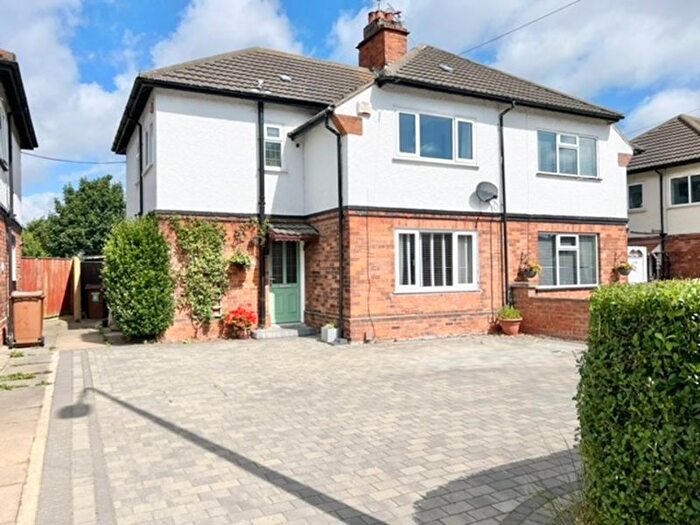
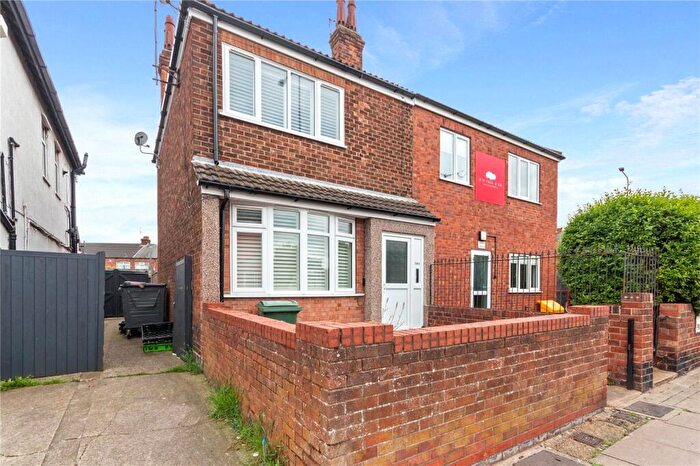
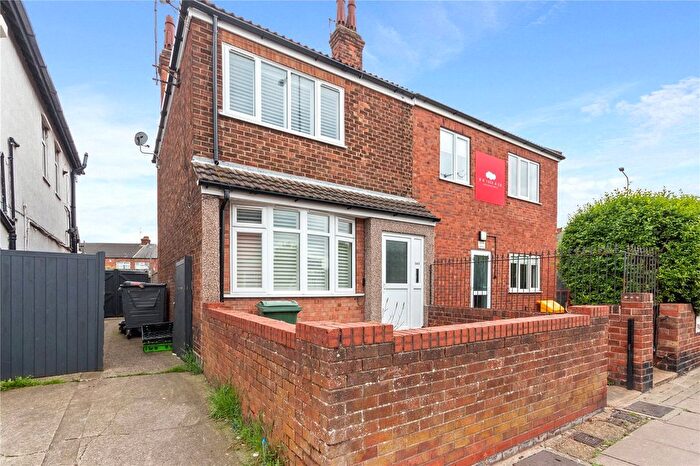
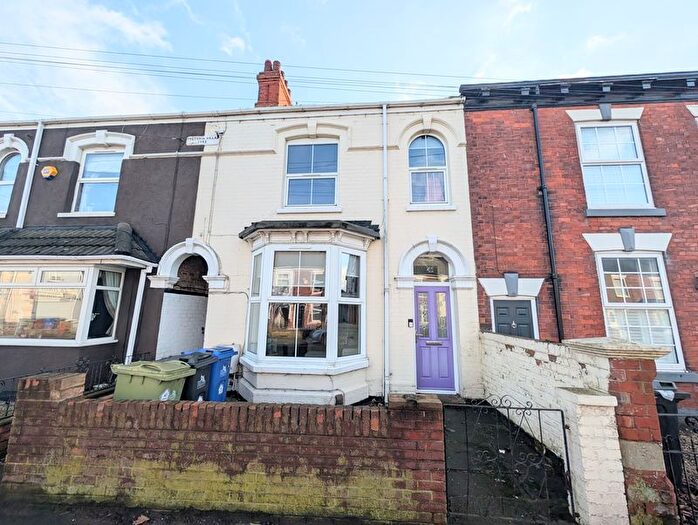
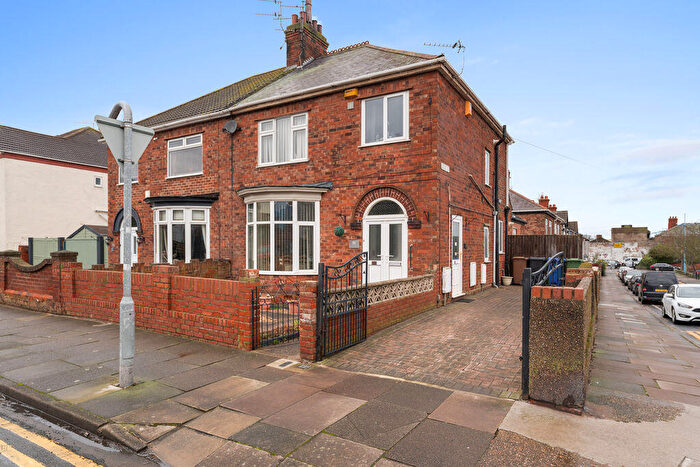
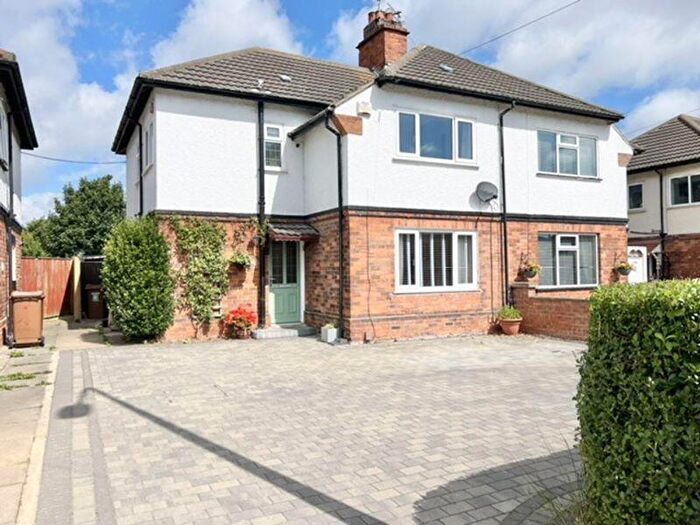
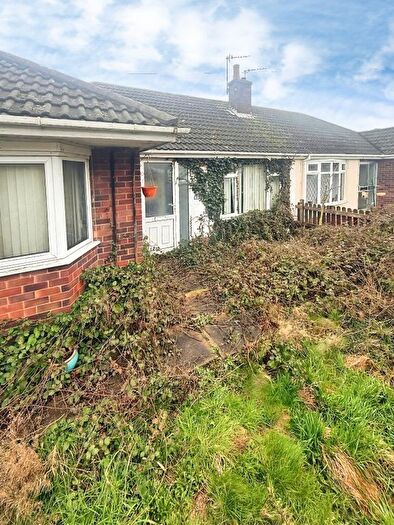
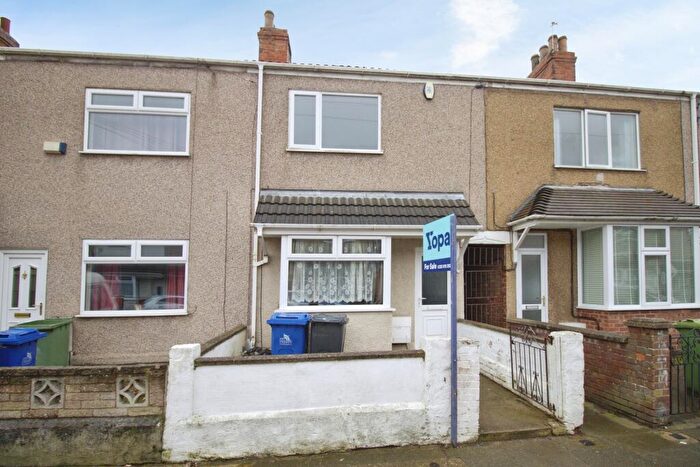
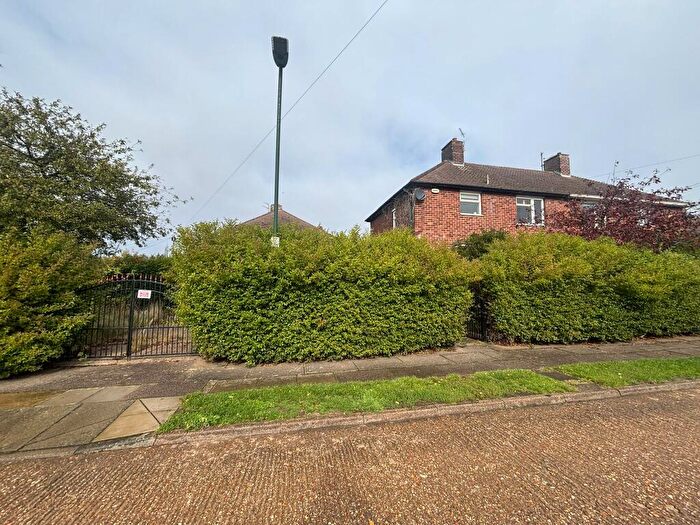
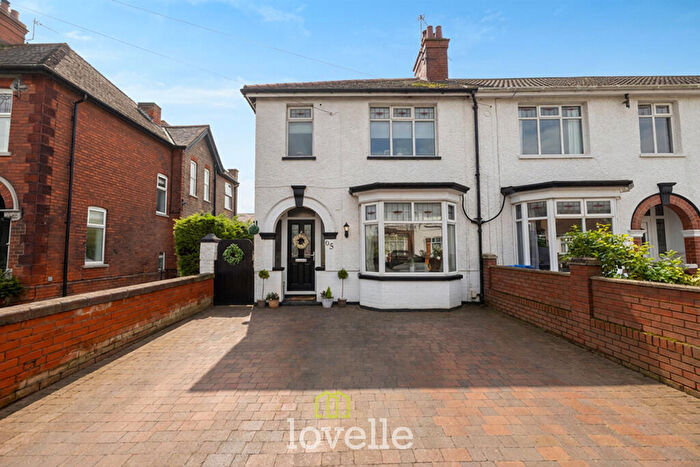
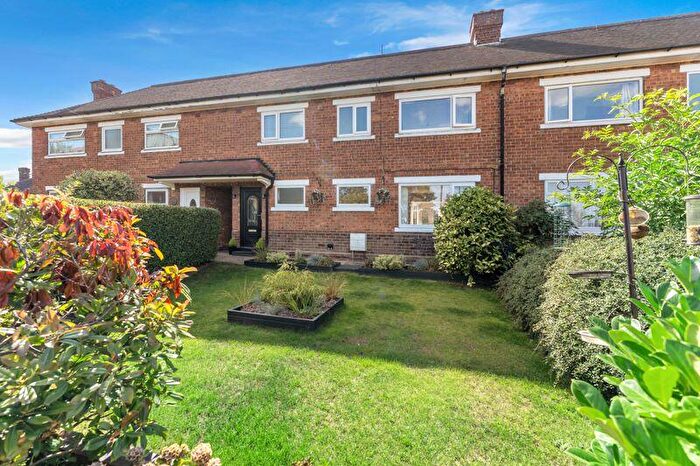
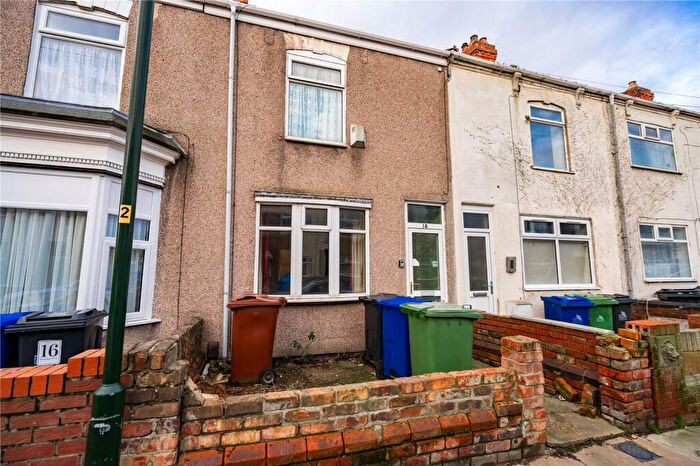
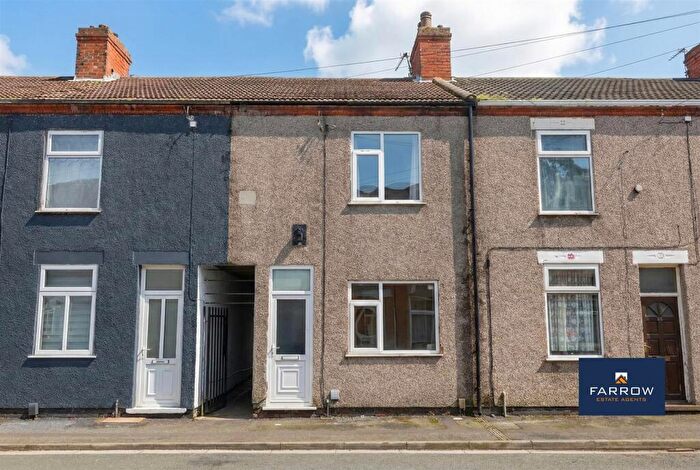
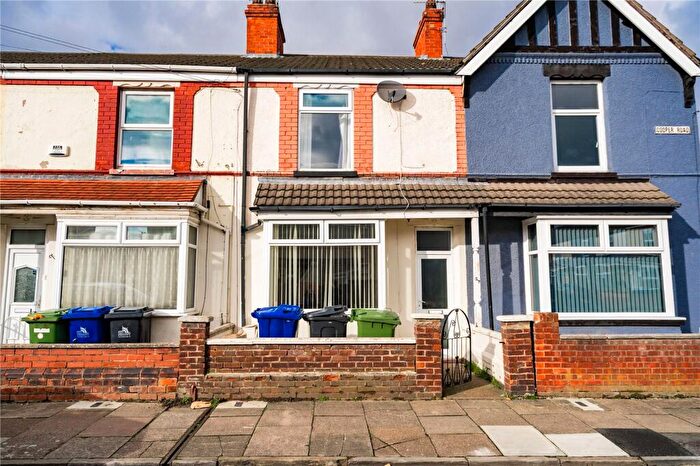
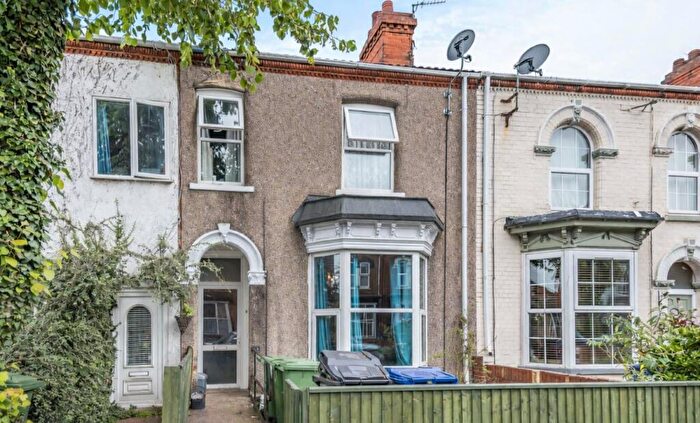
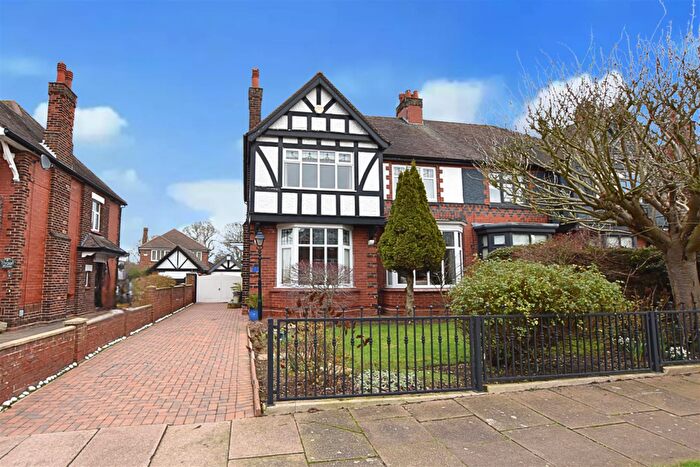
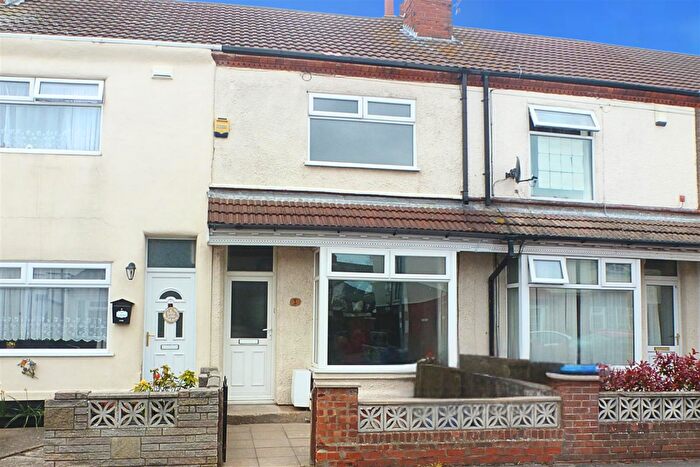
Houses for sale & to rent in Cleethorpes, North East Lincolnshire
House Prices in Cleethorpes
Properties in Cleethorpes have an average house price of £154,689.00 and had 1,625 Property Transactions within the last 3 years.¹
Cleethorpes is an area in North East Lincolnshire with 15,431 households², where the most expensive property was sold for £950,000.00.
Properties for sale in Cleethorpes
Neighbourhoods in Cleethorpes
Navigate through our locations to find the location of your next house in Cleethorpes, North East Lincolnshire for sale or to rent.
Transport in Cleethorpes
Please see below transportation links in this area:
- FAQ
- Price Paid By Year
- Property Type Price
Frequently asked questions about Cleethorpes
What is the average price for a property for sale in Cleethorpes?
The average price for a property for sale in Cleethorpes is £154,689. This amount is 2% higher than the average price in North East Lincolnshire. There are 4,050 property listings for sale in Cleethorpes.
What locations have the most expensive properties for sale in Cleethorpes?
The locations with the most expensive properties for sale in Cleethorpes are Haverstoe at an average of £245,441 and Croft Baker at an average of £149,452.
What locations have the most affordable properties for sale in Cleethorpes?
The location with the most affordable properties for sale in Cleethorpes is Sidney Sussex at an average of £103,244.
Which train stations are available in or near Cleethorpes?
Some of the train stations available in or near Cleethorpes are Cleethorpes, New Clee and Grimsby Docks.
Property Price Paid in Cleethorpes by Year
The average sold property price by year was:
| Year | Average Sold Price | Price Change |
Sold Properties
|
|---|---|---|---|
| 2025 | £158,798 | 2% |
472 Properties |
| 2024 | £155,828 | 4% |
589 Properties |
| 2023 | £150,060 | -5% |
564 Properties |
| 2022 | £158,077 | 8% |
715 Properties |
| 2021 | £145,394 | 3% |
771 Properties |
| 2020 | £141,464 | 5% |
512 Properties |
| 2019 | £134,418 | 2% |
664 Properties |
| 2018 | £131,301 | 4% |
601 Properties |
| 2017 | £126,390 | -5% |
658 Properties |
| 2016 | £132,861 | 5% |
676 Properties |
| 2015 | £126,276 | 3% |
512 Properties |
| 2014 | £122,189 | 4% |
576 Properties |
| 2013 | £117,545 | -3% |
518 Properties |
| 2012 | £120,600 | 1% |
446 Properties |
| 2011 | £118,976 | - |
427 Properties |
| 2010 | £118,978 | -5% |
407 Properties |
| 2009 | £124,401 | 5% |
382 Properties |
| 2008 | £117,625 | -9% |
463 Properties |
| 2007 | £127,964 | 12% |
929 Properties |
| 2006 | £112,922 | 8% |
1,020 Properties |
| 2005 | £104,186 | 11% |
751 Properties |
| 2004 | £92,350 | 20% |
1,016 Properties |
| 2003 | £73,444 | 23% |
1,072 Properties |
| 2002 | £56,613 | 12% |
1,050 Properties |
| 2001 | £49,637 | 11% |
927 Properties |
| 2000 | £44,319 | -6% |
776 Properties |
| 1999 | £47,015 | 6% |
820 Properties |
| 1998 | £44,213 | 1% |
789 Properties |
| 1997 | £43,728 | 7% |
794 Properties |
| 1996 | £40,610 | -3% |
825 Properties |
| 1995 | £41,944 | - |
735 Properties |
Property Price per Property Type in Cleethorpes
Here you can find historic sold price data in order to help with your property search.
The average Property Paid Price for specific property types in the last three years are:
| Property Type | Average Sold Price | Sold Properties |
|---|---|---|
| Semi Detached House | £180,998.00 | 512 Semi Detached Houses |
| Detached House | £285,047.00 | 209 Detached Houses |
| Terraced House | £107,985.00 | 811 Terraced Houses |
| Flat | £124,169.00 | 93 Flats |

