
Houses for sale & to rent in Sidney Sussex, Cleethorpes
House Prices in Sidney Sussex
Properties in Sidney Sussex have an average house price of £105,127.00 and had 905 Property Transactions within the last 3 years¹.
Sidney Sussex is an area in Cleethorpes, North East Lincolnshire with 5,391 households², where the most expensive property was sold for £275,000.00.
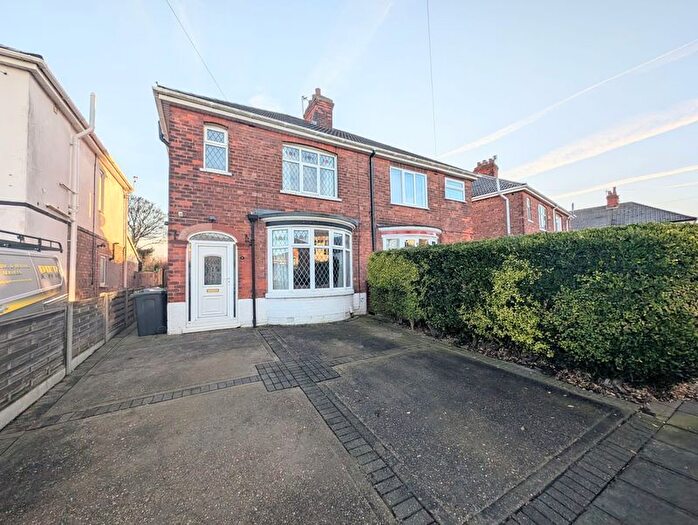
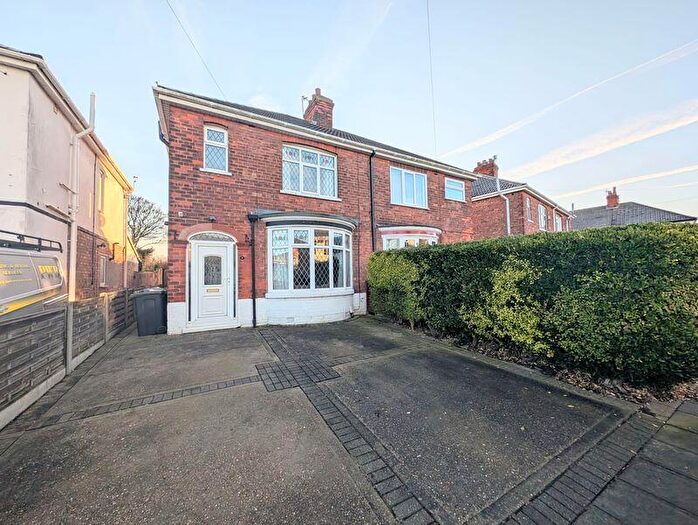
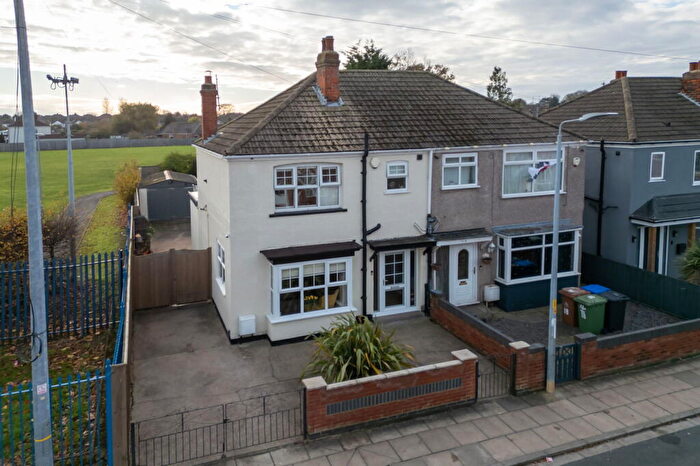
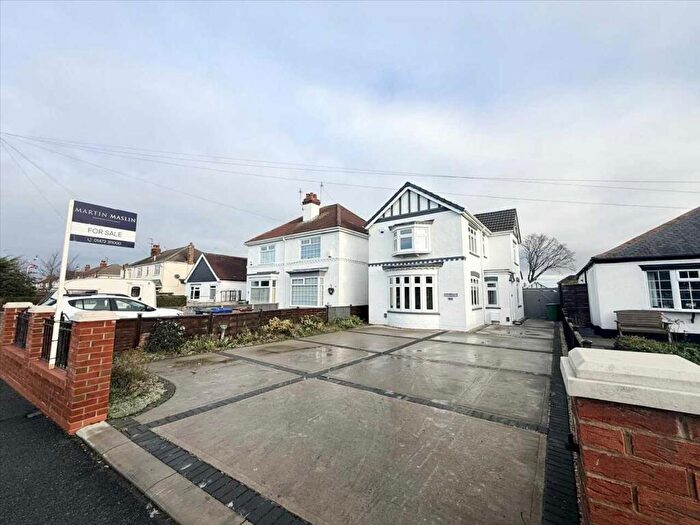
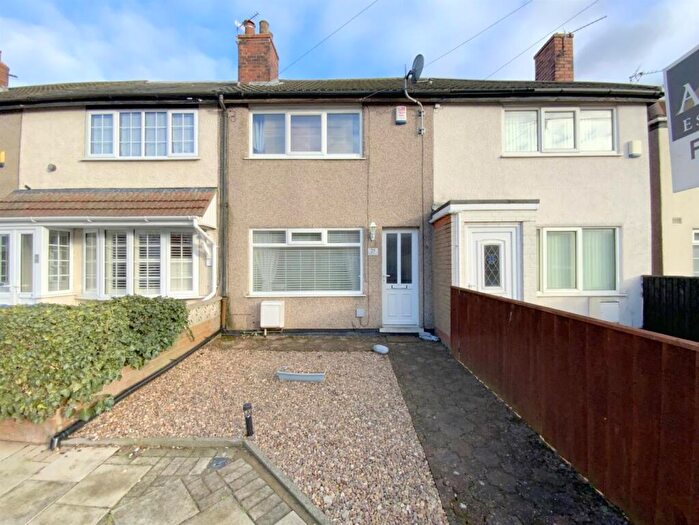
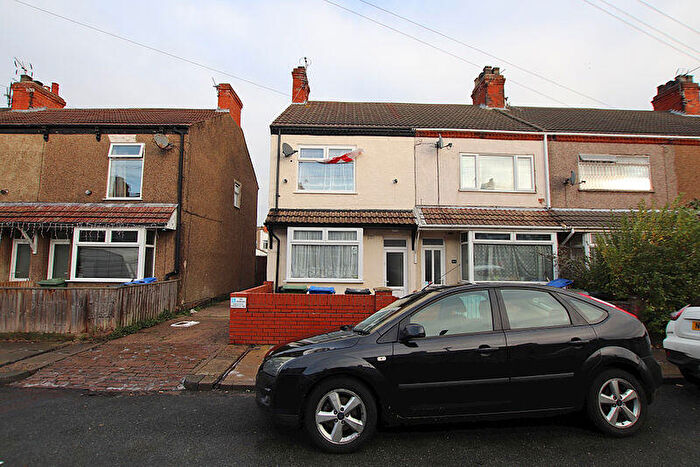
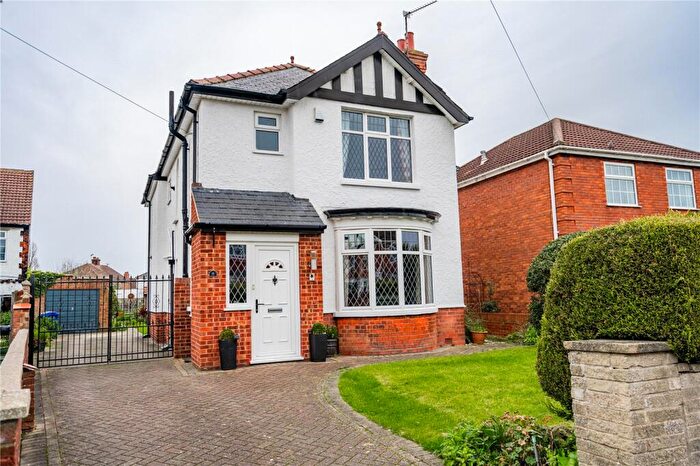
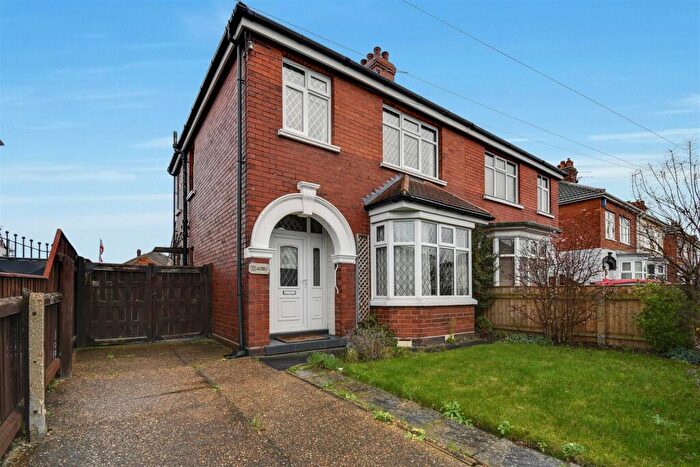
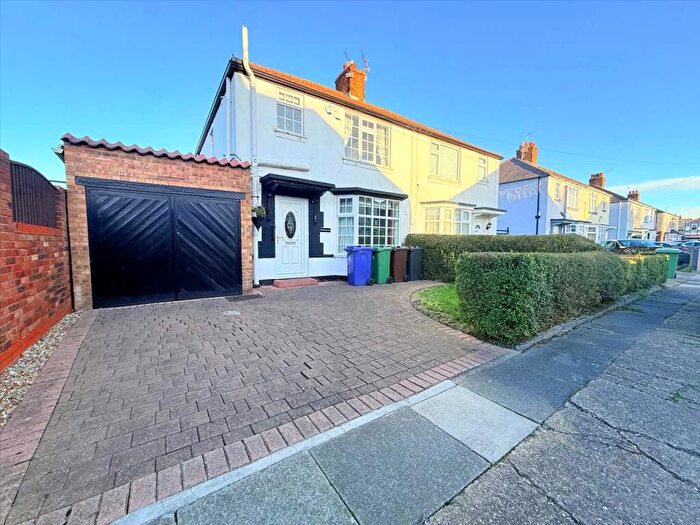
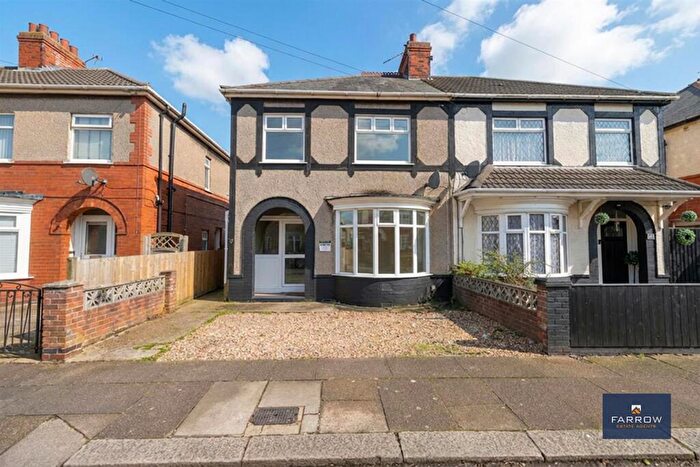
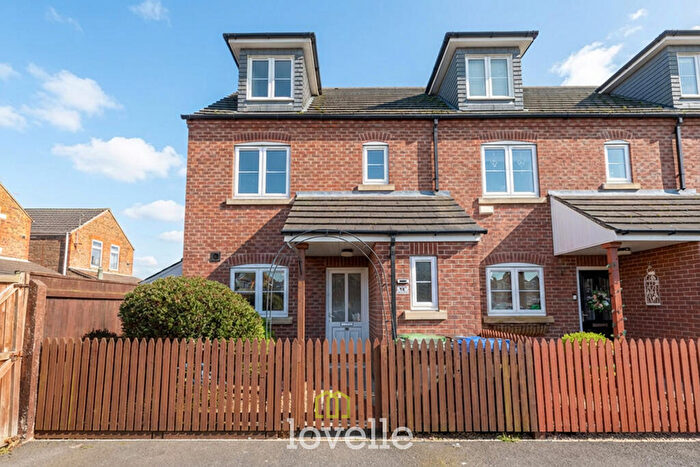
Properties for sale in Sidney Sussex
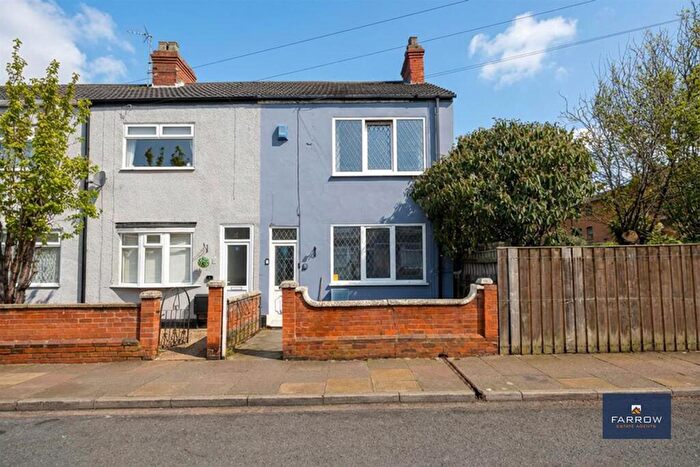
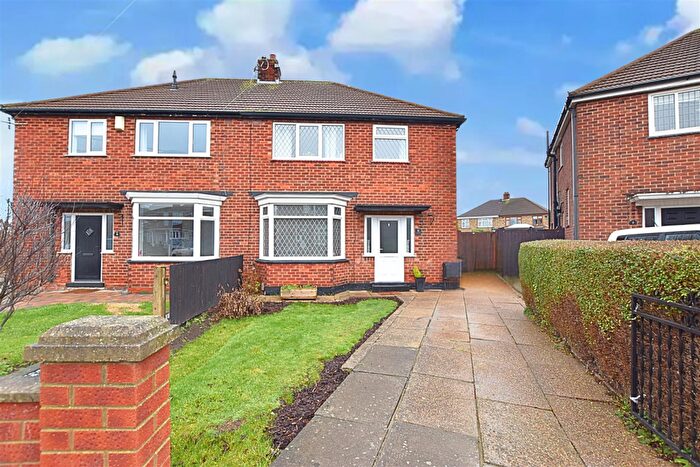
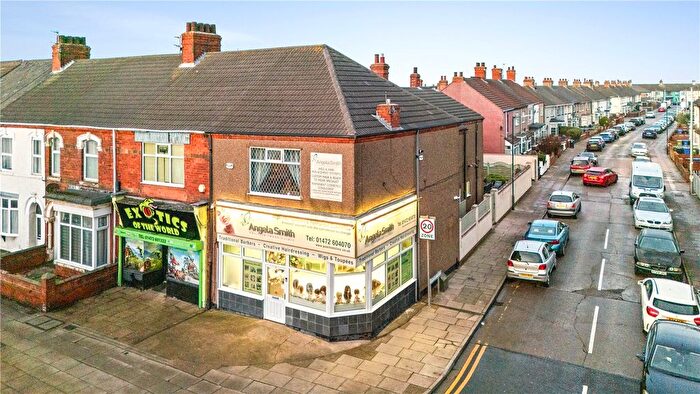
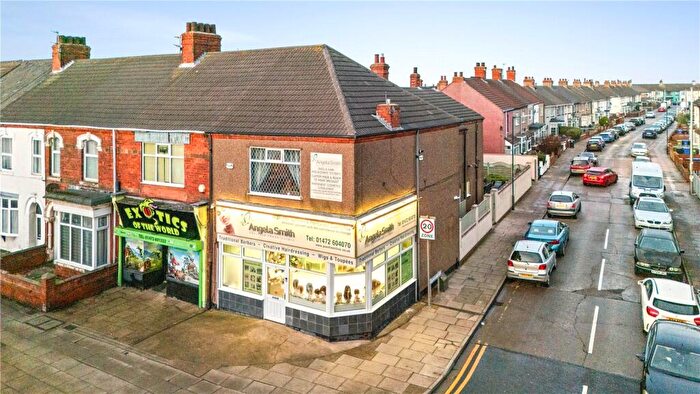
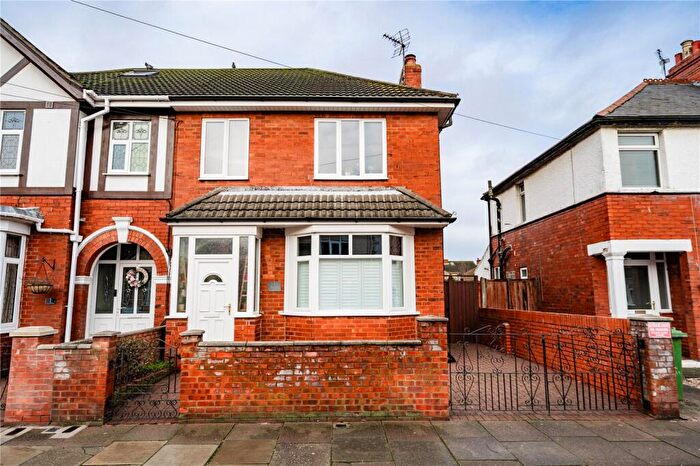
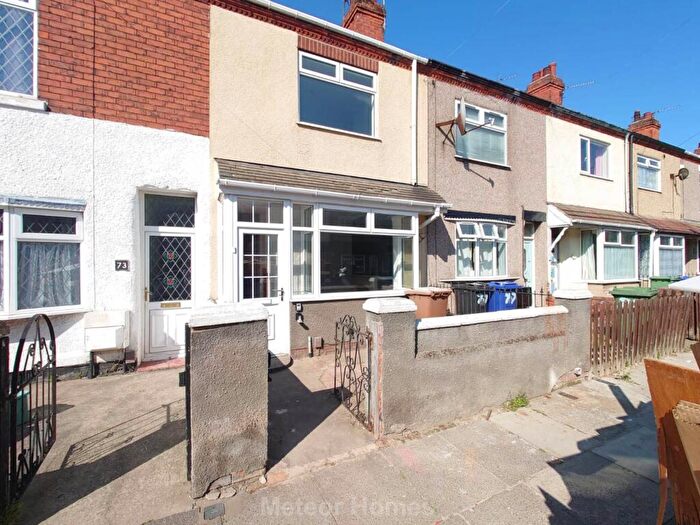
![]()
If you are looking to sell your house, let it out, or receive a property valuation, an expert can help you.
Click the button below to get started.


Roads and Postcodes in Sidney Sussex
Navigate through our locations to find the location of your next house in Sidney Sussex, Cleethorpes for sale or to rent.
Transport near Sidney Sussex

- FAQ
- Price Paid By Year
- Property Type Price
Frequently asked questions about Sidney Sussex
What is the average price for a property for sale in Sidney Sussex?
The average price for a property for sale in Sidney Sussex is £105,127. This amount is 33% lower than the average price in Cleethorpes. There are 1,140 property listings for sale in Sidney Sussex.
What streets have the most expensive properties for sale in Sidney Sussex?
The streets with the most expensive properties for sale in Sidney Sussex are Twyning Place at an average of £235,000, Barnett Place at an average of £234,925 and Stanhope Place at an average of £197,666.
What streets have the most affordable properties for sale in Sidney Sussex?
The streets with the most affordable properties for sale in Sidney Sussex are Sidney Court at an average of £45,000, Sidney Street at an average of £57,593 and Sidney Way at an average of £64,125.
Which train stations are available in or near Sidney Sussex?
Some of the train stations available in or near Sidney Sussex are Cleethorpes, New Clee and Grimsby Docks.
Property Price Paid in Sidney Sussex by Year
The average sold property price by year was:
| Year | Average Sold Price | Price Change |
Sold Properties
|
|---|---|---|---|
| 2025 | £105,818 | -1% |
136 Properties |
| 2024 | £107,194 | 6% |
229 Properties |
| 2023 | £100,774 | -6% |
233 Properties |
| 2022 | £106,583 | 11% |
307 Properties |
| 2021 | £95,256 | 4% |
300 Properties |
| 2020 | £91,396 | -1% |
190 Properties |
| 2019 | £92,158 | -2% |
270 Properties |
| 2018 | £93,650 | 7% |
245 Properties |
| 2017 | £87,139 | 3% |
231 Properties |
| 2016 | £84,494 | -3% |
198 Properties |
| 2015 | £87,162 | 9% |
173 Properties |
| 2014 | £79,137 | 1% |
175 Properties |
| 2013 | £78,714 | 0,1% |
170 Properties |
| 2012 | £78,648 | 2% |
139 Properties |
| 2011 | £77,119 | -15% |
133 Properties |
| 2010 | £88,678 | 2% |
132 Properties |
| 2009 | £86,745 | -12% |
111 Properties |
| 2008 | £97,255 | -3% |
213 Properties |
| 2007 | £99,892 | 14% |
411 Properties |
| 2006 | £85,869 | 7% |
448 Properties |
| 2005 | £80,074 | 15% |
321 Properties |
| 2004 | £67,809 | 20% |
452 Properties |
| 2003 | £54,214 | 25% |
529 Properties |
| 2002 | £40,831 | 12% |
474 Properties |
| 2001 | £35,852 | 10% |
374 Properties |
| 2000 | £32,275 | 1% |
336 Properties |
| 1999 | £32,092 | 4% |
300 Properties |
| 1998 | £30,805 | -3% |
294 Properties |
| 1997 | £31,747 | 7% |
274 Properties |
| 1996 | £29,371 | -15% |
326 Properties |
| 1995 | £33,821 | - |
311 Properties |
Property Price per Property Type in Sidney Sussex
Here you can find historic sold price data in order to help with your property search.
The average Property Paid Price for specific property types in the last three years are:
| Property Type | Average Sold Price | Sold Properties |
|---|---|---|
| Flat | £80,656.00 | 30 Flats |
| Semi Detached House | £156,190.00 | 189 Semi Detached Houses |
| Detached House | £214,660.00 | 15 Detached Houses |
| Terraced House | £89,390.00 | 671 Terraced Houses |