
Houses for sale & to rent in Croft Baker, Cleethorpes
House Prices in Croft Baker
Properties in Croft Baker have an average house price of £150k and had 590 Property Transactions within the last 3 years¹.
Croft Baker is an area in Cleethorpes, North East Lincolnshire with 5,620 households², where the most expensive property was sold for £470k.
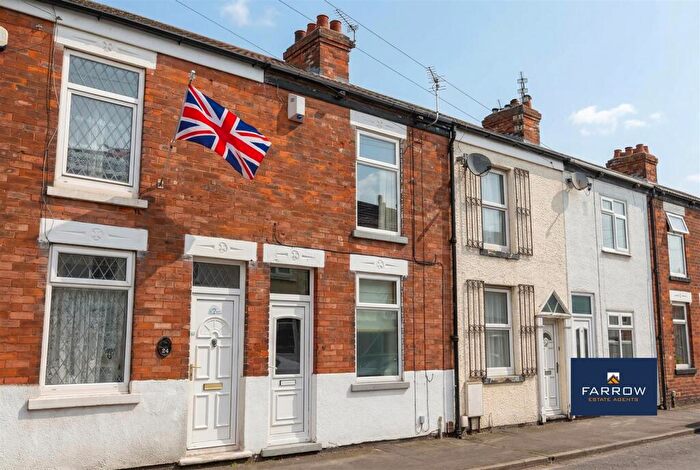
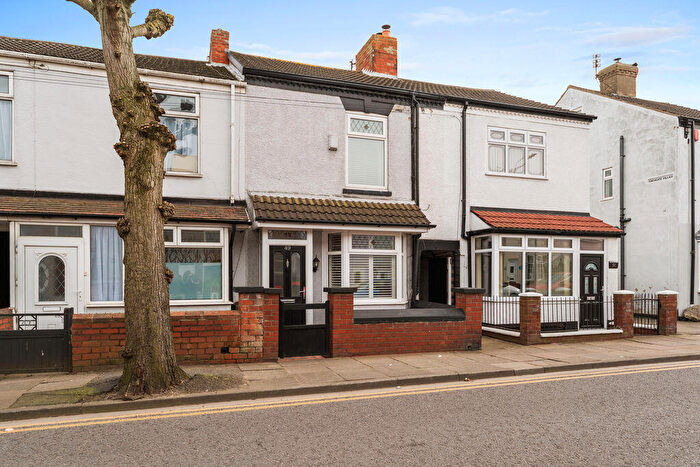
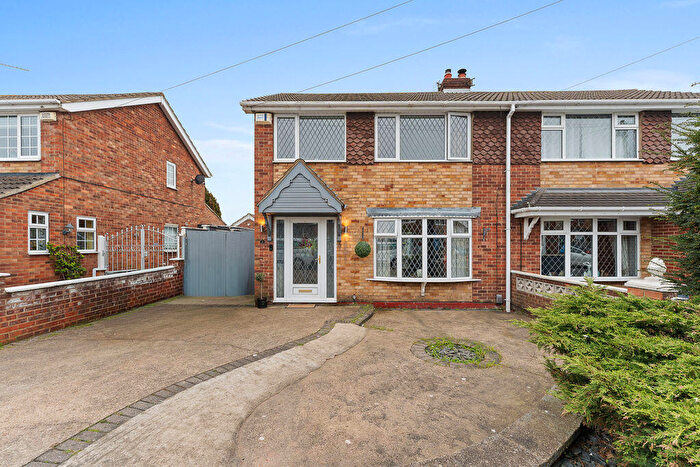
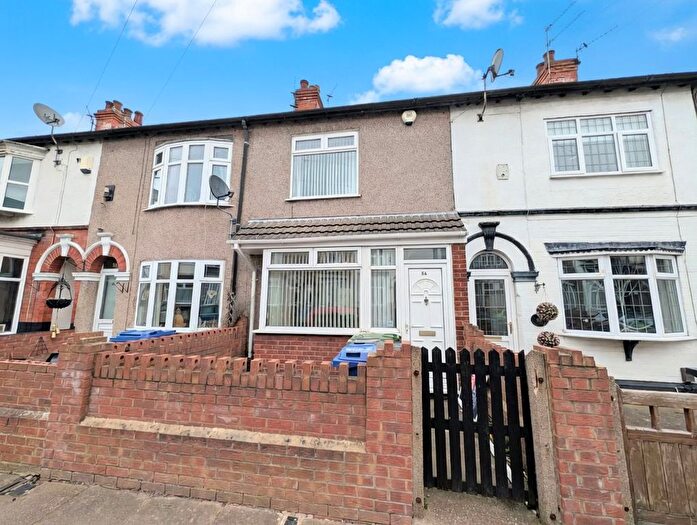
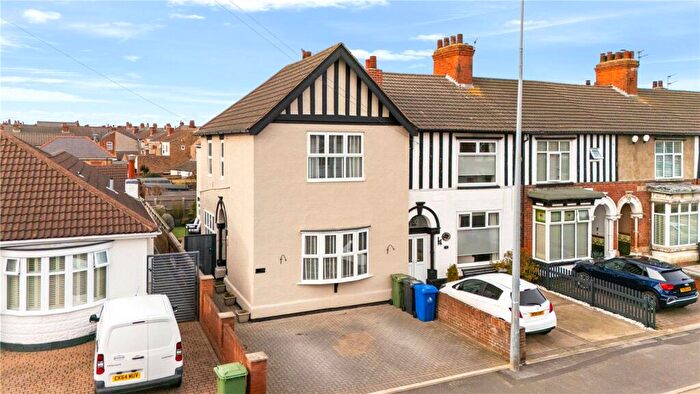
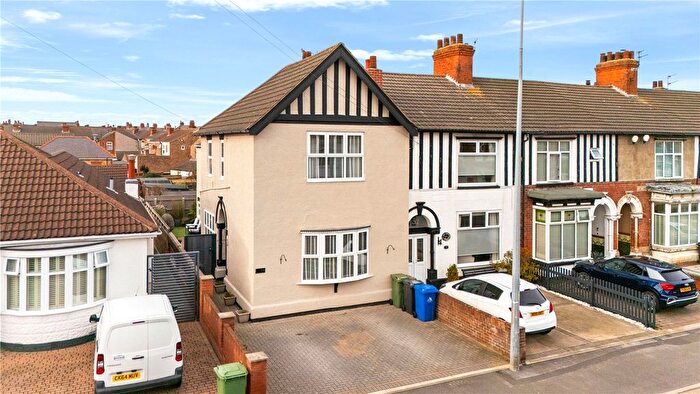
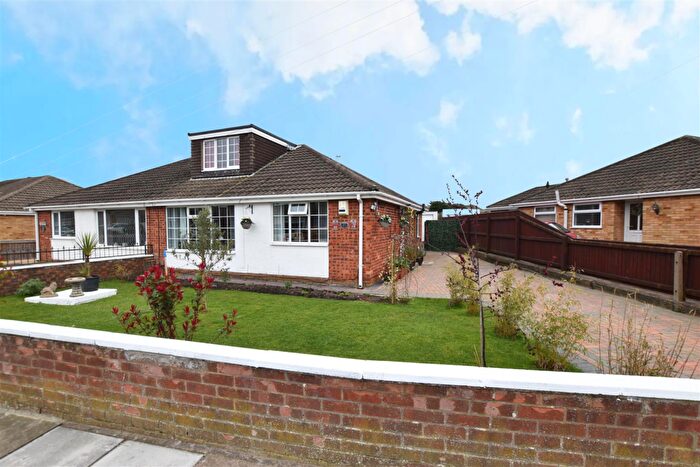
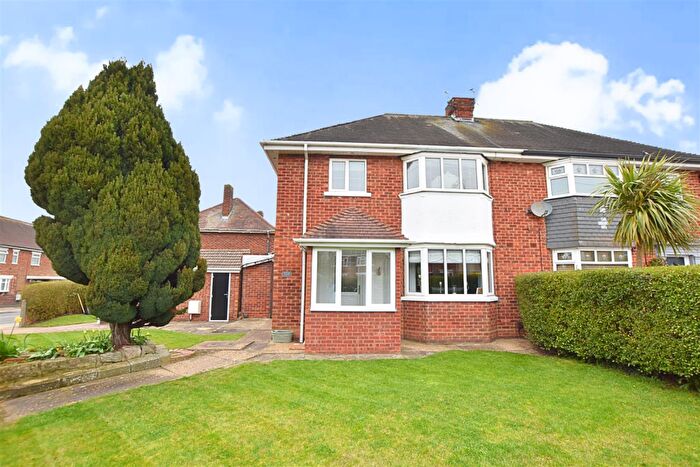
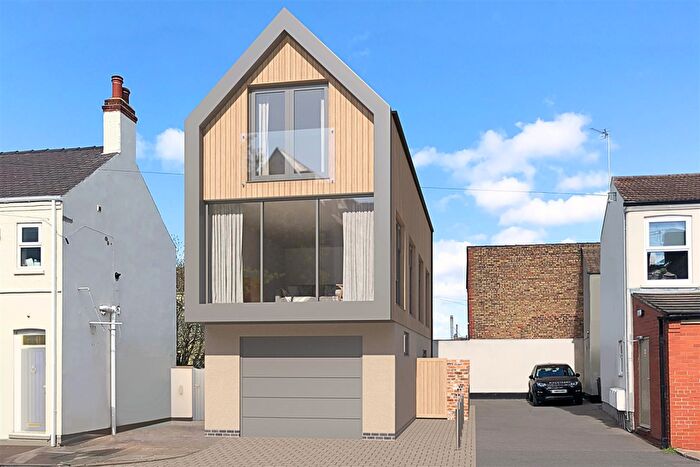
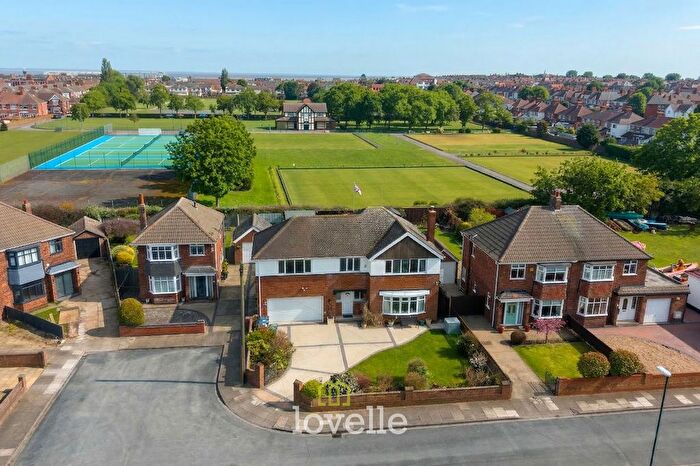
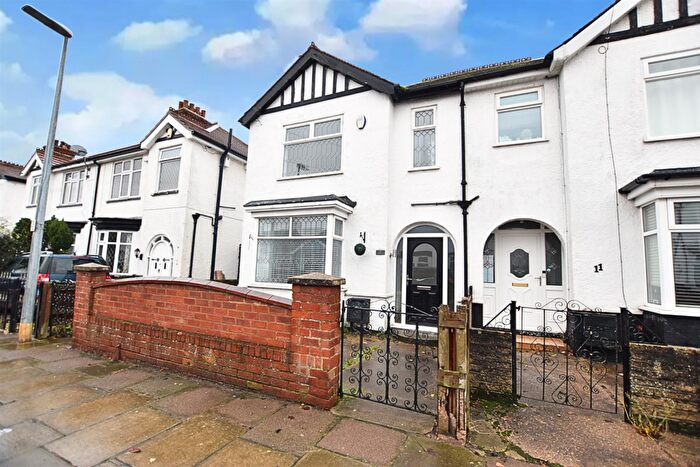
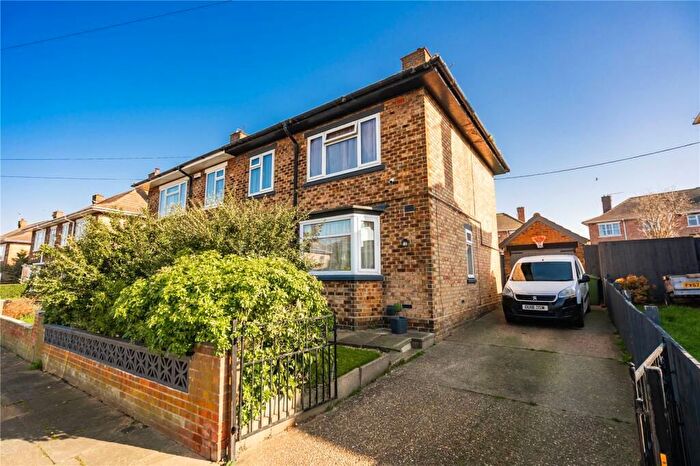
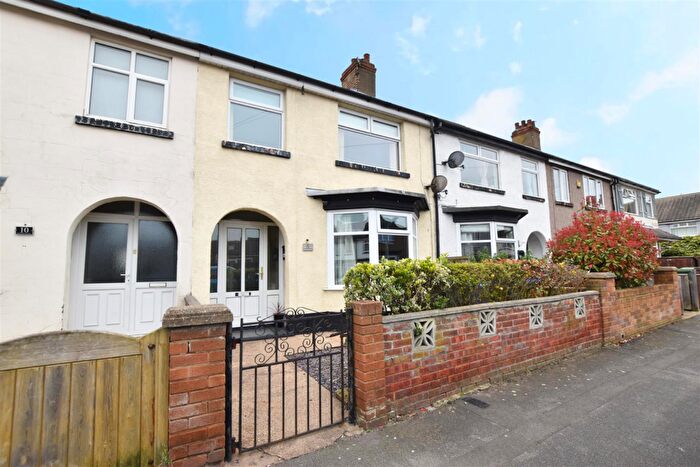
Properties for sale in Croft Baker
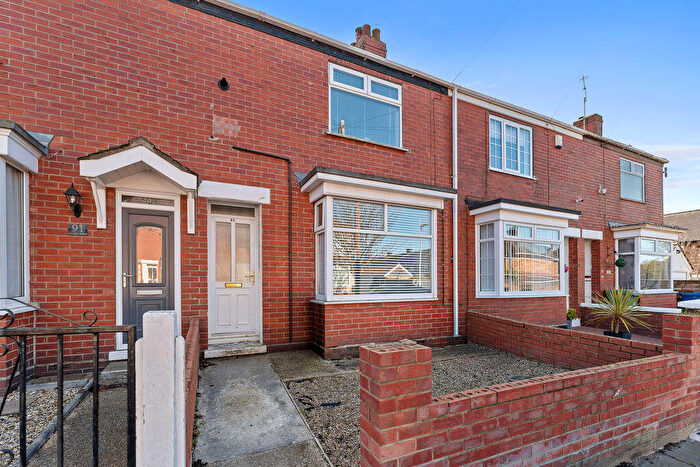

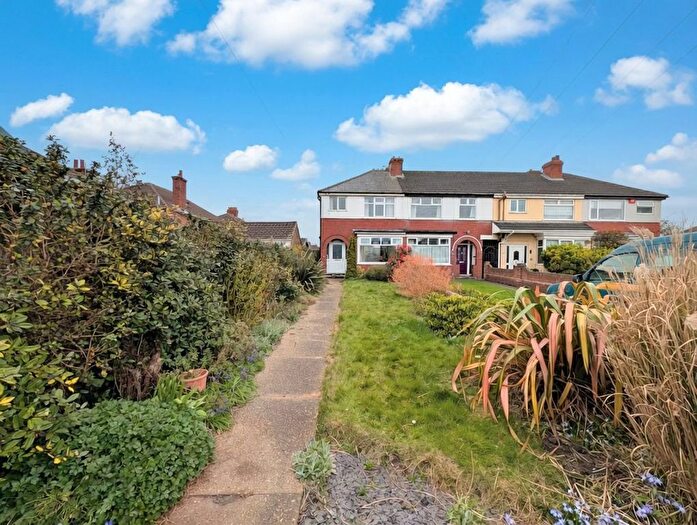
![]()
If you are looking to sell your house, let it out, or receive a property valuation, an expert can help you.
Click the button below to get started.


Roads and Postcodes in Croft Baker
Navigate through our locations to find the location of your next house in Croft Baker, Cleethorpes for sale or to rent.
Transport near Croft Baker

- FAQ
- Price Paid By Year
- Property Type Price
Frequently asked questions about Croft Baker
What is the average price for a property for sale in Croft Baker?
The average price for a property for sale in Croft Baker is £150,105. This amount is 3% lower than the average price in Cleethorpes. There are 1,004 property listings for sale in Croft Baker.
What streets have the most expensive properties for sale in Croft Baker?
The streets with the most expensive properties for sale in Croft Baker are Brooklands Avenue at an average of £305,000, Kingsway at an average of £254,333 and Queens Parade at an average of £252,410.
What streets have the most affordable properties for sale in Croft Baker?
The streets with the most affordable properties for sale in Croft Baker are Mollison Avenue at an average of £72,500, Hinkler Street at an average of £74,333 and Frederick Street at an average of £83,500.
Which train stations are available in or near Croft Baker?
Some of the train stations available in or near Croft Baker are Cleethorpes, New Clee and Grimsby Docks.
Property Price Paid in Croft Baker by Year
The average sold property price by year was:
| Year | Average Sold Price | Price Change |
Sold Properties
|
|---|---|---|---|
| 2026 | £186,337 | 18% |
8 Properties |
| 2025 | £153,405 | 4% |
178 Properties |
| 2024 | £147,342 | -1% |
199 Properties |
| 2023 | £148,507 | -7% |
205 Properties |
| 2022 | £159,105 | 14% |
250 Properties |
| 2021 | £137,175 | 7% |
277 Properties |
| 2020 | £127,875 | -1% |
171 Properties |
| 2019 | £128,597 | 4% |
227 Properties |
| 2018 | £122,815 | 6% |
202 Properties |
| 2017 | £114,851 | -3% |
244 Properties |
| 2016 | £118,556 | 4% |
232 Properties |
| 2015 | £114,188 | -1% |
178 Properties |
| 2014 | £115,604 | 7% |
222 Properties |
| 2013 | £107,558 | -3% |
182 Properties |
| 2012 | £110,693 | 1% |
164 Properties |
| 2011 | £109,519 | 6% |
157 Properties |
| 2010 | £102,462 | -2% |
154 Properties |
| 2009 | £104,895 | -8% |
133 Properties |
| 2008 | £113,159 | -11% |
152 Properties |
| 2007 | £126,012 | 13% |
309 Properties |
| 2006 | £109,902 | 10% |
333 Properties |
| 2005 | £98,722 | 11% |
265 Properties |
| 2004 | £87,921 | 21% |
333 Properties |
| 2003 | £69,809 | 24% |
315 Properties |
| 2002 | £53,389 | 15% |
339 Properties |
| 2001 | £45,260 | 7% |
311 Properties |
| 2000 | £42,038 | 1% |
253 Properties |
| 1999 | £41,783 | 9% |
238 Properties |
| 1998 | £38,166 | -1% |
253 Properties |
| 1997 | £38,386 | 5% |
283 Properties |
| 1996 | £36,458 | 2% |
257 Properties |
| 1995 | £35,875 | - |
212 Properties |
Property Price per Property Type in Croft Baker
Here you can find historic sold price data in order to help with your property search.
The average Property Paid Price for specific property types in the last three years are:
| Property Type | Average Sold Price | Sold Properties |
|---|---|---|
| Flat | £136,217.00 | 55 Flats |
| Semi Detached House | £165,967.00 | 221 Semi Detached Houses |
| Detached House | £259,166.00 | 27 Detached Houses |
| Terraced House | £130,292.00 | 287 Terraced Houses |