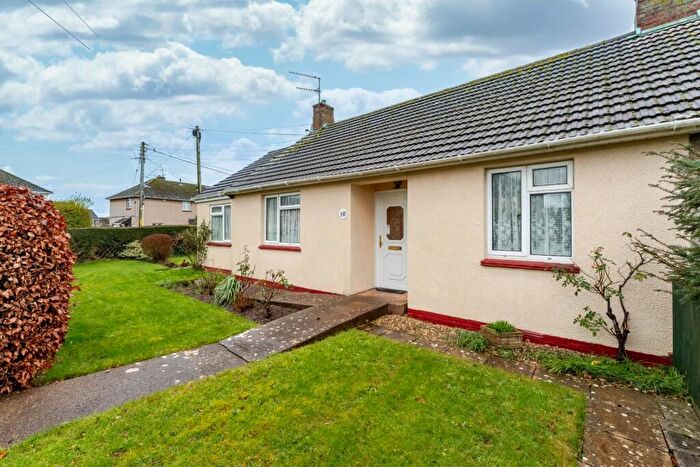
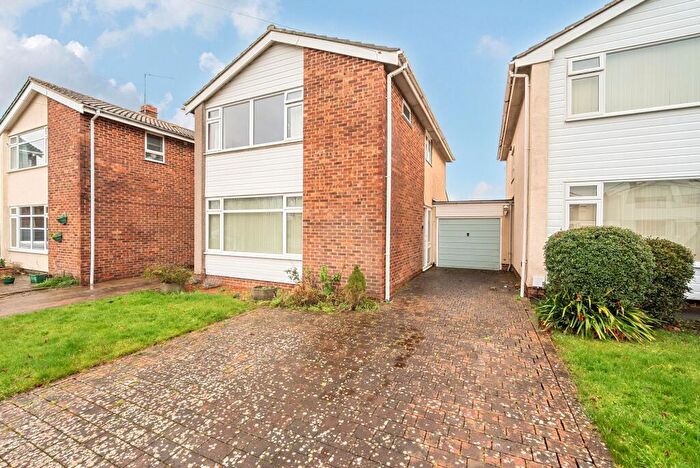
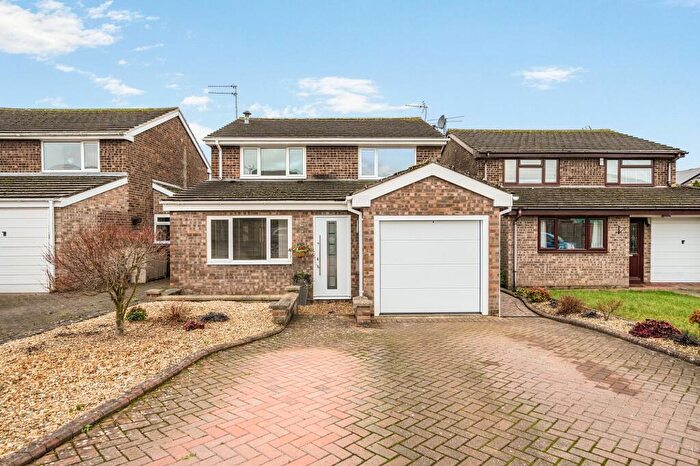
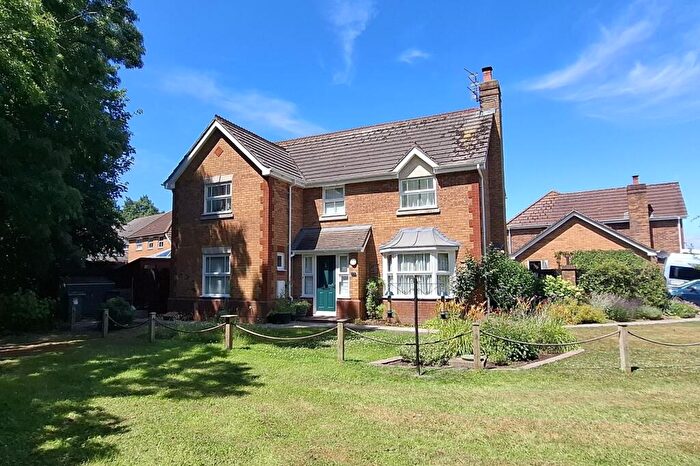
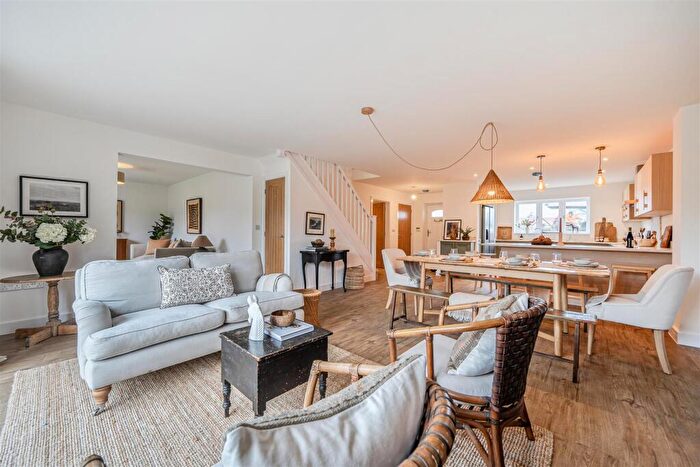
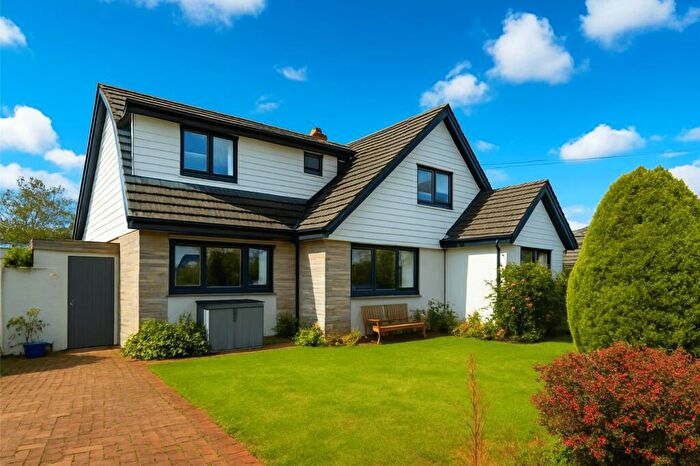
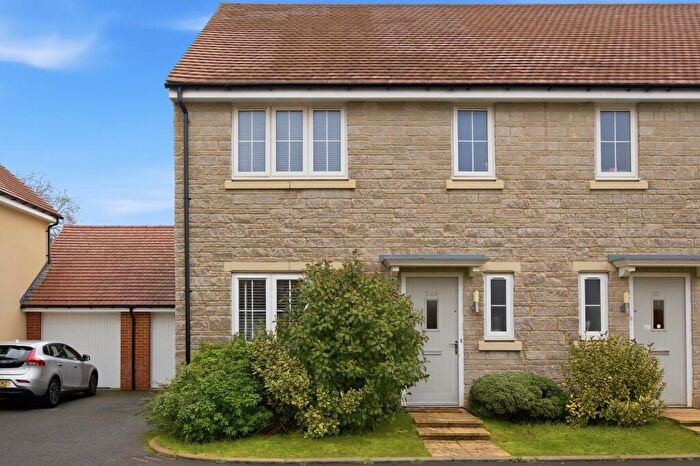
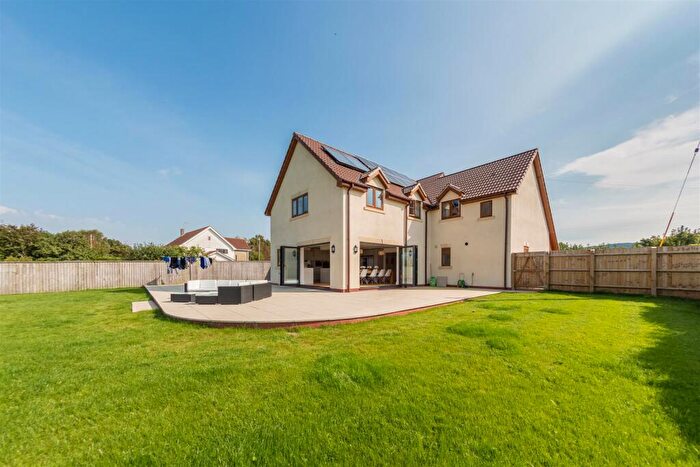
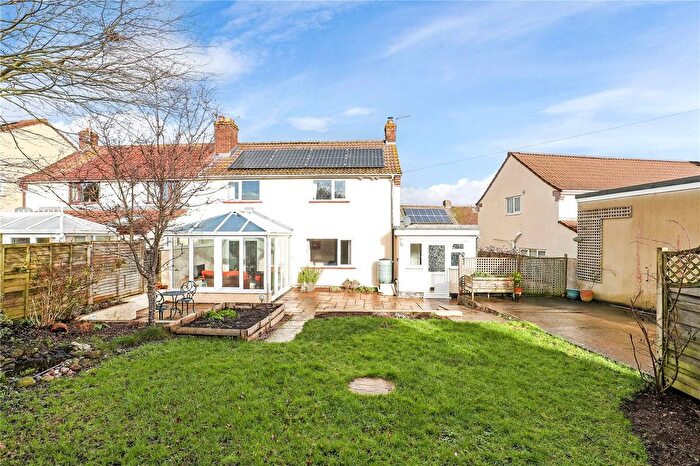
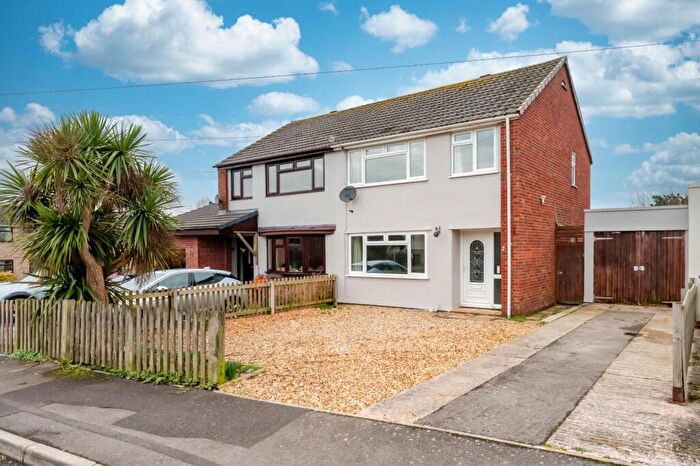
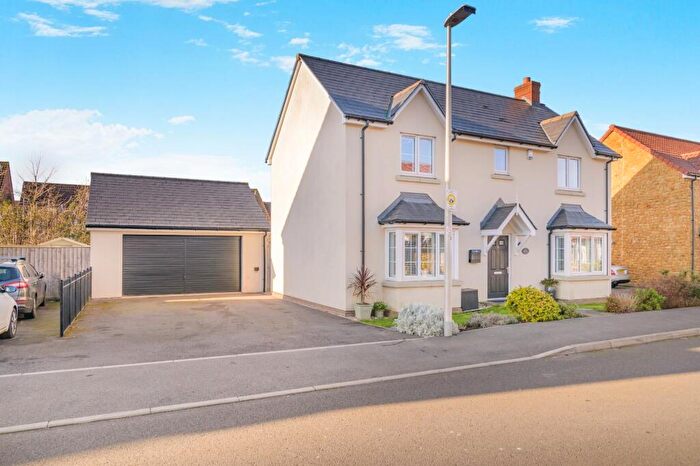
Houses for sale & to rent in Congresbury, Bristol
House Prices in Congresbury
Properties in Congresbury have an average house price of £453,676.00 and had 124 Property Transactions within the last 3 years¹.
Congresbury is an area in Bristol, North Somerset with 1,308 households², where the most expensive property was sold for £1,180,000.00.
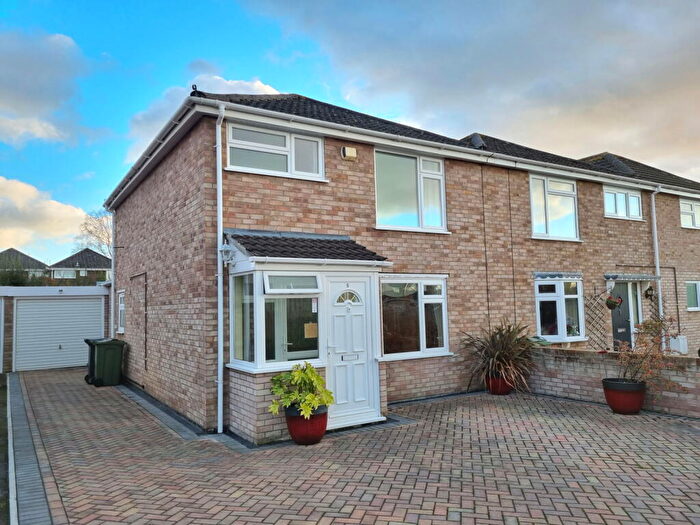
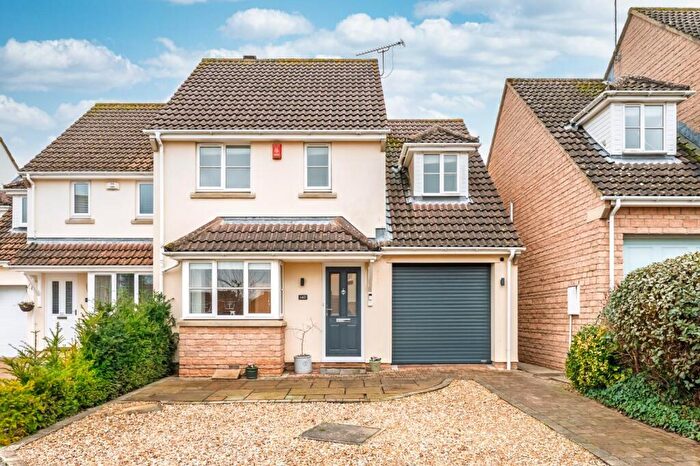
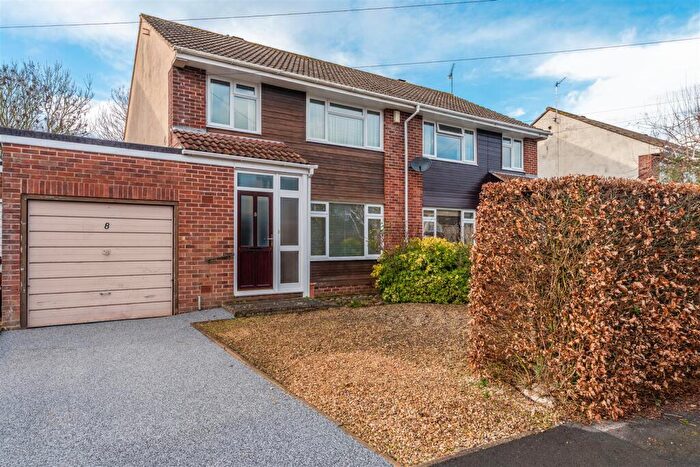
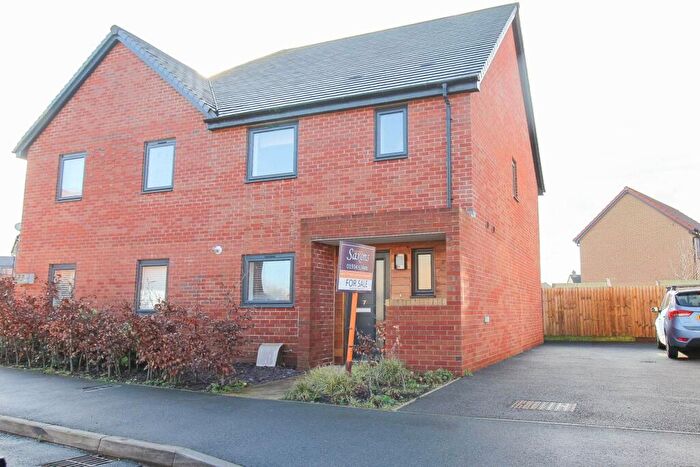
Properties for sale in Congresbury
Roads and Postcodes in Congresbury
Navigate through our locations to find the location of your next house in Congresbury, Bristol for sale or to rent.
| Streets | Postcodes |
|---|---|
| Bramley Square | BS49 5HP |
| Bridge Farm Square | BS49 5DF |
| Brinsea | BS49 5JL BS49 5JP |
| Brinsea Lane | BS49 5JN |
| Brinsea Road | BS49 5JF BS49 5JG BS49 5JH BS49 5JJ BS49 5JQ |
| Bristol Road | BS49 5AH BS49 5BG BS49 5DU |
| Broad Street | BS49 5DG |
| Cadbury Square | BS49 5HW |
| Cobthorn Way | BS49 5BJ |
| Dickensons Grove | BS49 5HQ |
| Frost Hill | BS49 5AD |
| Glen Yeo Terrace | BS49 5EA |
| Gooseham Mead | BS49 5BX |
| High Street | BS49 5JA |
| Hill Park | BS49 5BT |
| Homefield | BS49 5HG |
| Honeyhall Lane | BS49 5JX |
| Iwood | BS40 5NU BS40 5NX |
| Kent Road | BS49 5AZ BS49 5BA BS49 5BD BS49 5BE |
| Mill Lane | BS49 5JD |
| Mill Leg | BS49 5JE |
| Mulberry Road | BS49 5HD |
| Nomis Park | BS49 5HB |
| Orchard Close | BS49 5JZ |
| Park Mews | BS49 5HR |
| Park Road | BS49 5HE BS49 5HH BS49 5HJ BS49 5HN |
| Pauls Causeway | BS49 5DH BS49 5DQ |
| Rhodyate Hill | BS49 5AJ BS49 5AQ |
| Sheppys Mill | BS49 5BY |
| Silver Mead | BS49 5EX |
| Silver Street | BS49 5EY |
| Silverstone Way | BS49 5ES |
| Smallway | BS49 5AA BS49 5BB |
| Southlands Way | BS49 5BP BS49 5BW |
| Southside | BS49 5BS |
| St Andrews Close | BS49 5DZ |
| Station Road | BS49 5DX BS49 5DY |
| Stonewell Drive | BS49 5DW |
| Stonewell Grove | BS49 5DR |
| Stonewell Lane | BS49 5DL BS49 5DN |
| Stonewell Park Road | BS49 5DP |
| The Causeway | BS49 5DJ |
| The Island | BS49 5AG |
| The Lyes | BS49 5HF |
| Urchinwood Lane | BS49 5AP |
| Venus Street | BS49 5EZ BS49 5HA |
| Verlands | BS49 5BL |
| Walnut Tree Court | BS49 5EN |
| Weetwood Road | BS49 5BN |
| Weir Road | BS49 5HL |
| Well Park | BS49 5BU |
| Weston Road | BS49 5ED |
| Woodhill | BS49 5AE BS49 5AF |
| Wrington Hill | BS40 5PT BS40 5PW |
| Wrington Lane | BS49 5BQ |
| Wrington Mead | BS49 5BH |
| Wrington Road | BS49 5AL BS49 5AN BS49 5AR BS49 5AS BS49 5AW |
| Yew Tree Park | BS49 5EP BS49 5ER |
Transport near Congresbury
- FAQ
- Price Paid By Year
- Property Type Price
Frequently asked questions about Congresbury
What is the average price for a property for sale in Congresbury?
The average price for a property for sale in Congresbury is £453,676. This amount is 0.9% lower than the average price in Bristol. There are 911 property listings for sale in Congresbury.
What streets have the most expensive properties for sale in Congresbury?
The streets with the most expensive properties for sale in Congresbury are Wrington Road at an average of £799,333, The Causeway at an average of £727,500 and Smallway at an average of £684,000.
What streets have the most affordable properties for sale in Congresbury?
The streets with the most affordable properties for sale in Congresbury are Sheppys Mill at an average of £167,916, Cadbury Square at an average of £189,333 and Hill Park at an average of £270,166.
Which train stations are available in or near Congresbury?
Some of the train stations available in or near Congresbury are Yatton, Nailsea and Backwell and Worle.
Property Price Paid in Congresbury by Year
The average sold property price by year was:
| Year | Average Sold Price | Price Change |
Sold Properties
|
|---|---|---|---|
| 2025 | £446,737 | 0,1% |
40 Properties |
| 2024 | £446,330 | -5% |
42 Properties |
| 2023 | £467,629 | 10% |
42 Properties |
| 2022 | £421,023 | 9% |
39 Properties |
| 2021 | £381,459 | -0,3% |
65 Properties |
| 2020 | £382,751 | 6% |
38 Properties |
| 2019 | £359,590 | -18% |
32 Properties |
| 2018 | £422,670 | 23% |
51 Properties |
| 2017 | £325,064 | -2% |
41 Properties |
| 2016 | £332,548 | 5% |
52 Properties |
| 2015 | £315,699 | 13% |
59 Properties |
| 2014 | £273,634 | 1% |
65 Properties |
| 2013 | £270,274 | 5% |
49 Properties |
| 2012 | £256,794 | 3% |
37 Properties |
| 2011 | £248,022 | -9% |
42 Properties |
| 2010 | £269,172 | 14% |
31 Properties |
| 2009 | £232,763 | -12% |
47 Properties |
| 2008 | £261,426 | -4% |
21 Properties |
| 2007 | £270,644 | 15% |
67 Properties |
| 2006 | £228,971 | 1% |
77 Properties |
| 2005 | £227,102 | -12% |
63 Properties |
| 2004 | £255,174 | 25% |
54 Properties |
| 2003 | £192,628 | 0,4% |
46 Properties |
| 2002 | £191,801 | 19% |
71 Properties |
| 2001 | £155,722 | 10% |
73 Properties |
| 2000 | £140,704 | 28% |
54 Properties |
| 1999 | £101,073 | -16% |
50 Properties |
| 1998 | £117,699 | 17% |
54 Properties |
| 1997 | £98,013 | 4% |
56 Properties |
| 1996 | £93,917 | 4% |
62 Properties |
| 1995 | £90,550 | - |
55 Properties |
Property Price per Property Type in Congresbury
Here you can find historic sold price data in order to help with your property search.
The average Property Paid Price for specific property types in the last three years are:
| Property Type | Average Sold Price | Sold Properties |
|---|---|---|
| Semi Detached House | £351,203.00 | 39 Semi Detached Houses |
| Detached House | £584,547.00 | 62 Detached Houses |
| Terraced House | £305,207.00 | 19 Terraced Houses |
| Flat | £129,500.00 | 4 Flats |

