Houses for sale & to rent in Bristol, North Somerset
House Prices in Bristol
Properties in Bristol have an average house price of £457,750.00 and had 3,513 Property Transactions within the last 3 years.¹
Bristol is an area in North Somerset with 34,435 households², where the most expensive property was sold for £4,800,000.00.
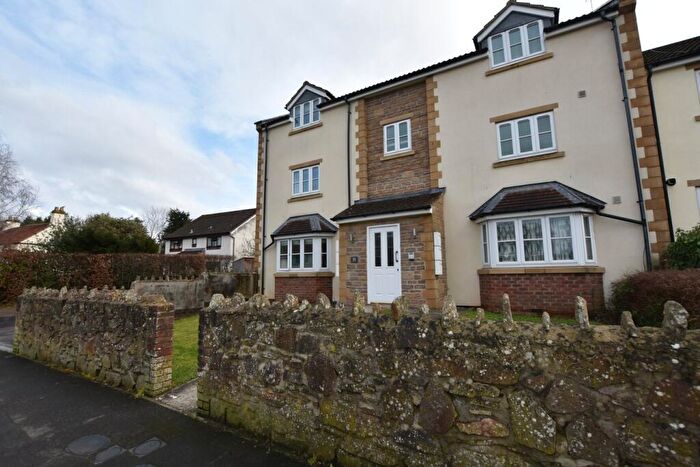
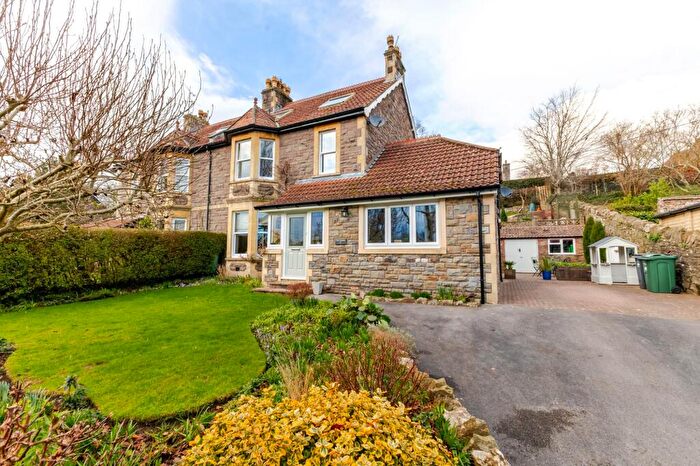
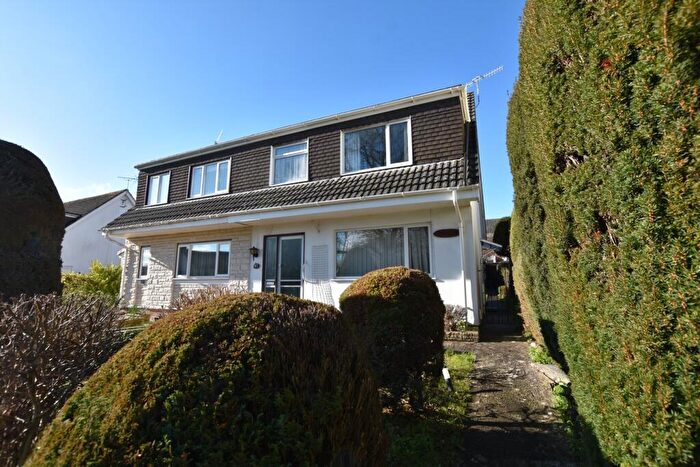
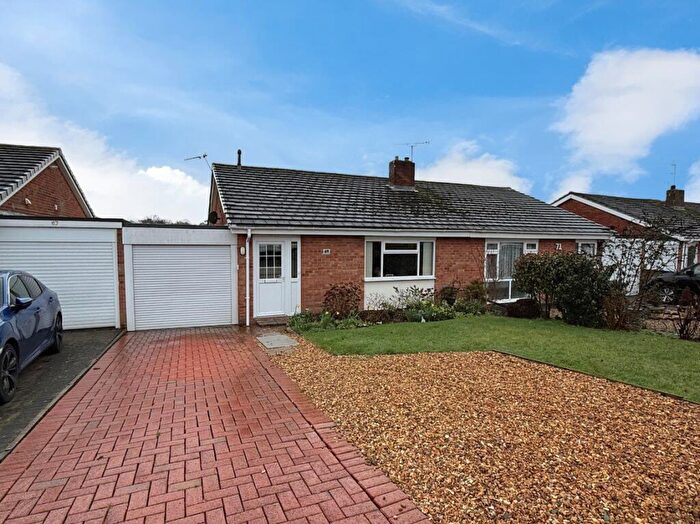
Properties for sale in Bristol
Neighbourhoods in Bristol
Navigate through our locations to find the location of your next house in Bristol, North Somerset for sale or to rent.
- Backwell
- Blagdon And Churchill
- Congresbury
- Easton-in-gordano
- Gordano
- Nailsea East
- Nailsea North And West
- Pill
- Portishead Central
- Portishead Coast
- Portishead East
- Portishead Redcliffe Bay
- Portishead South And North Weston
- Portishead West
- Winford
- Wraxall And Long Ashton
- Wrington
- Yatton
- Portishead North
- Gordano Valley
- Portishead South
- Blagdon & Churchill
- Congresbury & Puxton
- Long Ashton
- Nailsea Yeo
- Nailsea Golden Valley
- Nailsea Youngwood
- Nailsea West End
Transport in Bristol
Please see below transportation links in this area:
- FAQ
- Price Paid By Year
- Property Type Price
Frequently asked questions about Bristol
What is the average price for a property for sale in Bristol?
The average price for a property for sale in Bristol is £457,750. This amount is 28% higher than the average price in North Somerset. There are more than 10,000 property listings for sale in Bristol.
What locations have the most expensive properties for sale in Bristol?
The locations with the most expensive properties for sale in Bristol are Long Ashton at an average of £749,770, Easton-in-gordano at an average of £706,350 and Wraxall And Long Ashton at an average of £623,873.
What locations have the most affordable properties for sale in Bristol?
The locations with the most affordable properties for sale in Bristol are Nailsea Yeo at an average of £230,044, Nailsea Youngwood at an average of £320,188 and Pill at an average of £351,974.
Which train stations are available in or near Bristol?
Some of the train stations available in or near Bristol are Nailsea and Backwell, Yatton and Shirehampton.
Property Price Paid in Bristol by Year
The average sold property price by year was:
| Year | Average Sold Price | Price Change |
Sold Properties
|
|---|---|---|---|
| 2025 | £441,604 | -3% |
1,072 Properties |
| 2024 | £453,829 | -5% |
1,298 Properties |
| 2023 | £477,345 | 2% |
1,143 Properties |
| 2022 | £465,566 | 8% |
1,445 Properties |
| 2021 | £427,886 | 8% |
1,945 Properties |
| 2020 | £393,496 | 3% |
1,379 Properties |
| 2019 | £380,321 | -1% |
1,598 Properties |
| 2018 | £385,209 | 3% |
1,549 Properties |
| 2017 | £373,328 | 6% |
1,487 Properties |
| 2016 | £349,134 | 9% |
1,768 Properties |
| 2015 | £315,977 | 8% |
1,773 Properties |
| 2014 | £290,938 | 10% |
1,840 Properties |
| 2013 | £260,506 | 2% |
1,682 Properties |
| 2012 | £254,899 | 1% |
1,419 Properties |
| 2011 | £252,000 | -1% |
1,328 Properties |
| 2010 | £255,549 | 5% |
1,441 Properties |
| 2009 | £242,646 | -4% |
1,349 Properties |
| 2008 | £253,084 | -6% |
1,039 Properties |
| 2007 | £269,218 | 8% |
2,232 Properties |
| 2006 | £246,898 | 4% |
2,363 Properties |
| 2005 | £236,297 | 2% |
1,796 Properties |
| 2004 | £230,675 | 10% |
1,768 Properties |
| 2003 | £206,583 | 13% |
1,832 Properties |
| 2002 | £179,319 | 13% |
2,008 Properties |
| 2001 | £156,170 | 12% |
1,888 Properties |
| 2000 | £137,493 | 17% |
1,762 Properties |
| 1999 | £114,590 | 9% |
1,855 Properties |
| 1998 | £104,789 | 12% |
1,409 Properties |
| 1997 | £92,010 | 8% |
1,483 Properties |
| 1996 | £84,766 | -1% |
1,542 Properties |
| 1995 | £85,954 | - |
1,217 Properties |
Property Price per Property Type in Bristol
Here you can find historic sold price data in order to help with your property search.
The average Property Paid Price for specific property types in the last three years are:
| Property Type | Average Sold Price | Sold Properties |
|---|---|---|
| Semi Detached House | £399,753.00 | 967 Semi Detached Houses |
| Terraced House | £356,691.00 | 618 Terraced Houses |
| Detached House | £615,956.00 | 1,394 Detached Houses |
| Flat | £266,733.00 | 534 Flats |

