
Houses for sale & to rent in North Somerset, England
House Prices in North Somerset
Properties in North Somerset have
an average house price of
£358k
and had 10,424 Property Transactions
within the last 3 years.¹
North Somerset is a location in
England with
88,230 households², where the most expensive property was sold for £4.8M.
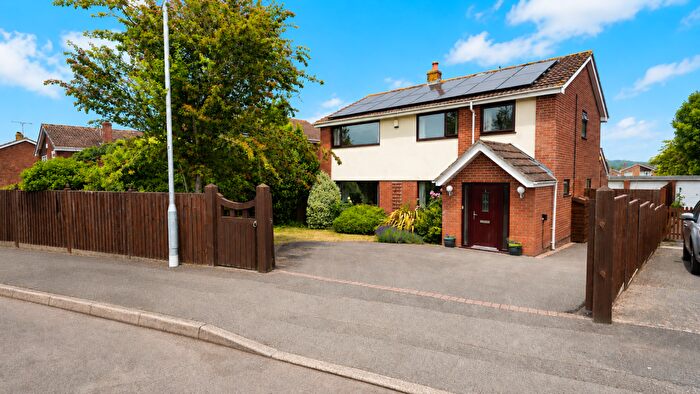
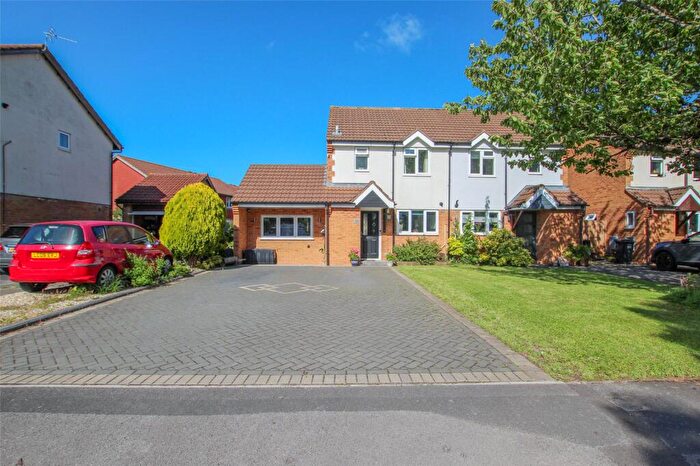
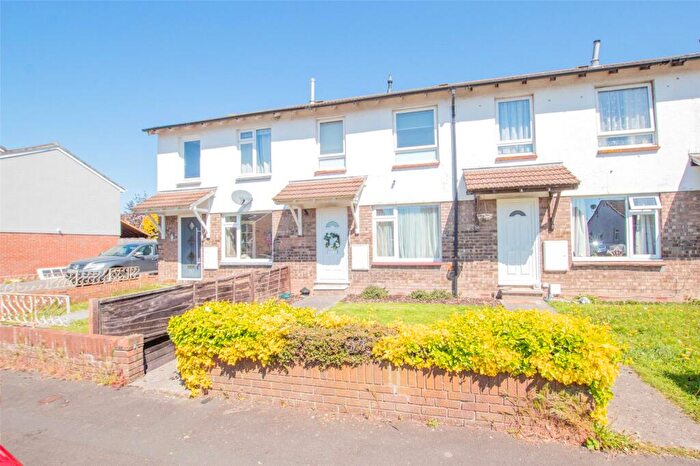
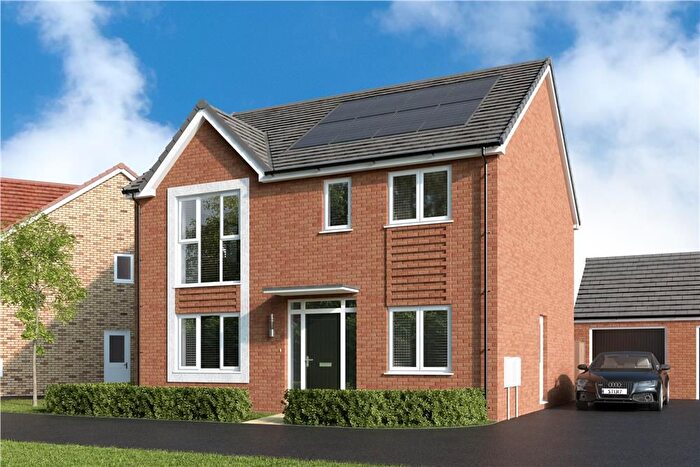
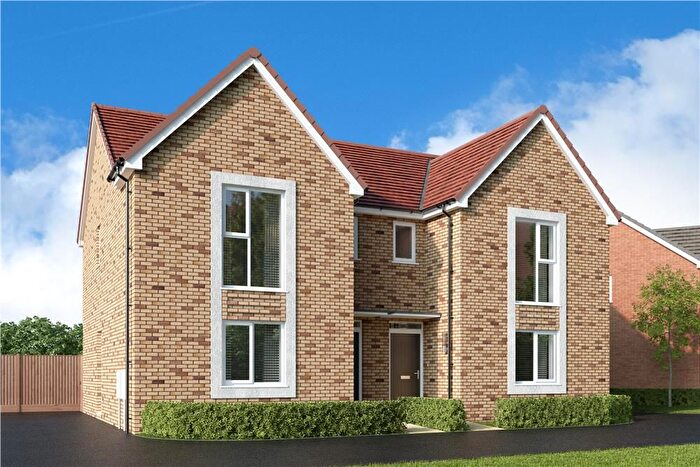
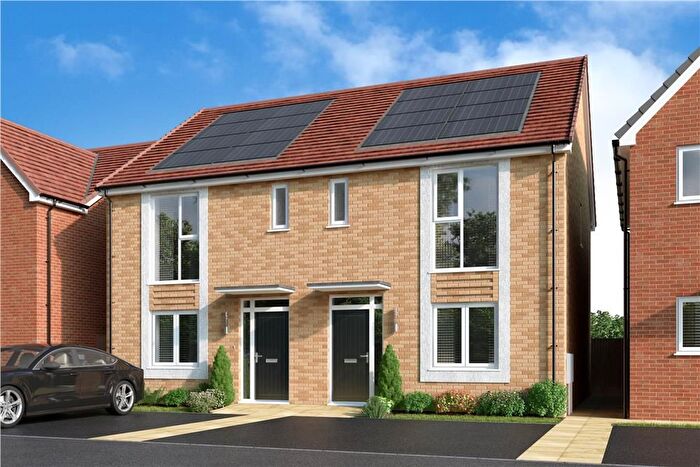
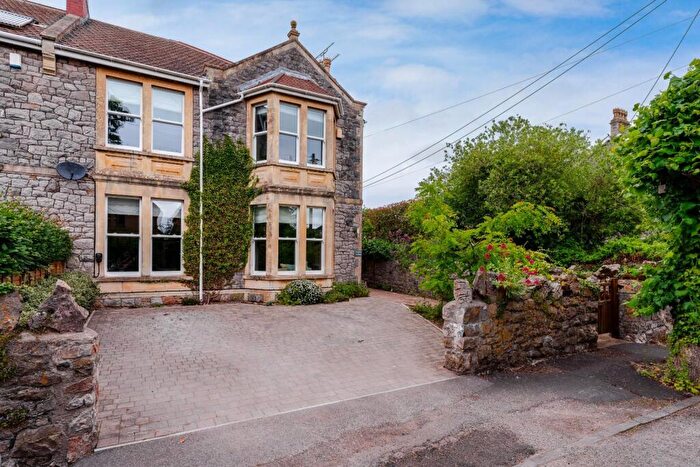
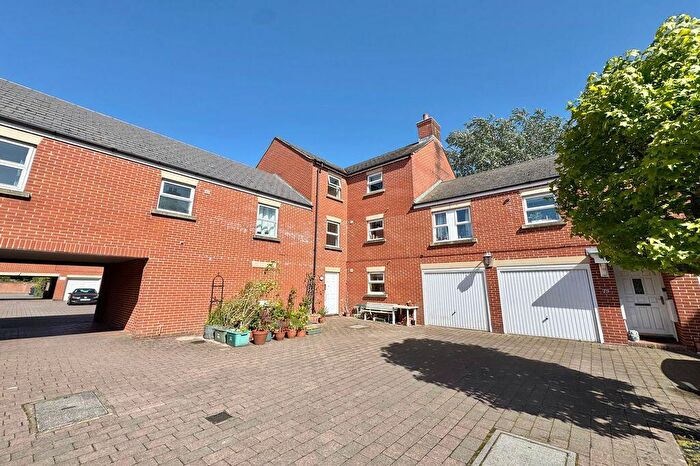
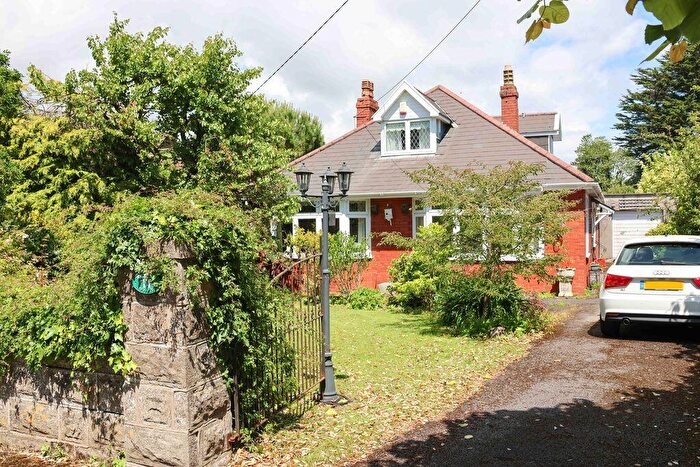
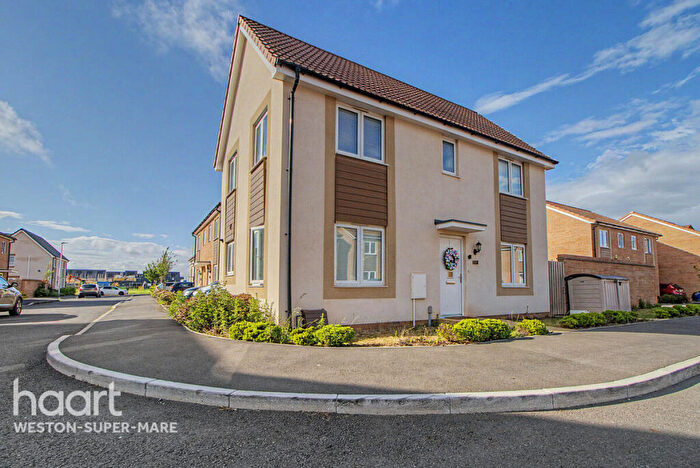
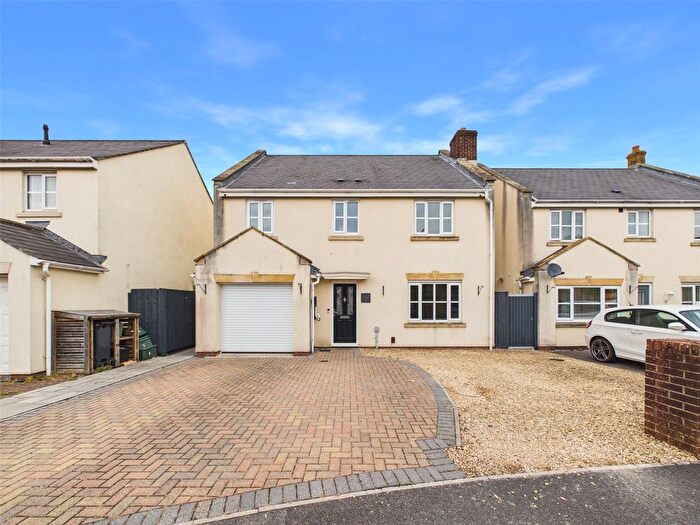
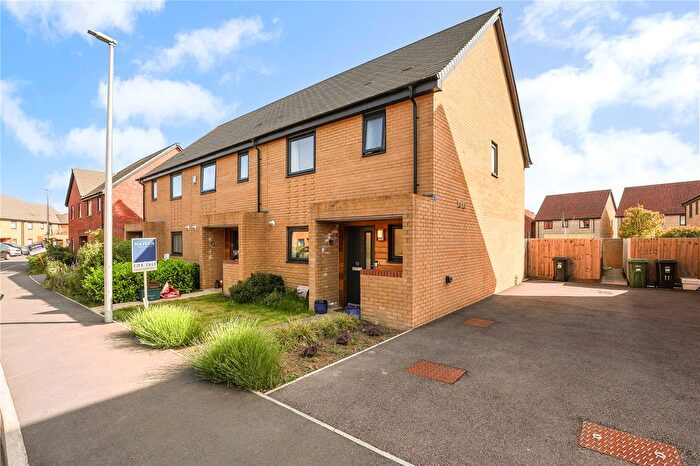
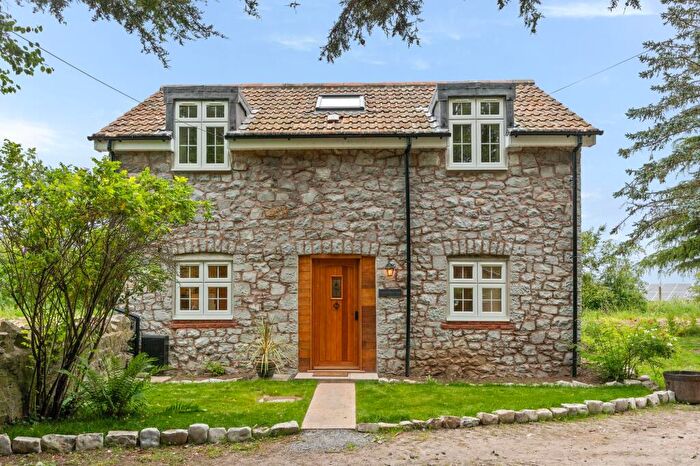
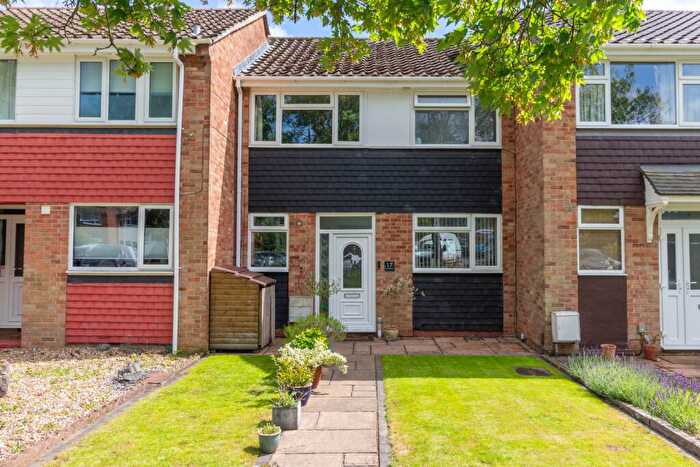
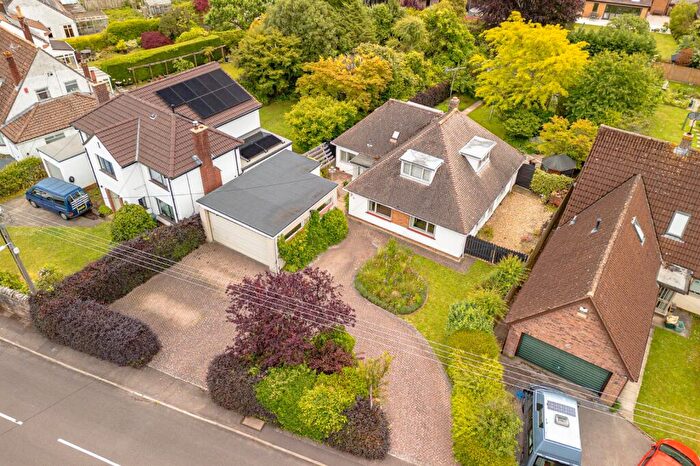
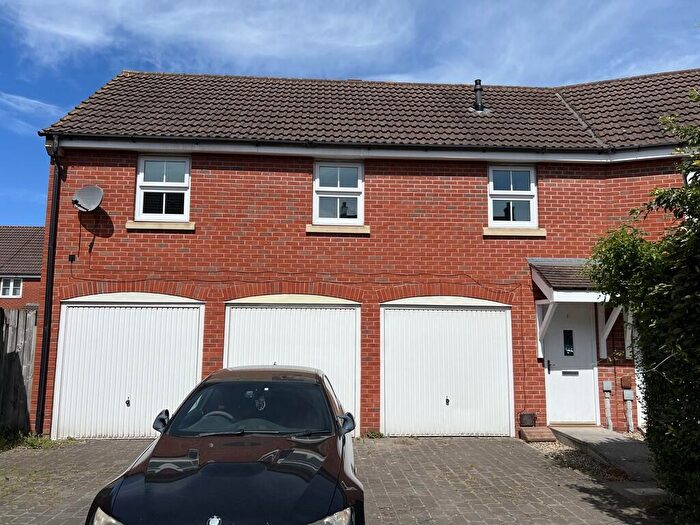
Properties for sale in North Somerset
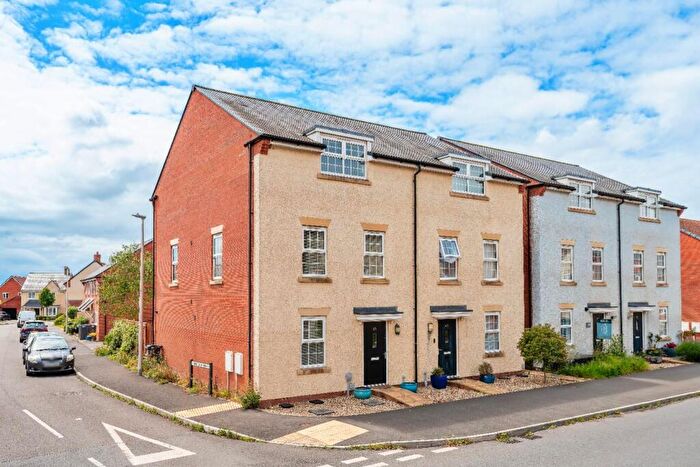
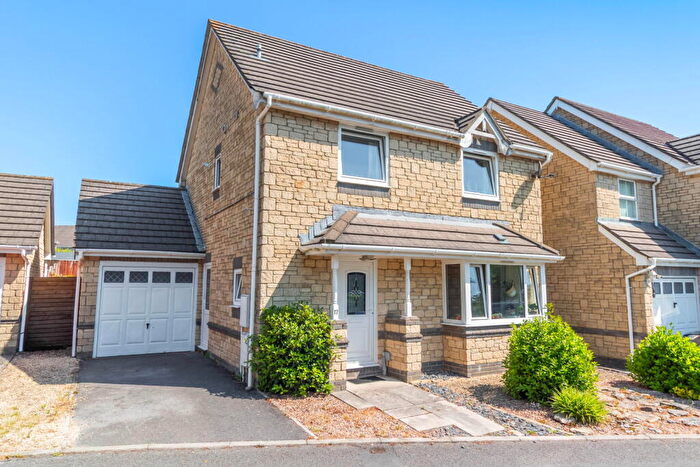
![]()
If you are looking to sell your house, let it out, or receive a property valuation, an expert can help you.
Click the button below to get started.
Towns in North Somerset
Navigate through our locations to find the location of your next house in North Somerset, England for sale or to rent.
Transport in North Somerset
Please see below transportation links in this area:

- FAQ
- Price Paid By Year
- Property Type Price
Frequently asked questions about North Somerset
What is the average price for a property for sale in North Somerset?
The average price for a property for sale in North Somerset is £358,023. This amount is 0.29% lower than the average price in England. There are more than 10,000 property listings for sale in North Somerset.
What locations have the most expensive properties for sale in North Somerset?
The locations with the most expensive properties for sale in North Somerset are Axbridge at an average of £476,666, Bristol at an average of £457,263 and Winscombe at an average of £446,600.
What locations have the most affordable properties for sale in North Somerset?
The locations with the most affordable properties for sale in North Somerset are Weston-super-mare at an average of £267,107, Banwell at an average of £355,563 and Clevedon at an average of £405,017.
Which train stations are available in or near North Somerset?
Some of the train stations available in or near North Somerset are Yatton, Worle and Nailsea and Backwell.
Property Price Paid in North Somerset by Year
The average sold property price by year was:
| Year | Average Sold Price | Price Change |
Sold Properties
|
|---|---|---|---|
| 2026 | £356,269 | 1% |
482 Properties |
| 2025 | £352,863 | -1% |
3,523 Properties |
| 2024 | £357,537 | -2% |
3,429 Properties |
| 2023 | £364,943 | 3% |
2,990 Properties |
| 2022 | £354,420 | 5% |
3,995 Properties |
| 2021 | £336,847 | 7% |
5,124 Properties |
| 2020 | £313,826 | 5% |
3,506 Properties |
| 2019 | £297,086 | 1% |
4,049 Properties |
| 2018 | £293,726 | 5% |
4,288 Properties |
| 2017 | £280,016 | 5% |
4,207 Properties |
| 2016 | £266,651 | 8% |
4,650 Properties |
| 2015 | £244,761 | 4% |
4,647 Properties |
| 2014 | £235,113 | 6% |
4,522 Properties |
| 2013 | £220,526 | 2% |
3,835 Properties |
| 2012 | £215,465 | 1% |
3,285 Properties |
| 2011 | £213,620 | -3% |
3,152 Properties |
| 2010 | £219,061 | 6% |
3,237 Properties |
| 2009 | £206,808 | -2% |
2,972 Properties |
| 2008 | £211,745 | -4% |
2,648 Properties |
| 2007 | £220,550 | 9% |
5,987 Properties |
| 2006 | £200,362 | 5% |
6,321 Properties |
| 2005 | £190,290 | 4% |
4,946 Properties |
| 2004 | £182,389 | 12% |
5,367 Properties |
| 2003 | £160,424 | 14% |
5,570 Properties |
| 2002 | £138,107 | 15% |
6,059 Properties |
| 2001 | £117,598 | 10% |
5,723 Properties |
| 2000 | £105,417 | 15% |
4,969 Properties |
| 1999 | £89,161 | 9% |
5,433 Properties |
| 1998 | £80,788 | 9% |
4,472 Properties |
| 1997 | £73,773 | 7% |
4,649 Properties |
| 1996 | £68,493 | 1% |
4,422 Properties |
| 1995 | £68,027 | - |
3,379 Properties |
Property Price per Property Type in North Somerset
Here you can find historic sold price data in order to help with your property search.
The average Property Paid Price for specific property types in the last three years are:
| Property Type | Average Sold Price | Sold Properties |
|---|---|---|
| Semi Detached House | £339,324.00 | 2,899 Semi Detached Houses |
| Terraced House | £287,205.00 | 2,194 Terraced Houses |
| Detached House | £532,827.00 | 3,121 Detached Houses |
| Flat | £205,996.00 | 2,210 Flats |