
Houses for sale & to rent in BS48 2UH, Woodford Close, Nailsea East, Bristol
House Prices in BS48 2UH, Woodford Close, Nailsea East
Properties in BS48 2UH have no sales history available within the last 3 years. BS48 2UH is a postcode in Woodford Close located in Nailsea East, an area in Bristol, North Somerset, with 8 households².
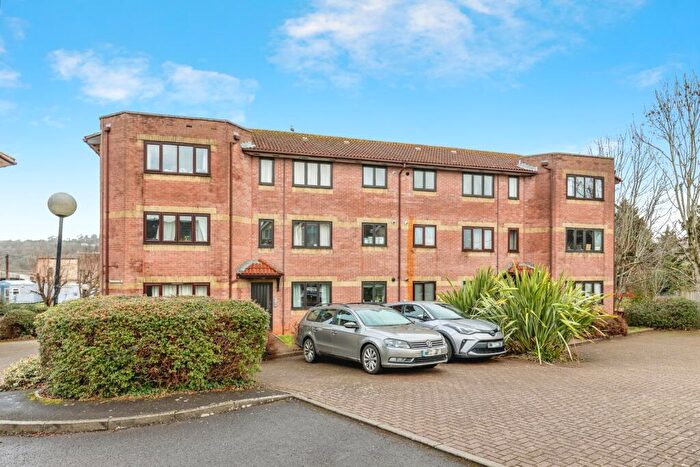
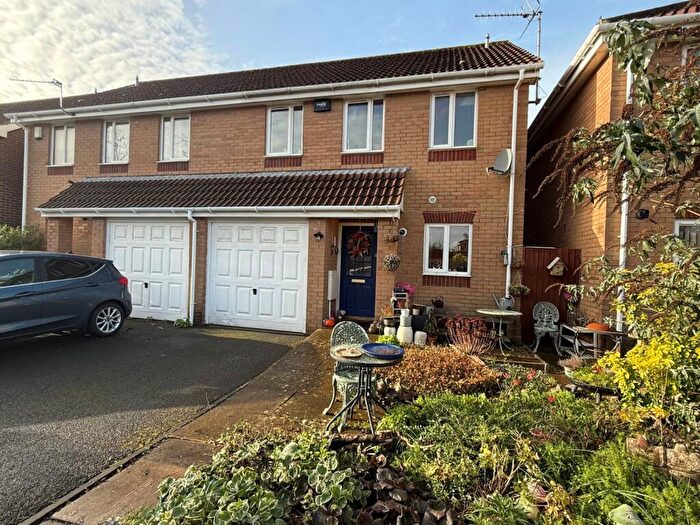
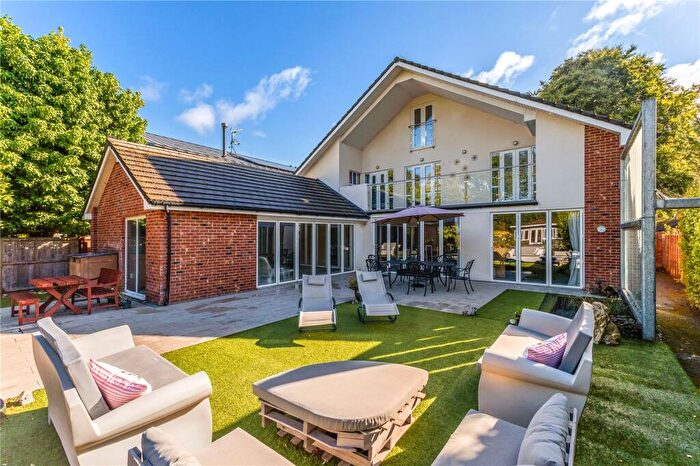
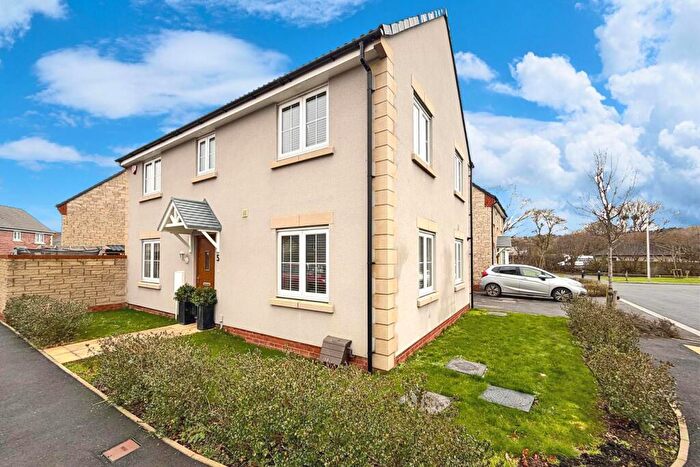
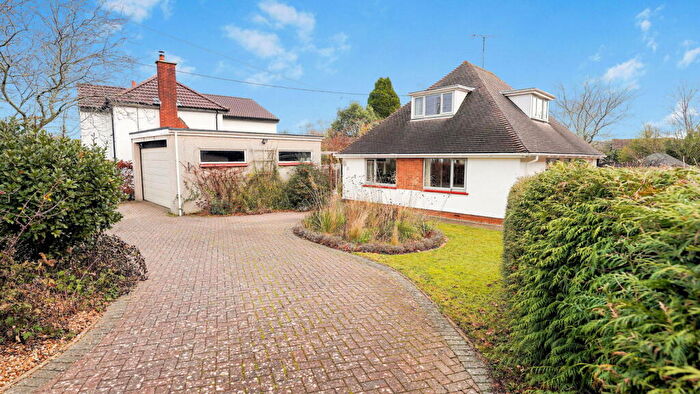
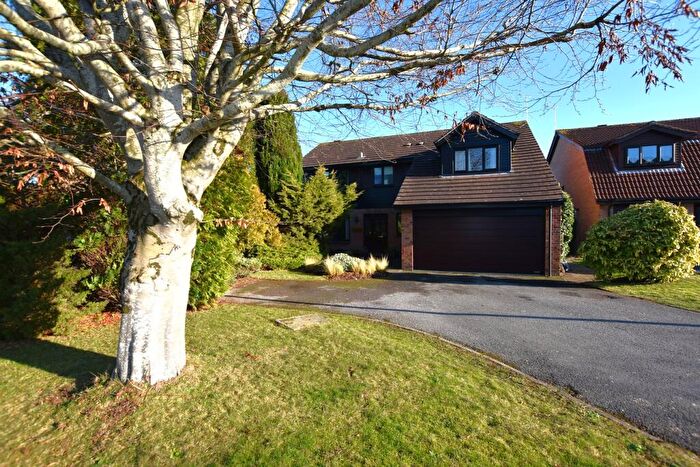
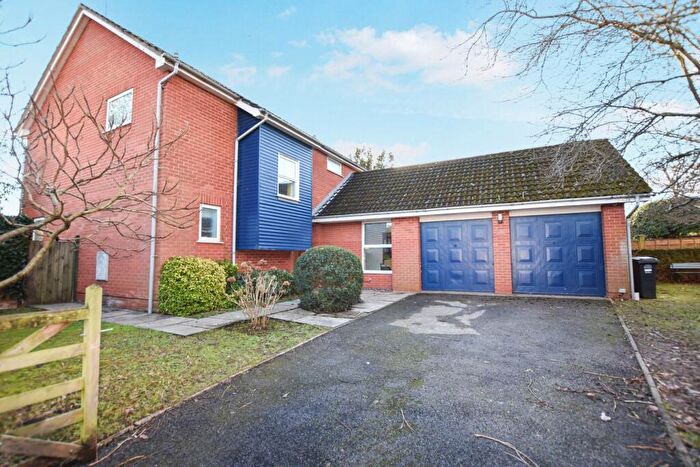
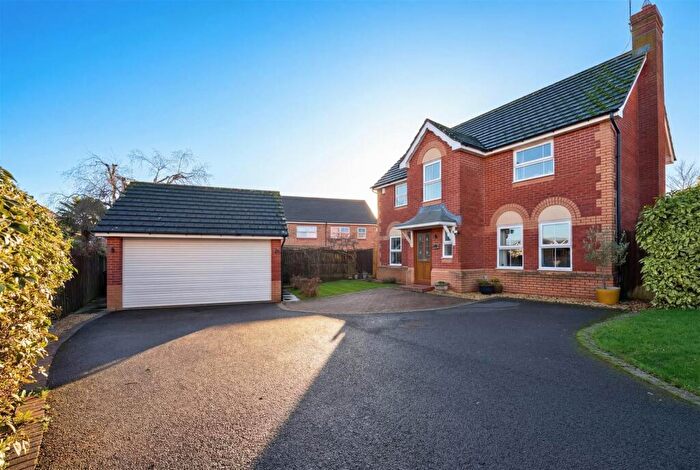
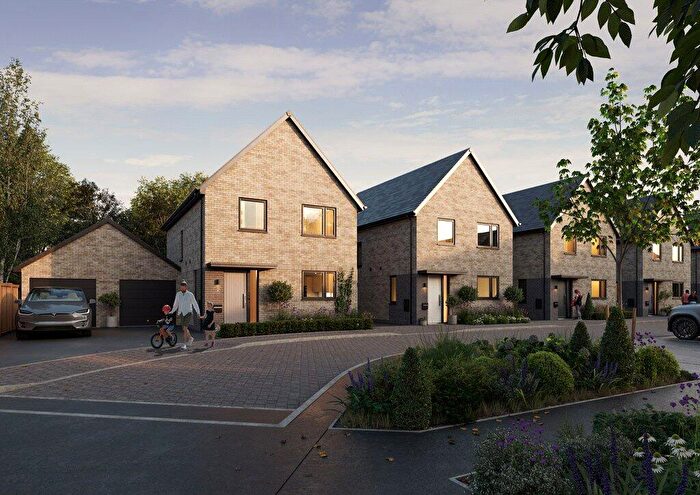
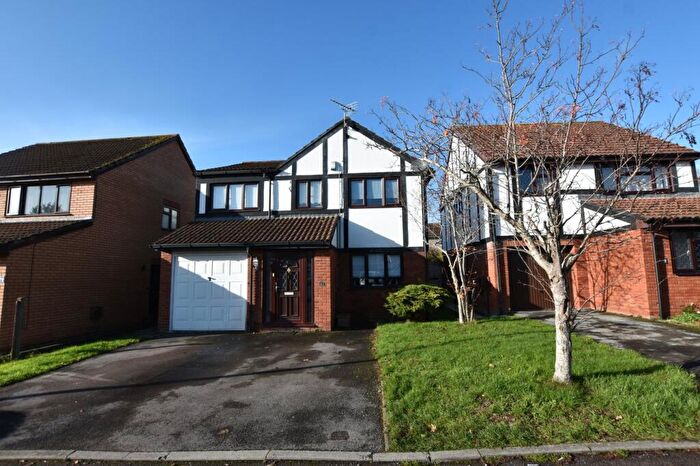
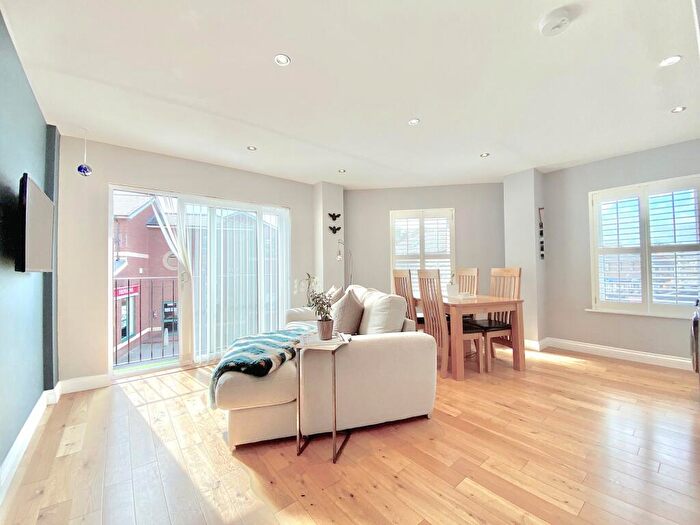
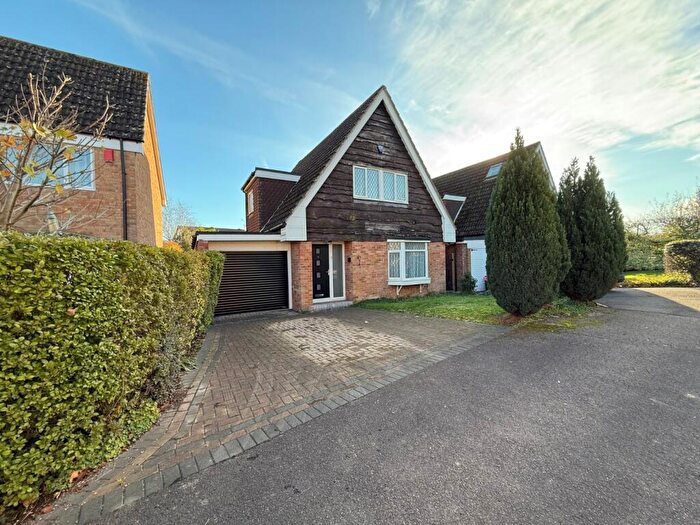
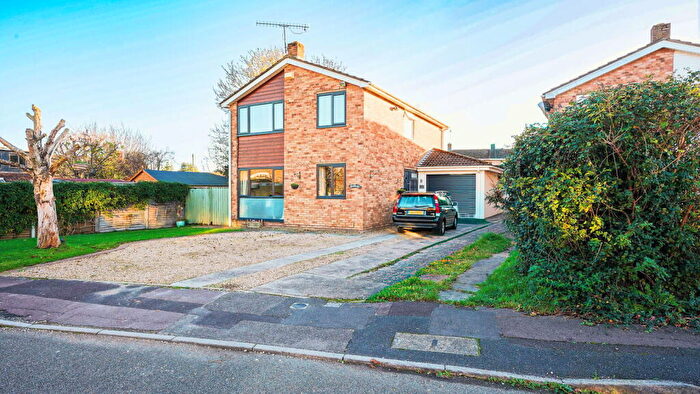
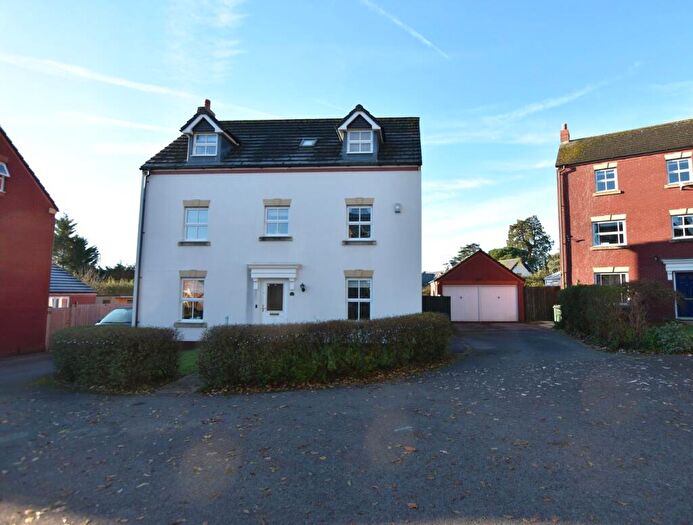
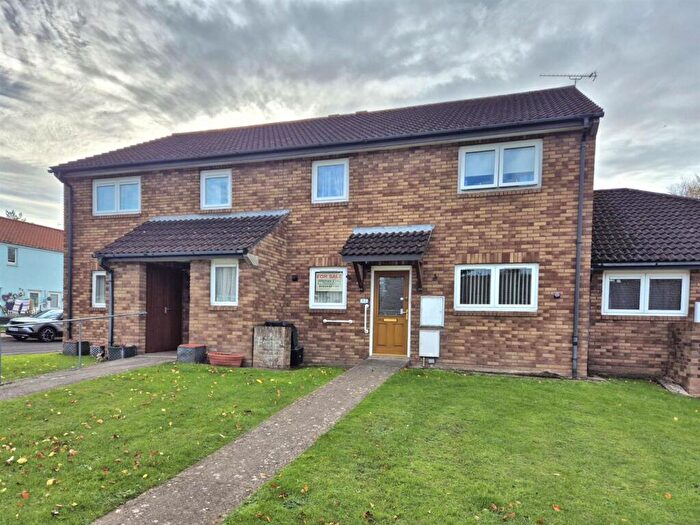
Properties for sale near BS48 2UH, Woodford Close
![]()
If you are looking to sell your house, let it out, or receive a property valuation, an expert can help you.
Click the button below to get started.
Price Paid in Woodford Close, BS48 2UH, Nailsea East
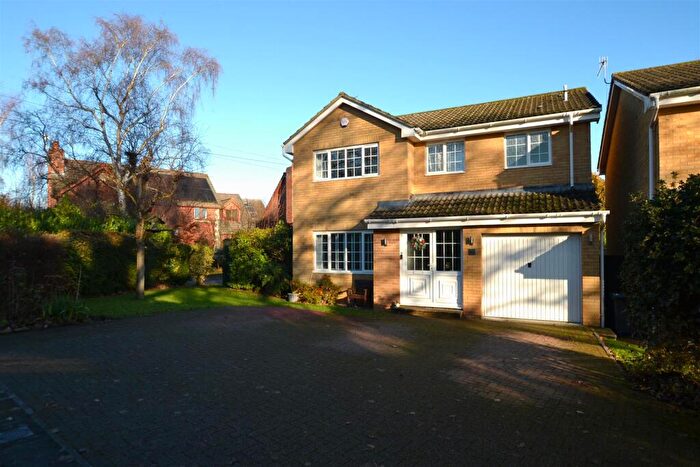
7 Woodford Close, BS48 2UH, Nailsea East Bristol
Property 7 has been sold 2 times. The last time it was sold was in 10/09/2019 and the sold price was £357,000.00.
This detached house, sold as a freehold on 10/09/2019, is a 80 sqm detached house with an EPC rating of D.
| Date | Price | Property Type | Tenure | Classification |
|---|---|---|---|---|
| 10/09/2019 | £357,000.00 | Detached House | freehold | Established Building |
| 21/09/2001 | £135,000.00 | Detached House | freehold | Established Building |
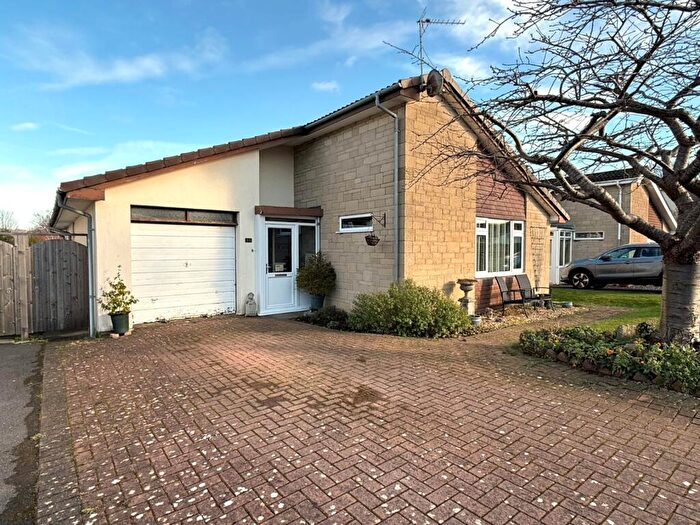
1 Woodford Close, BS48 2UH, Nailsea East Bristol
Property 1 has been sold 1 time. The last time it was sold was in 27/11/2009 and the sold price was £280,000.00.
This detached house, sold as a freehold on 27/11/2009, is a 119 sqm detached house with an EPC rating of E.
| Date | Price | Property Type | Tenure | Classification |
|---|---|---|---|---|
| 27/11/2009 | £280,000.00 | Detached House | freehold | Established Building |
4 Woodford Close, BS48 2UH, Nailsea East Bristol
Property 4 has been sold 1 time. The last time it was sold was in 31/10/2006 and the sold price was £280,000.00.
This is a Detached House which was sold as a freehold in 31/10/2006
| Date | Price | Property Type | Tenure | Classification |
|---|---|---|---|---|
| 31/10/2006 | £280,000.00 | Detached House | freehold | Established Building |
Transport near BS48 2UH, Woodford Close

House price paid reports for BS48 2UH, Woodford Close
Click on the buttons below to see price paid reports by year or property price:
- Price Paid By Year
Property Price Paid in BS48 2UH, Woodford Close by Year
The average sold property price by year was:
| Year | Average Sold Price | Price Change |
Sold Properties
|
|---|---|---|---|
| 2019 | £357,000 | 22% |
1 Property |
| 2009 | £280,000 | - |
1 Property |
| 2006 | £280,000 | 52% |
1 Property |
| 2001 | £135,000 | - |
1 Property |