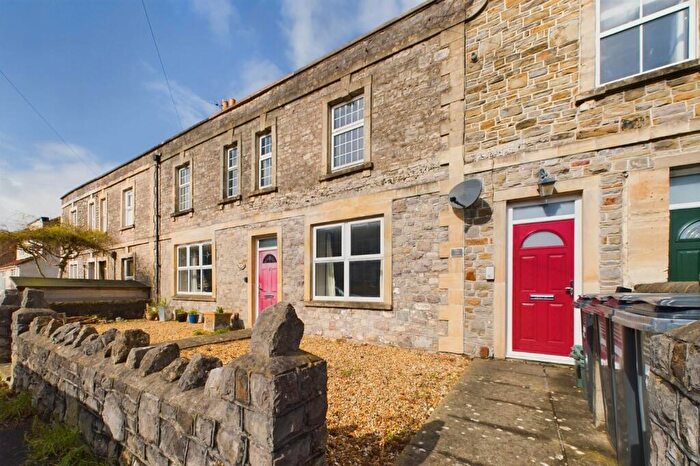
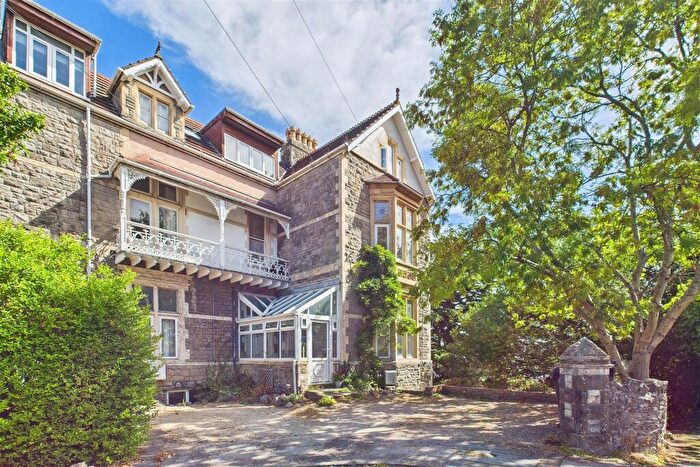
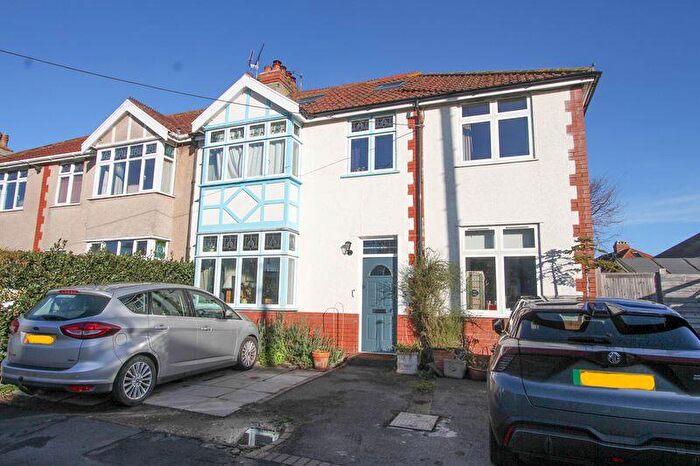
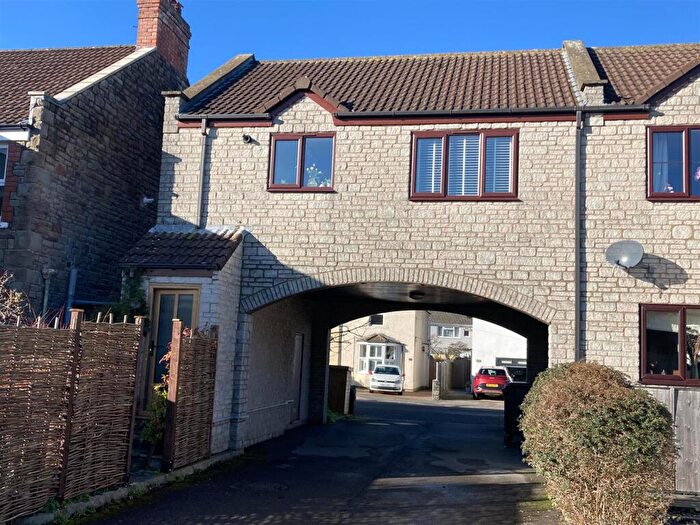
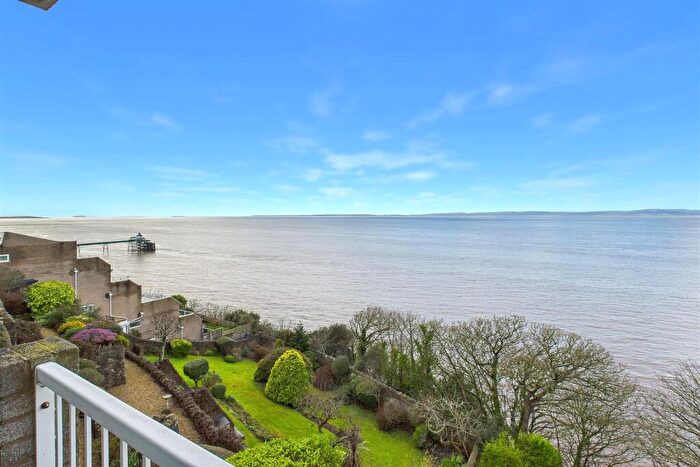
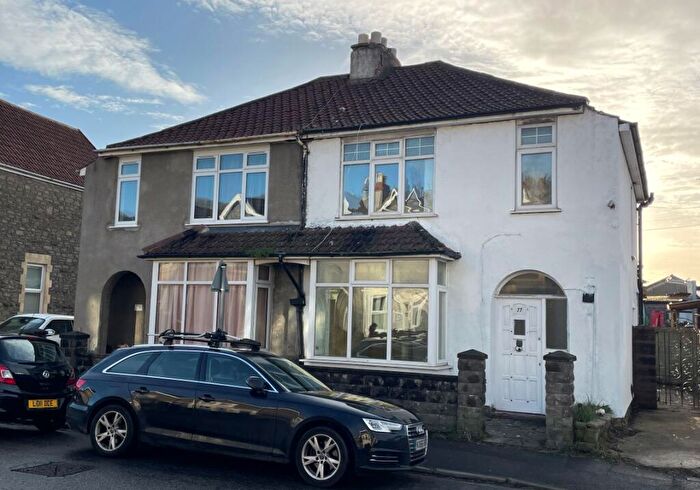
Houses for sale & to rent in Clevedon Central, Clevedon
House Prices in Clevedon Central
Properties in Clevedon Central have an average house price of £330,204.00 and had 128 Property Transactions within the last 3 years¹.
Clevedon Central is an area in Clevedon, North Somerset with 1,356 households², where the most expensive property was sold for £850,000.00.
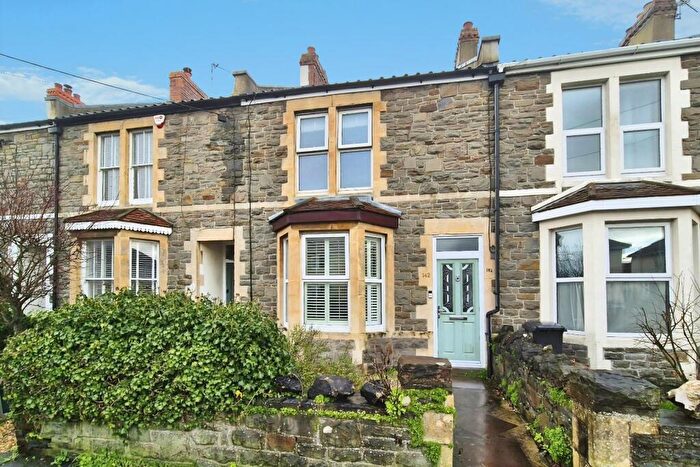
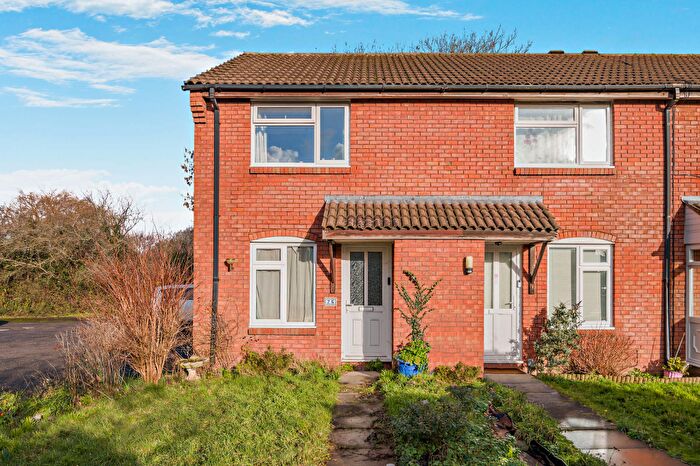
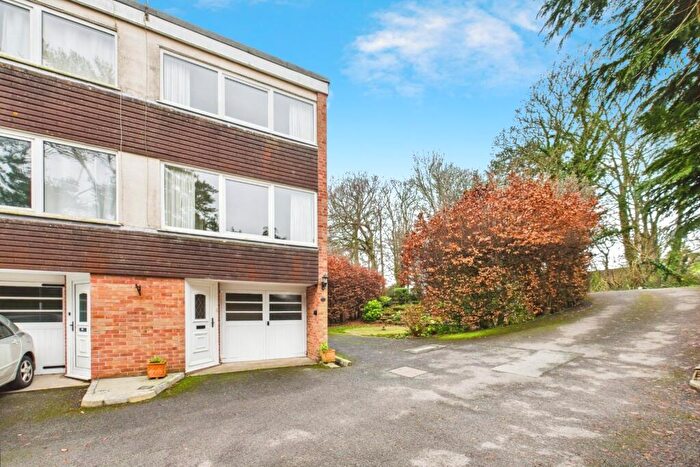
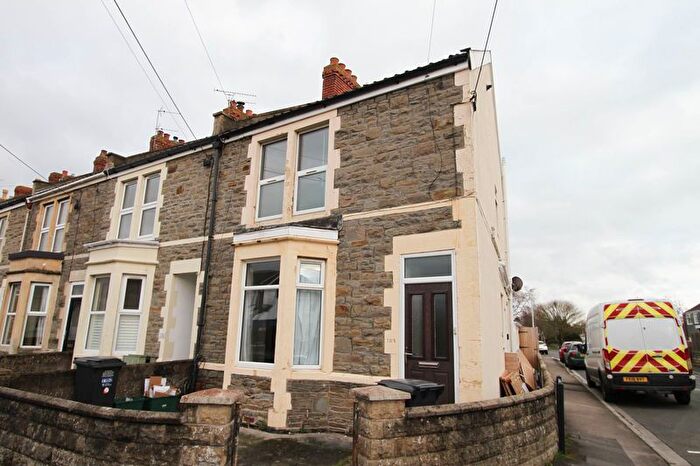
Properties for sale in Clevedon Central
Roads and Postcodes in Clevedon Central
Navigate through our locations to find the location of your next house in Clevedon Central, Clevedon for sale or to rent.
| Streets | Postcodes |
|---|---|
| Central Way | BS21 6SY |
| Chapel Hill | BS21 7NH BS21 7NJ BS21 7NL |
| Churchill Avenue | BS21 6NU BS21 6NX BS21 6PP BS21 6QN BS21 6QR BS21 6QW |
| Churchill Close | BS21 6PW |
| Coleridge Road | BS21 7TB |
| Coleridge Vale Road East | BS21 6NS |
| Coleridge Vale Road North | BS21 6FL BS21 6NR BS21 6PN BS21 6PR BS21 6PS |
| Coleridge Vale Road South | BS21 6PB BS21 6PD BS21 6PE BS21 6PG BS21 6PJ |
| Coleridge Vale Road West | BS21 6PA BS21 6PF |
| Fearnville Estate | BS21 6PX |
| Glebe Road | BS21 6QD |
| Griffin Road | BS21 6HH BS21 6HJ |
| Hill Moor | BS21 6UG |
| Hillside Road | BS21 7XJ |
| Jesmond Road | BS21 7PA BS21 7RZ BS21 7SA |
| Kenn Road | BS21 6EP BS21 6EW BS21 6EX BS21 6EY BS21 6HE BS21 6JA |
| Kingsley Road | BS21 6NT |
| Lower Linden Road | BS21 7FT |
| Lower Queens Road | BS21 6LX |
| Madeira Road | BS21 7TJ |
| Mantle Close | BS21 6FH |
| Marson Road | BS21 7NN |
| Melbourne Terrace | BS21 6HQ |
| Moor Lane | BS21 6ER BS21 6ES BS21 6EU |
| Moor Park | BS21 6EH BS21 6EJ BS21 6EQ BS21 6TA |
| Moorside Villas | BS21 6ET |
| Old Church Road | BS21 6LU BS21 6LY BS21 6NA BS21 6NN BS21 6NP BS21 6PT BS21 6PU |
| Oldville Avenue | BS21 6HF BS21 6HG |
| Queens Road | BS21 7TF BS21 7TH |
| Shelley Avenue | BS21 6EZ BS21 6HD |
| Southey Road | BS21 6NY |
| St Johns Avenue | BS21 7TQ |
| St Johns Road | BS21 7TG |
| Station Road | BS21 6NH |
| Strode Road | BS21 6FP BS21 6QA BS21 6QL |
| Sunnyside Road | BS21 7TA BS21 7TL |
| The Triangle | BS21 6NB BS21 6NQ |
| Victoria Road | BS21 7RU BS21 7RY |
| Wordsworth Road | BS21 6PL BS21 6PQ |
| Yeo Moor | BS21 6UF BS21 6UQ |
Transport near Clevedon Central
-
Yatton Station
-
Nailsea and Backwell Station
-
Worle Station
-
Weston Milton Station
-
Weston-Super-Mare Station
-
Avonmouth Station
-
Shirehampton Station
-
St.Andrew's Road Station
-
Sea Mills Station
- FAQ
- Price Paid By Year
- Property Type Price
Frequently asked questions about Clevedon Central
What is the average price for a property for sale in Clevedon Central?
The average price for a property for sale in Clevedon Central is £330,204. This amount is 18% lower than the average price in Clevedon. There are 2,222 property listings for sale in Clevedon Central.
What streets have the most expensive properties for sale in Clevedon Central?
The streets with the most expensive properties for sale in Clevedon Central are St Johns Avenue at an average of £689,000, Madeira Road at an average of £618,875 and Fearnville Estate at an average of £523,800.
What streets have the most affordable properties for sale in Clevedon Central?
The streets with the most affordable properties for sale in Clevedon Central are St Johns Road at an average of £195,000, Chapel Hill at an average of £205,000 and Central Way at an average of £207,890.
Which train stations are available in or near Clevedon Central?
Some of the train stations available in or near Clevedon Central are Yatton, Nailsea and Backwell and Worle.
Property Price Paid in Clevedon Central by Year
The average sold property price by year was:
| Year | Average Sold Price | Price Change |
Sold Properties
|
|---|---|---|---|
| 2025 | £333,035 | -3% |
35 Properties |
| 2024 | £341,698 | 6% |
40 Properties |
| 2023 | £319,660 | -8% |
53 Properties |
| 2022 | £345,380 | 6% |
73 Properties |
| 2021 | £326,233 | 8% |
102 Properties |
| 2020 | £299,725 | 11% |
61 Properties |
| 2019 | £267,125 | 3% |
47 Properties |
| 2018 | £258,943 | -11% |
84 Properties |
| 2017 | £288,606 | 14% |
59 Properties |
| 2016 | £247,202 | 20% |
64 Properties |
| 2015 | £198,965 | -16% |
91 Properties |
| 2014 | £229,920 | 11% |
72 Properties |
| 2013 | £204,926 | 1% |
66 Properties |
| 2012 | £202,819 | 2% |
63 Properties |
| 2011 | £198,462 | -4% |
48 Properties |
| 2010 | £207,260 | 17% |
58 Properties |
| 2009 | £172,996 | -4% |
64 Properties |
| 2008 | £180,081 | -14% |
27 Properties |
| 2007 | £205,983 | 15% |
73 Properties |
| 2006 | £175,295 | -7% |
103 Properties |
| 2005 | £186,863 | 16% |
69 Properties |
| 2004 | £157,616 | 14% |
74 Properties |
| 2003 | £135,687 | 4% |
50 Properties |
| 2002 | £130,577 | 21% |
83 Properties |
| 2001 | £102,574 | 5% |
75 Properties |
| 2000 | £97,198 | 19% |
67 Properties |
| 1999 | £78,662 | -6% |
66 Properties |
| 1998 | £83,579 | 13% |
61 Properties |
| 1997 | £72,626 | 23% |
58 Properties |
| 1996 | £55,637 | -7% |
65 Properties |
| 1995 | £59,739 | - |
48 Properties |
Property Price per Property Type in Clevedon Central
Here you can find historic sold price data in order to help with your property search.
The average Property Paid Price for specific property types in the last three years are:
| Property Type | Average Sold Price | Sold Properties |
|---|---|---|
| Semi Detached House | £424,421.00 | 44 Semi Detached Houses |
| Detached House | £435,895.00 | 10 Detached Houses |
| Terraced House | £287,012.00 | 34 Terraced Houses |
| Flat | £236,857.00 | 40 Flats |

