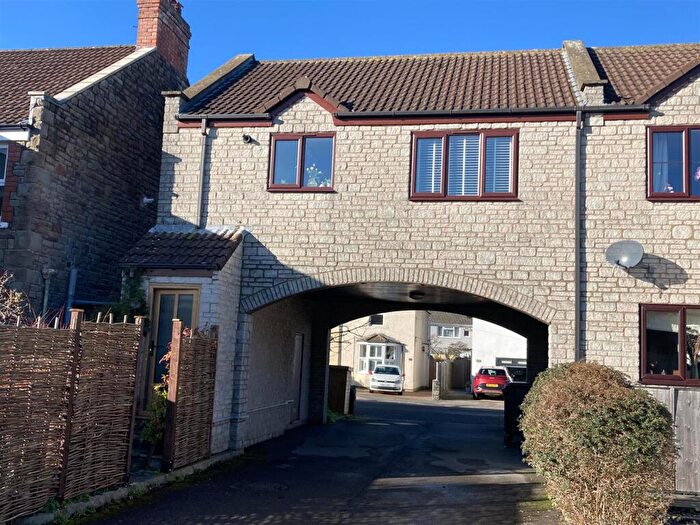
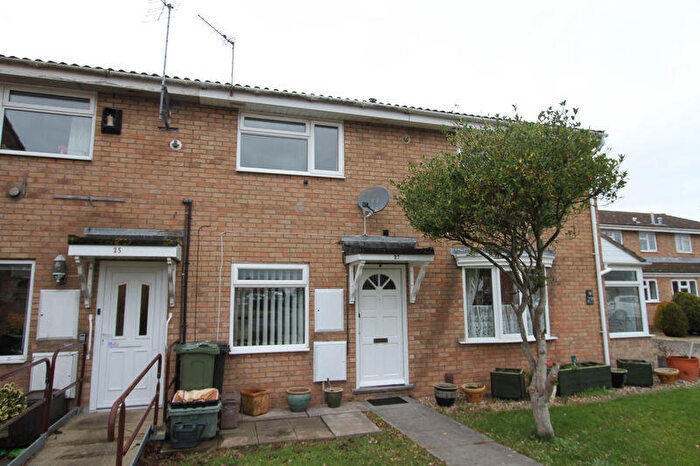
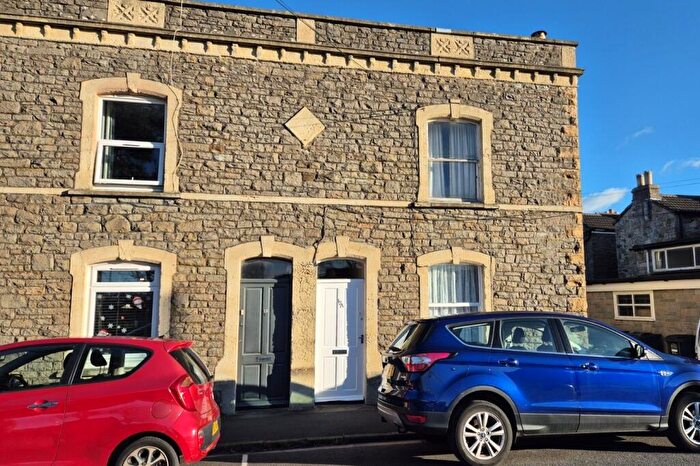
Houses for sale & to rent in Clevedon South, Clevedon
House Prices in Clevedon South
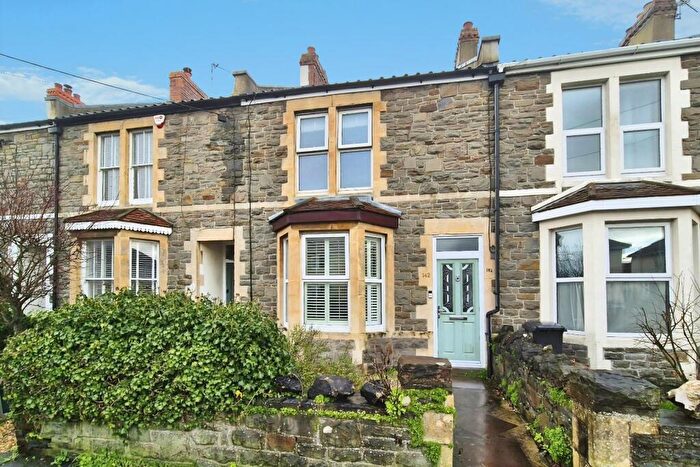
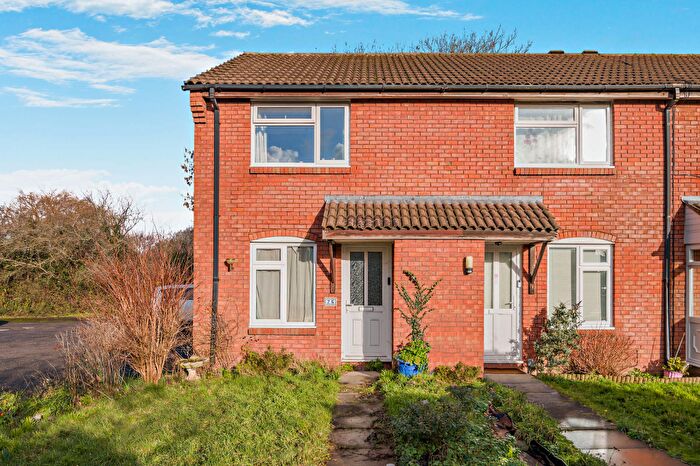
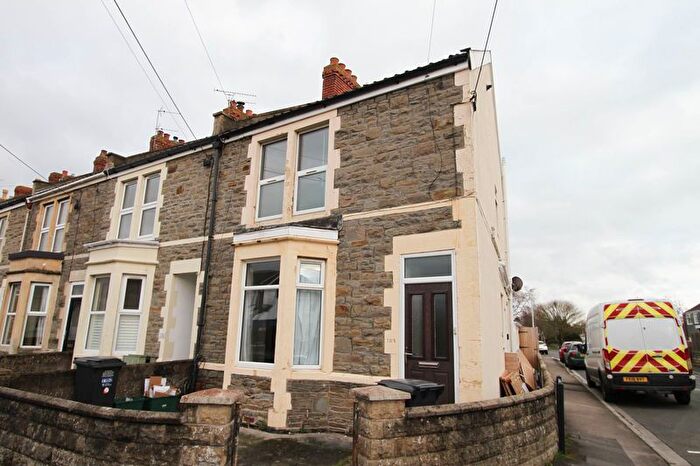
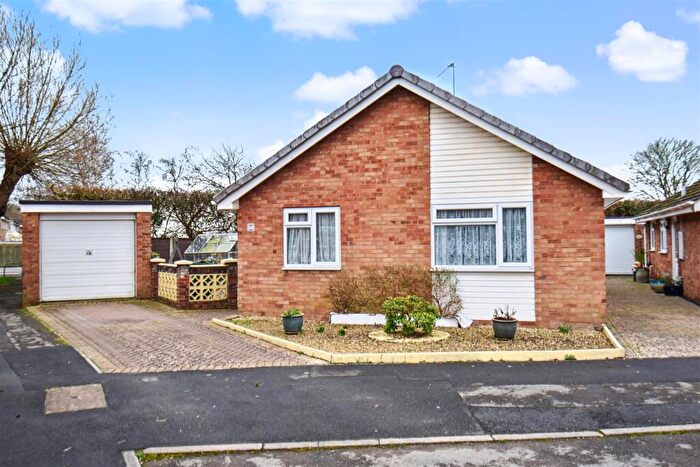
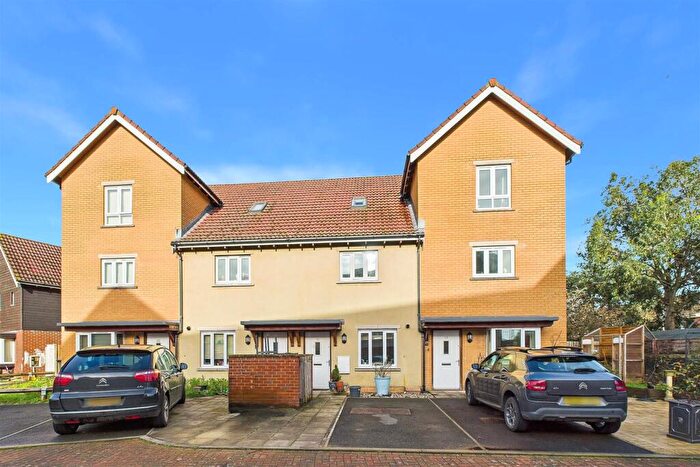
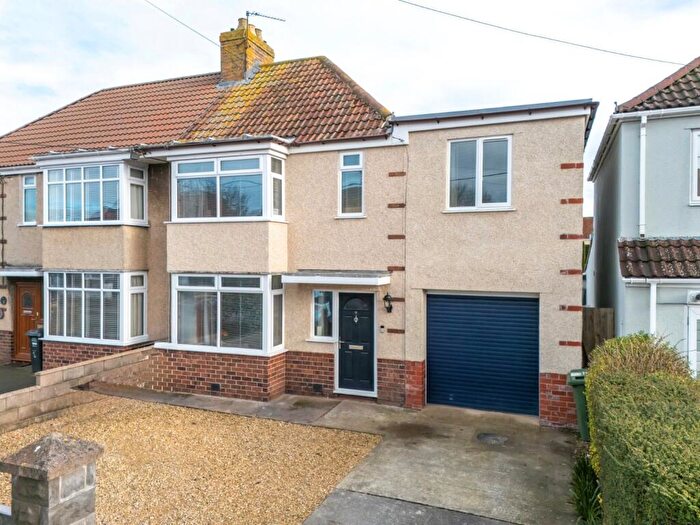
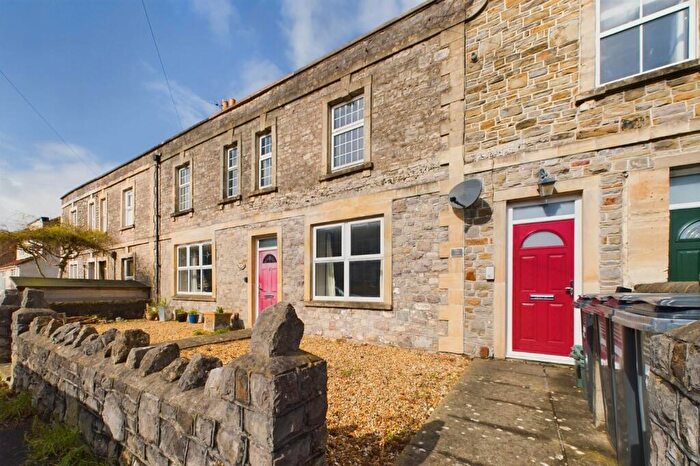
Properties in Clevedon South have an average house price of £301,537.00 and had 133 Property Transactions within the last 3 years¹.
Clevedon South is an area in Clevedon, North Somerset with 1,417 households², where the most expensive property was sold for £550,000.00.
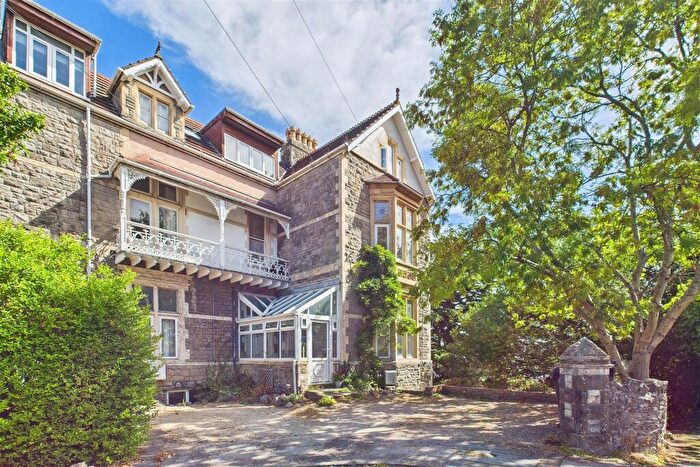
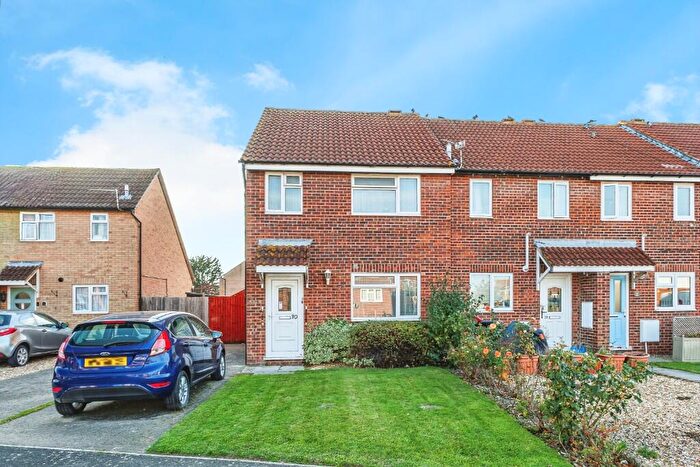
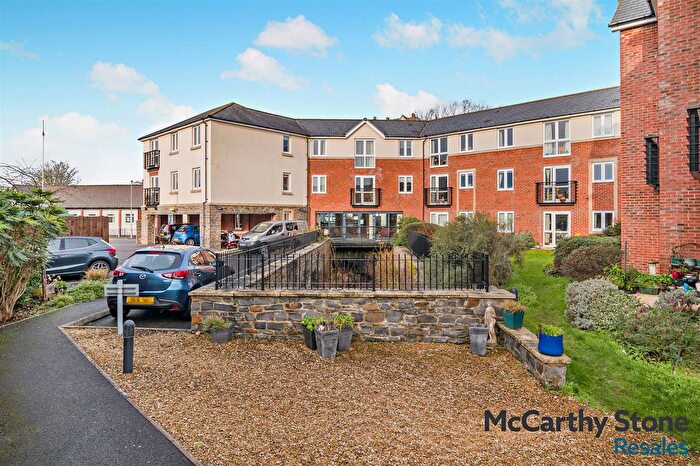
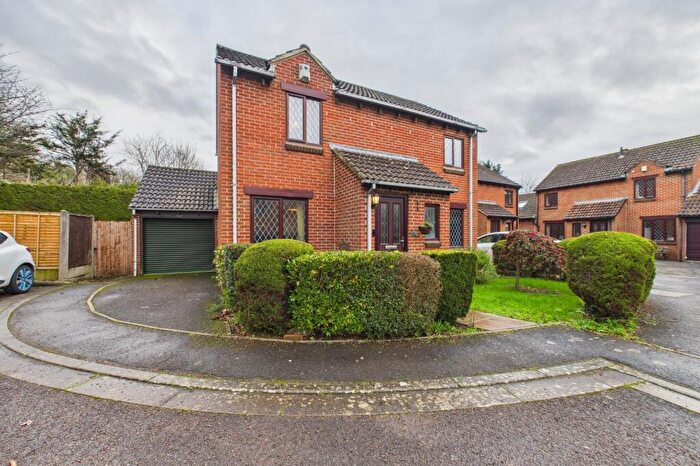
Properties for sale in Clevedon South
Roads and Postcodes in Clevedon South
Navigate through our locations to find the location of your next house in Clevedon South, Clevedon for sale or to rent.
| Streets | Postcodes |
|---|---|
| Banks Close | BS21 5DF |
| Bay Tree Road | BS21 6JP |
| Carice Gardens | BS21 5DG BS21 5DH |
| Chard Road | BS21 6LW |
| Claremont Gardens | BS21 5BE BS21 5BG BS21 5BH BS21 5BJ BS21 5BQ |
| Corner Croft | BS21 5DA BS21 5DB |
| Coxway | BS21 5AD BS21 5AQ |
| Dart Road | BS21 6LS |
| Elgar Close | BS21 5BS |
| Elmtree Road | BS21 6JX |
| Gullifords Bank | BS21 5DP |
| Halswell Road | BS21 6LD BS21 6LE |
| Hazell Close | BS21 5AS BS21 5DW |
| Hillview Avenue | BS21 6JH |
| Homeground | BS21 5AL |
| Honiton Road | BS21 6LR |
| Hurn Road | BS21 5AF BS21 5AG |
| Ilminster Close | BS21 6JS |
| Kenn Moor Drive | BS21 5AB BS21 5AJ BS21 5AP BS21 5AR BS21 5AX BS21 5AY BS21 5BB |
| Kenn Road | BS21 6JE BS21 6JY BS21 6JZ BS21 6LB BS21 6LF BS21 6LH BS21 6GA |
| Kennaway Road | BS21 6JJ BS21 6JL |
| Moor Park Court | BS21 6FU |
| Newlands Green | BS21 5BU BS21 5BX |
| Oldfield | BS21 5DQ |
| Orchard Road | BS21 6JT |
| Otter Road | BS21 6LQ |
| Plumers Close | BS21 5AW |
| Porlock Close | BS21 6JN |
| Sercombe Park | BS21 5AZ BS21 5BA BS21 5BD |
| Somerton Road | BS21 6JR BS21 6JW |
| Staples Close | BS21 5BL BS21 5BN BS21 5BP BS21 5BW |
| Stonebridge | BS21 5BY BS21 5BZ |
| The Chaffins | BS21 5AH |
| The Paddock | BS21 6JU |
| The Penns | BS21 5AN |
| Tiverton Road | BS21 6LP |
| Tone Road | BS21 6LG |
| Treefield Road | BS21 6JB BS21 6JD |
| Tutton Way | BS21 5BT BS21 5DE |
| Wells Road | BS21 6LA |
| Westfield | BS21 5DD |
| Wrangle Farm Green | BS21 5DR |
| Yeoward Road | BS21 5AT BS21 5AU |
Transport near Clevedon South
-
Yatton Station
-
Nailsea and Backwell Station
-
Worle Station
-
Weston Milton Station
-
Weston-Super-Mare Station
-
Avonmouth Station
-
Shirehampton Station
-
St.Andrew's Road Station
-
Sea Mills Station
- FAQ
- Price Paid By Year
- Property Type Price
Frequently asked questions about Clevedon South
What is the average price for a property for sale in Clevedon South?
The average price for a property for sale in Clevedon South is £301,537. This amount is 25% lower than the average price in Clevedon. There are 1,564 property listings for sale in Clevedon South.
What streets have the most expensive properties for sale in Clevedon South?
The streets with the most expensive properties for sale in Clevedon South are Westfield at an average of £550,000, Banks Close at an average of £495,000 and The Paddock at an average of £450,000.
What streets have the most affordable properties for sale in Clevedon South?
The streets with the most affordable properties for sale in Clevedon South are Oldfield at an average of £137,500, Carice Gardens at an average of £159,880 and Corner Croft at an average of £172,743.
Which train stations are available in or near Clevedon South?
Some of the train stations available in or near Clevedon South are Yatton, Nailsea and Backwell and Worle.
Property Price Paid in Clevedon South by Year
The average sold property price by year was:
| Year | Average Sold Price | Price Change |
Sold Properties
|
|---|---|---|---|
| 2025 | £306,060 | 5% |
47 Properties |
| 2024 | £290,235 | -7% |
49 Properties |
| 2023 | £310,759 | 3% |
37 Properties |
| 2022 | £301,243 | 8% |
69 Properties |
| 2021 | £277,894 | -6% |
68 Properties |
| 2020 | £293,760 | 16% |
40 Properties |
| 2019 | £247,032 | -6% |
48 Properties |
| 2018 | £261,041 | 16% |
58 Properties |
| 2017 | £219,960 | -1% |
54 Properties |
| 2016 | £222,041 | 15% |
59 Properties |
| 2015 | £188,332 | -3% |
78 Properties |
| 2014 | £193,090 | 12% |
79 Properties |
| 2013 | £168,980 | 7% |
58 Properties |
| 2012 | £156,980 | -7% |
47 Properties |
| 2011 | £167,522 | -0,1% |
46 Properties |
| 2010 | £167,638 | 6% |
57 Properties |
| 2009 | £156,985 | -3% |
41 Properties |
| 2008 | £161,210 | -12% |
35 Properties |
| 2007 | £181,171 | 14% |
97 Properties |
| 2006 | £155,929 | 6% |
109 Properties |
| 2005 | £146,938 | 2% |
91 Properties |
| 2004 | £143,291 | 20% |
93 Properties |
| 2003 | £115,110 | 11% |
98 Properties |
| 2002 | £102,208 | 26% |
115 Properties |
| 2001 | £75,449 | 12% |
115 Properties |
| 2000 | £66,110 | 3% |
99 Properties |
| 1999 | £64,087 | 3% |
116 Properties |
| 1998 | £62,388 | 19% |
117 Properties |
| 1997 | £50,815 | 3% |
103 Properties |
| 1996 | £49,491 | -3% |
95 Properties |
| 1995 | £50,779 | - |
63 Properties |
Property Price per Property Type in Clevedon South
Here you can find historic sold price data in order to help with your property search.
The average Property Paid Price for specific property types in the last three years are:
| Property Type | Average Sold Price | Sold Properties |
|---|---|---|
| Semi Detached House | £354,356.00 | 45 Semi Detached Houses |
| Detached House | £375,060.00 | 14 Detached Houses |
| Terraced House | £288,281.00 | 61 Terraced Houses |
| Flat | £101,723.00 | 13 Flats |

