
Houses for sale in Camperdown, Cramlington
House Prices in Camperdown
Properties in Camperdown have an average house price of £142k and had 154 Property Transactions within the last 3 years¹.
Camperdown is an area in Cramlington, North Tyneside with 2,093 households², where the most expensive property was sold for £385k.
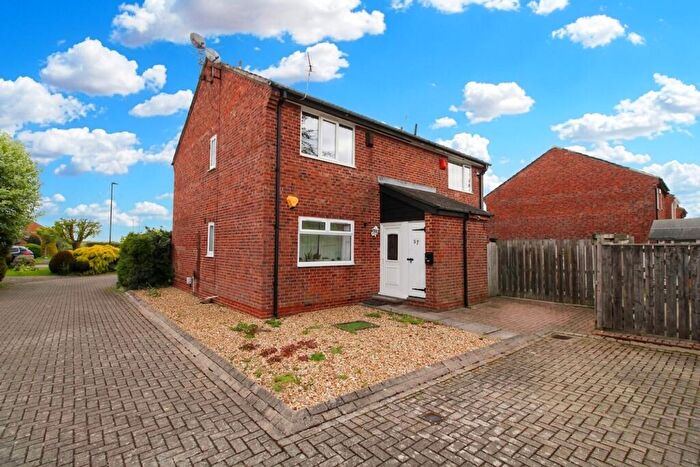
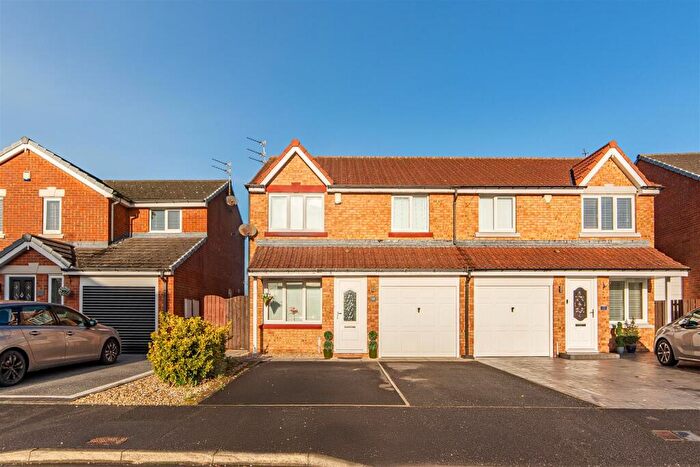
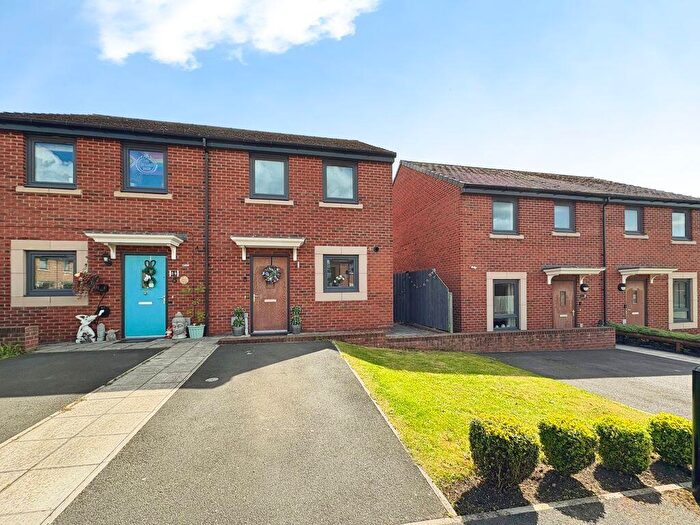
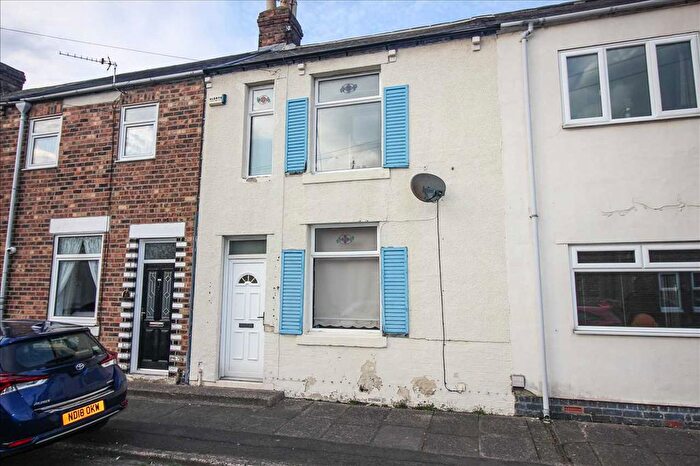
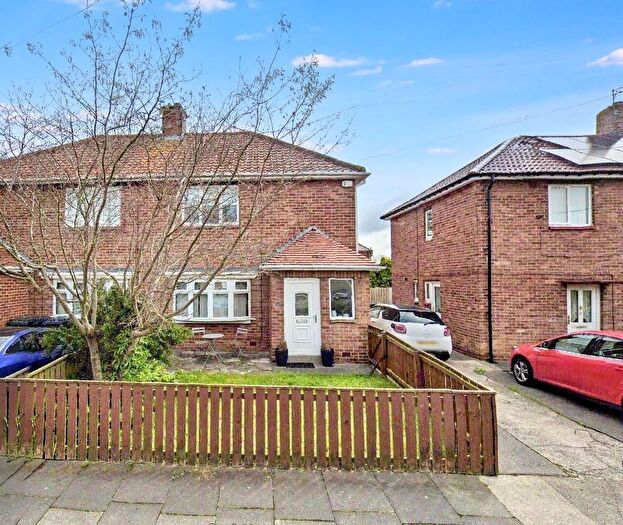
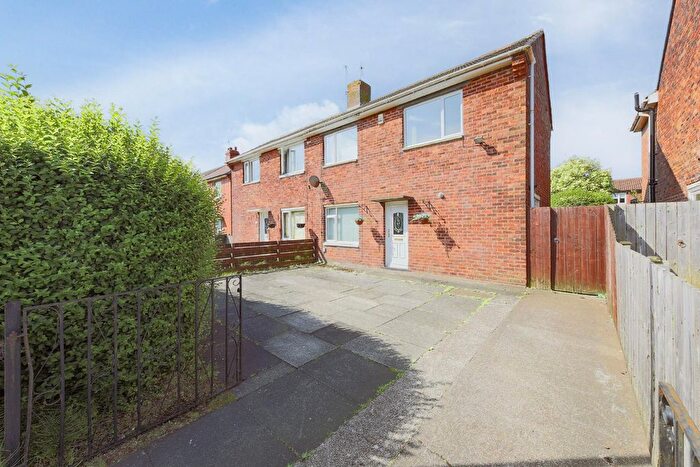
Properties for sale in Camperdown
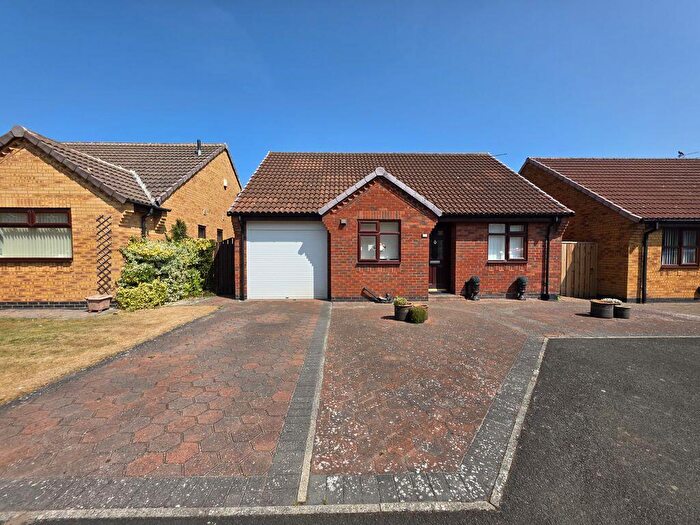
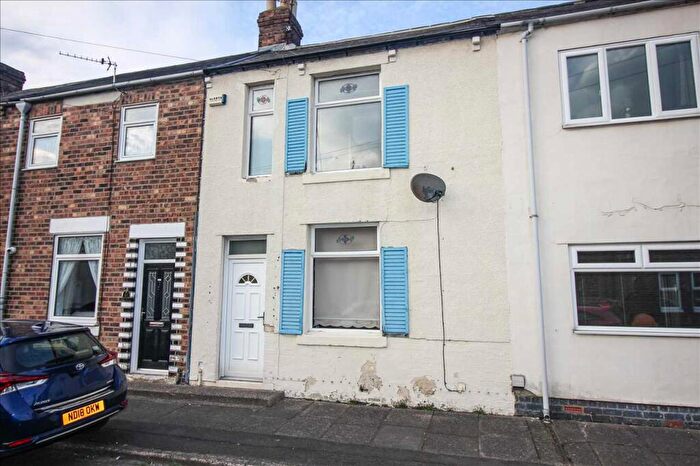
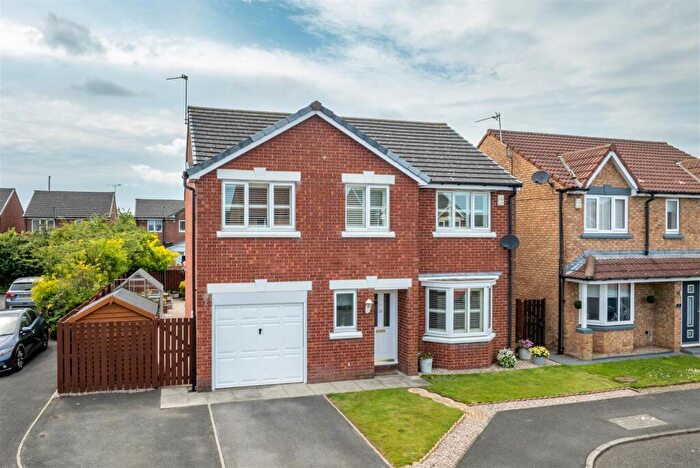

![]()
If you are looking to sell your house, let it out, or receive a property valuation, an expert can help you.
Click the button below to get started.
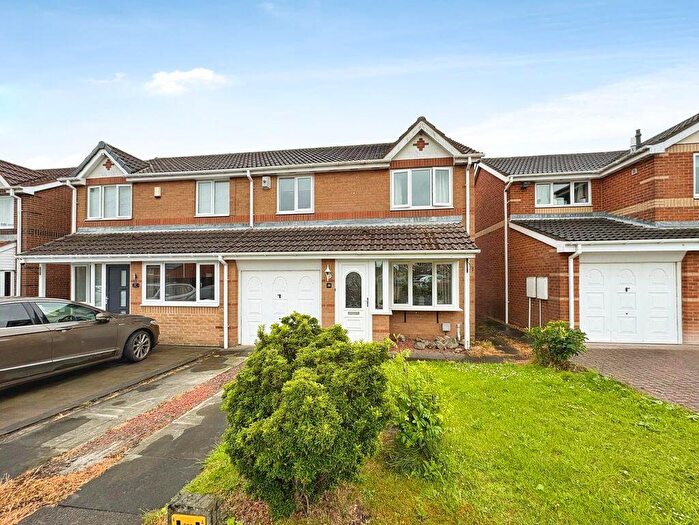
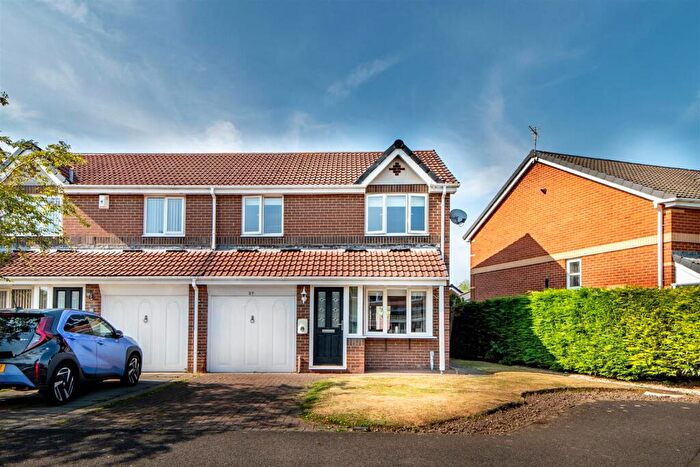
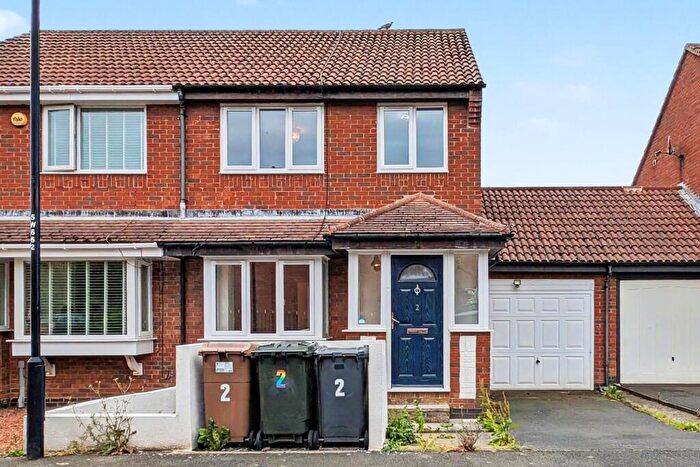
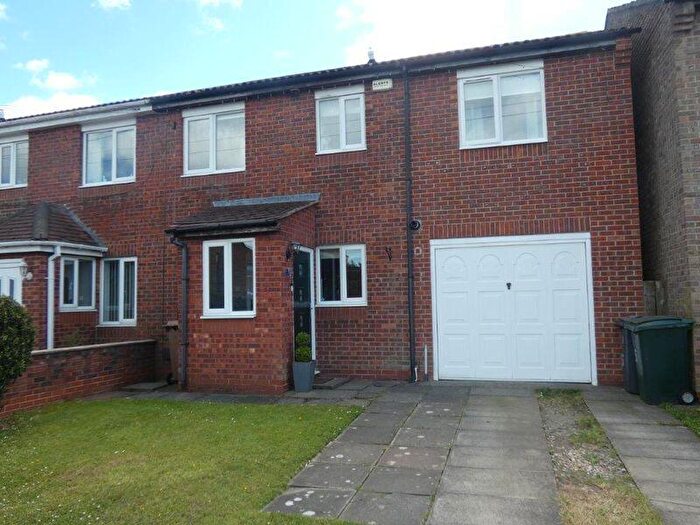
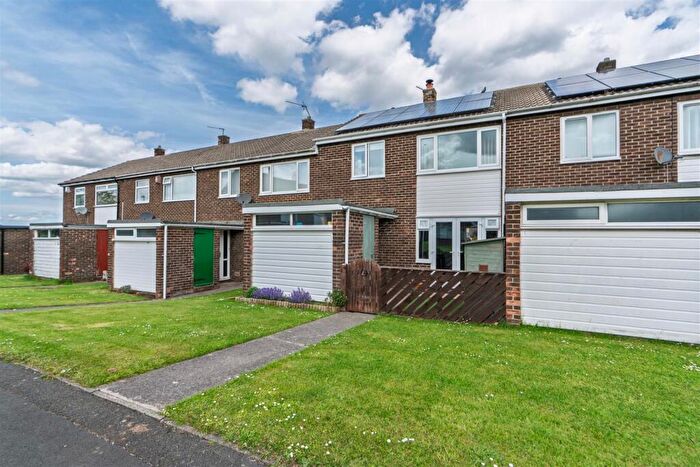
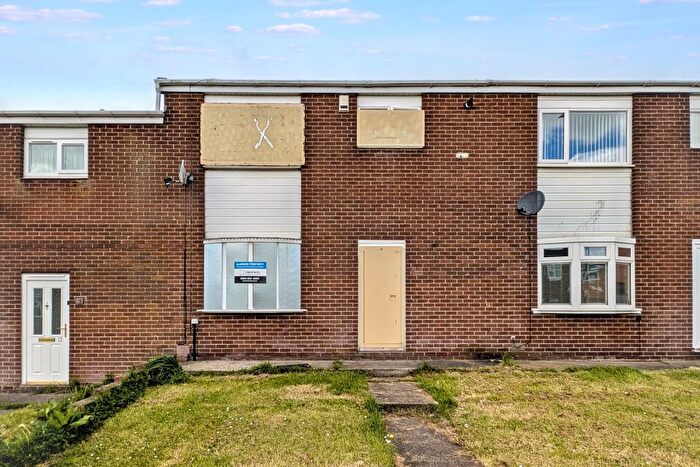
Previously listed properties in Camperdown
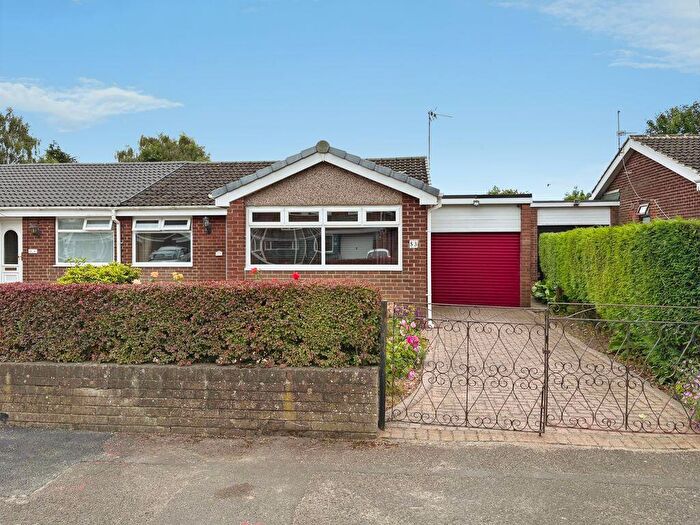
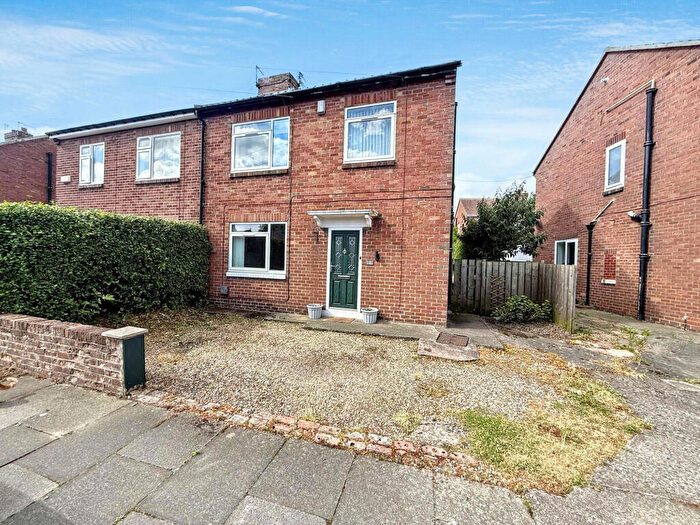


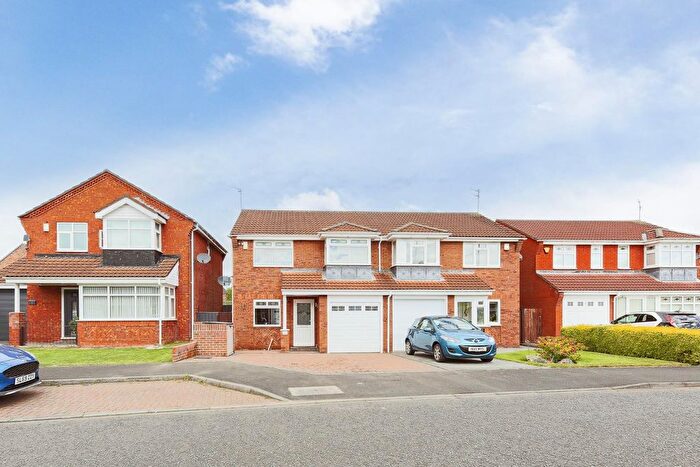
![]()
If you are looking to sell your house, let it out, or receive a property valuation, an expert can help you.
Click the button below to get started.
Roads and Postcodes in Camperdown
Navigate through our locations to find the location of your next house in Camperdown, Cramlington for sale or to rent.
| Streets | Postcodes |
|---|---|
| Aged Miners Homes | NE23 7QU |
| Annitsford Drive | NE23 7AP NE23 7BT NE23 7BU NE23 7BX NE23 7BY |
| Attlee Close | NE23 7PB NE23 7PD |
| Barras Avenue | NE23 7QX |
| Barras Gardens | NE23 7RB |
| Bowman Drive | NE23 7AS NE23 7FF |
| Briarwood | NE23 7DN |
| Bridge Cottages | NE23 7BA |
| Burnside Avenue | NE23 7AT NE23 7AU |
| Burnside Cottages | NE23 7AY |
| Burnview | NE23 7HG |
| Burradon Road | NE23 7AZ NE23 7BB NE23 7BD NE23 7ND NE23 7NE NE23 7NF NE23 7NG NE23 7PP |
| Burt Crescent | NE23 7AR |
| Charles Drive | NE23 7AW |
| Cheviot Grange | NE23 7PN |
| Cloverhill Close | NE23 7UA |
| Coburn Close | NE23 7LD |
| Coronation Street | NE23 7RD |
| Craig Crescent | NE23 7AN |
| Cranbrook | NE23 7FE |
| Crofters Close | NE23 7RJ |
| Dudley Drive | NE23 7AL |
| Eastwood Close | NE23 7LF |
| Emery Court | NE23 7FA |
| Fern Drive | NE23 7AG NE23 7AH NE23 7AQ |
| Front Street | NE23 7NL NE23 7QS NE23 7RQ NE23 7RW |
| Hanover Court | NE23 7RX |
| Harrison Court | NE23 7RN |
| Hudson Avenue | NE23 7BZ NE23 7DA |
| Jubilee Court | NE23 7RP NE23 7RR |
| Kirkdale Court | NE23 7PL |
| Kirklands | NE23 7LE |
| Kirkwood | NE23 7PF NE23 7PG NE23 7PH NE23 7PJ NE23 7PQ |
| Lee Street | NE23 7DP |
| Love Avenue | NE23 7BH NE23 7BJ NE23 7BL |
| Love Avenue Cottages | NE23 7BN |
| March Road | NE23 7BP |
| Means Court | NE23 7PE |
| Means Drive | NE23 7NP NE23 7NR NE23 7NS NE23 7NT NE23 7NU NE23 7NW |
| Morris Court | NE23 7AX |
| Oakley Close | NE23 7UE |
| Orange Grove | NE23 7QT |
| Owen Brannigan Drive | NE23 7BG |
| Ozanan Close | NE23 7BW |
| Park View | NE23 7LB |
| Patrick Terrace | NE23 7BQ |
| Primrose Close | NE23 7UD NE23 7UH |
| Quarry Cottages | NE23 7NB |
| Queens Gardens | NE23 7QZ |
| Queens Road | NE23 7RA |
| Redford Place | NE23 7LG |
| Seaton Avenue | NE23 7QY |
| Seaton Croft | NE23 7LA |
| Seghill Road End | NE23 7BE |
| Shepherd Close | NE23 7PT |
| Shillaw Place | NE23 7NX NE23 7PA |
| South View | NE23 7RF |
| Strawberry Terrace | NE23 7NH |
| The Colliers | NE23 7PU |
| The Spinney | NE23 7NY |
| Wardle Drive | NE23 7DB NE23 7DD NE23 7DE |
| Weetslade Terrace | NE23 7NQ |
| Woodcroft Close | NE23 7UF |
| Wright Drive | NE23 7BS |
| NE23 7NJ |
Property price trends in Camperdown
According to the latest Land Registry data, the average home in Camperdown sold for £246,500 in 2026. That figure comes from 1,750 sales logged over the past 31 years.
Prices have continued to climb over the last three years. Compared with 2023, when the typical sale came in around £127,437, that's a rise of roughly 93.4%.
Looking back five years, average prices are up about 114.2% since 2021, a gain of around £131,422 in cash terms.
Zoom out to the past decade for the fuller picture. Back in 2016, homes here averaged £117,480, so the typical sold price has climbed about 109.8% since then, roughly 7.7% a year. Stretch the view to fifteen years and that annual pace eases back to about 6.5%.
Frequently asked questions about Camperdown
What is the average price for a property for sale in Camperdown?
The average price for a property for sale in Camperdown is £142,258. This amount is 0.78% lower than the average price in Cramlington. There are 438 property listings for sale in Camperdown.
What streets have the most expensive properties for sale in Camperdown?
The streets with the most expensive properties for sale in Camperdown are Crofters Close at an average of £309,237, The Spinney at an average of £296,000 and Oakley Close at an average of £261,250.
What streets have the most affordable properties for sale in Camperdown?
The streets with the most affordable properties for sale in Camperdown are Burnside Avenue at an average of £78,250, Orange Grove at an average of £79,991 and Barras Gardens at an average of £80,000.
Which train stations are available in or near Camperdown?
Some of the train stations available in or near Camperdown are Cramlington, Manors and Newcastle.
Property Price Paid in Camperdown by Year
The average sold property price by year was:
| Year | Average Sold Price | Price Change |
Sold Properties
|
|---|---|---|---|
| 2026 | £246,500 | 41% |
5 Properties |
| 2025 | £146,375 | 4% |
51 Properties |
| 2024 | £140,092 | 9% |
57 Properties |
| 2023 | £127,437 | -13% |
41 Properties |
| 2022 | £144,542 | 20% |
40 Properties |
| 2021 | £115,078 | 13% |
64 Properties |
| 2020 | £100,010 | -4% |
33 Properties |
| 2019 | £103,647 | -11% |
60 Properties |
| 2018 | £114,895 | 3% |
62 Properties |
| 2017 | £111,943 | -5% |
56 Properties |
Property Price per Property Type in Camperdown
Here you can find historic sold price data in order to help with your property search.
The average Property Paid Price for specific property types in the last three years are:
| Property Type | Average Sold Price | Sold Properties |
|---|---|---|
| Semi Detached House | £146,156.00 | 40 Semi Detached Houses |
| Detached House | £274,997.00 | 21 Detached Houses |
| Terraced House | £114,786.00 | 82 Terraced Houses |
| Flat | £79,465.00 | 11 Flats |
