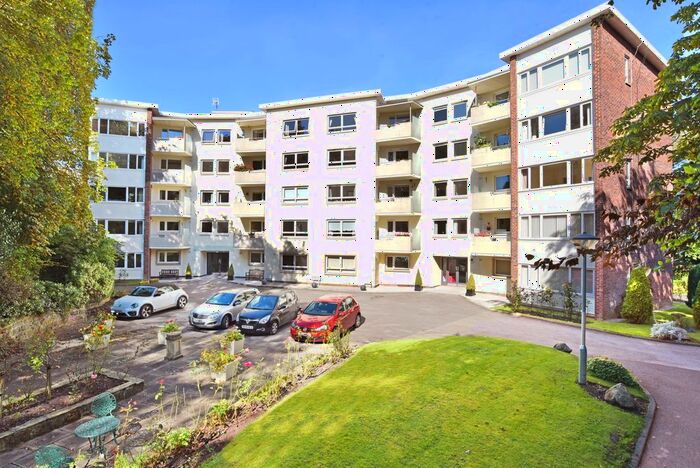
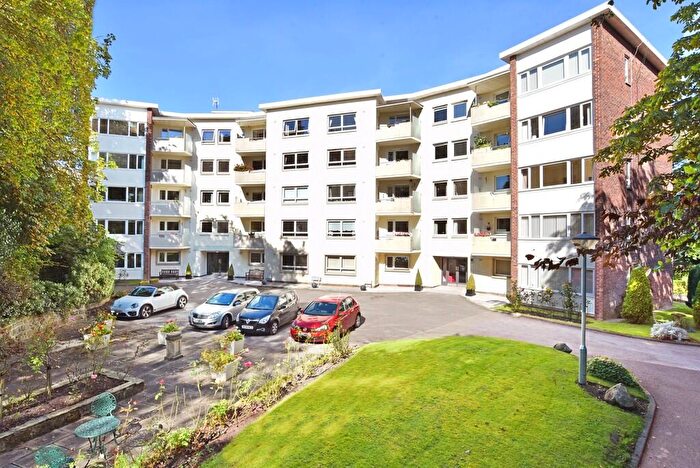
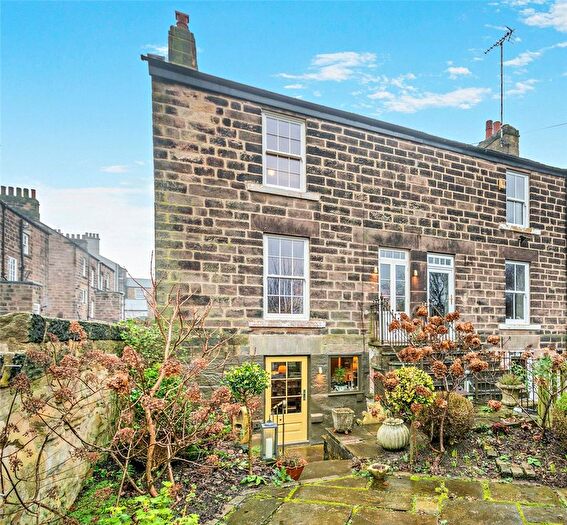
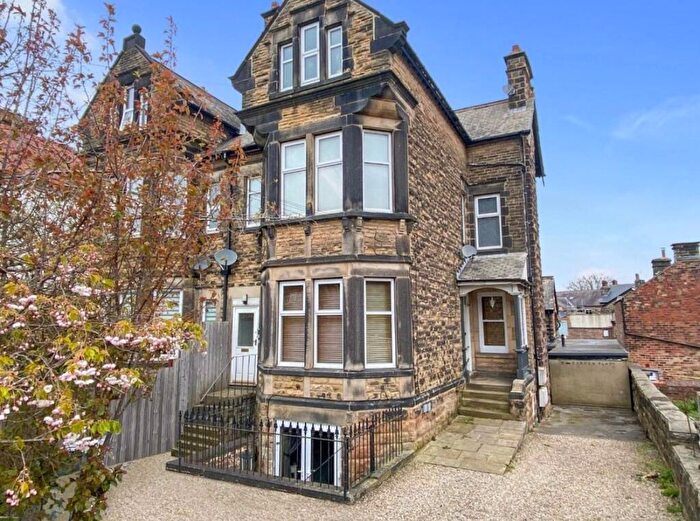
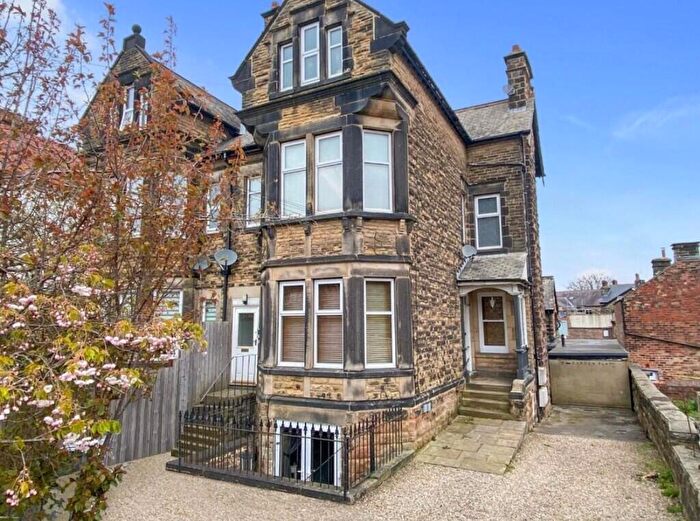
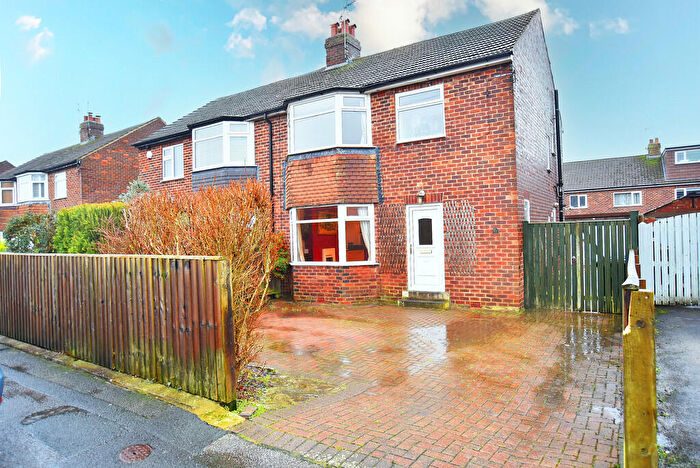
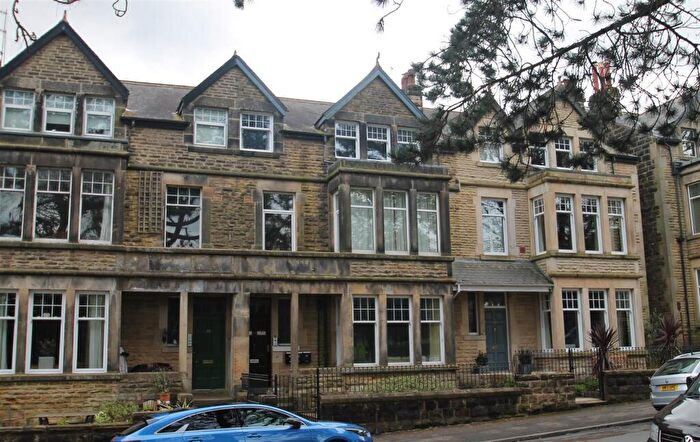
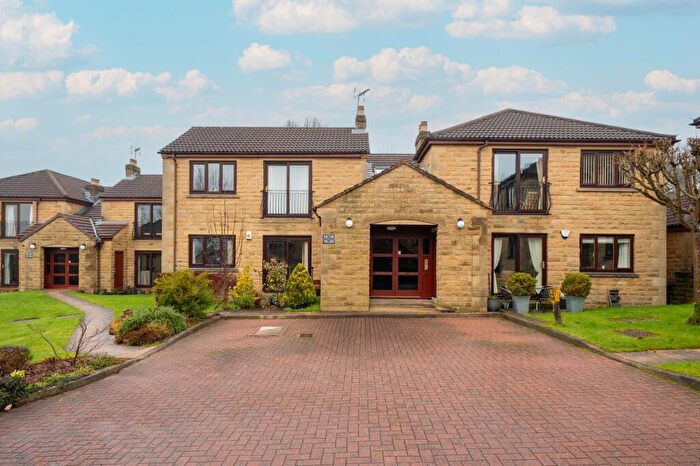
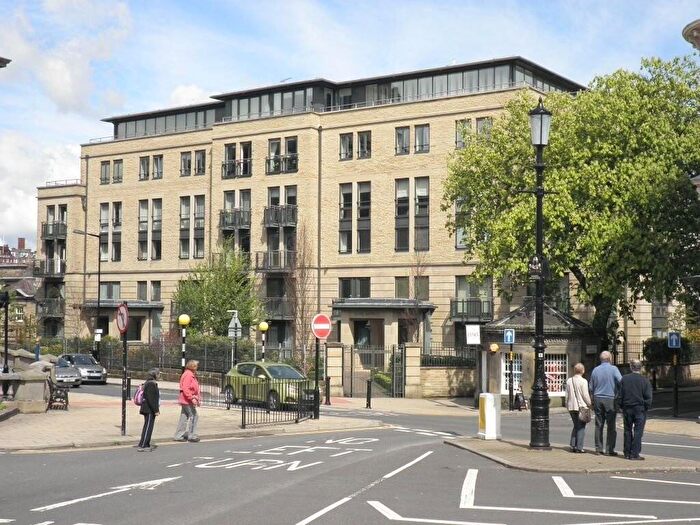
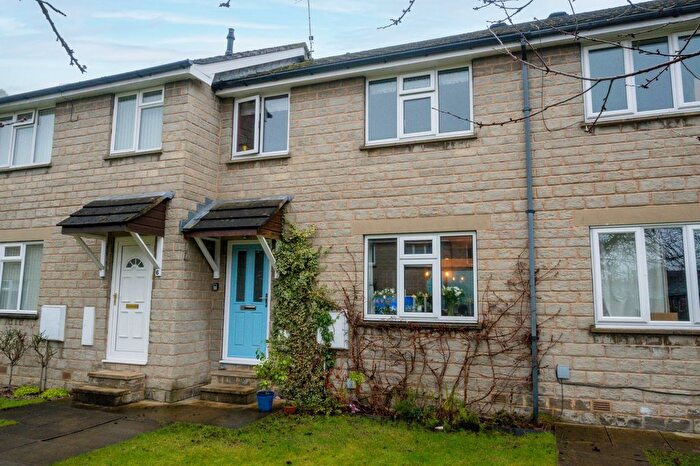
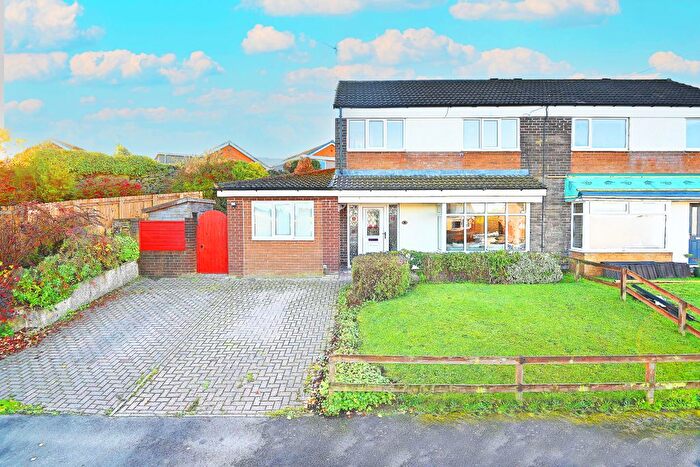
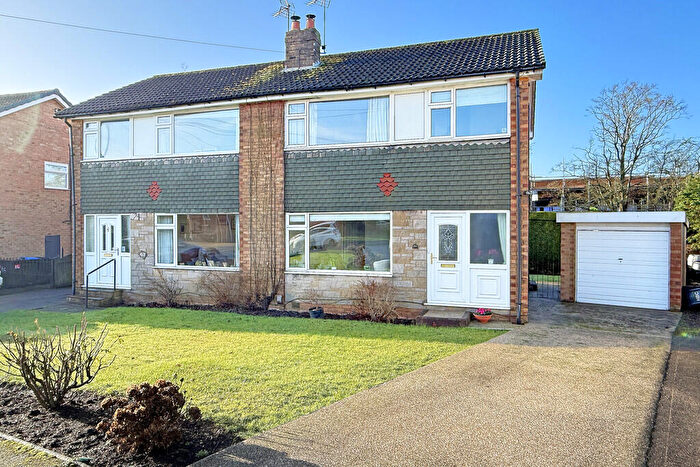
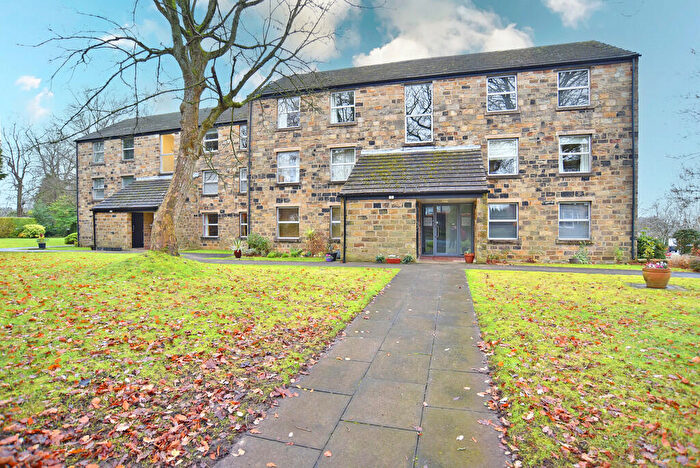
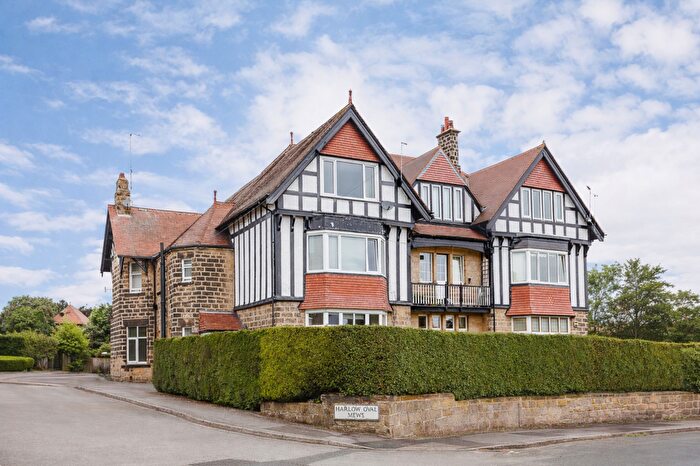
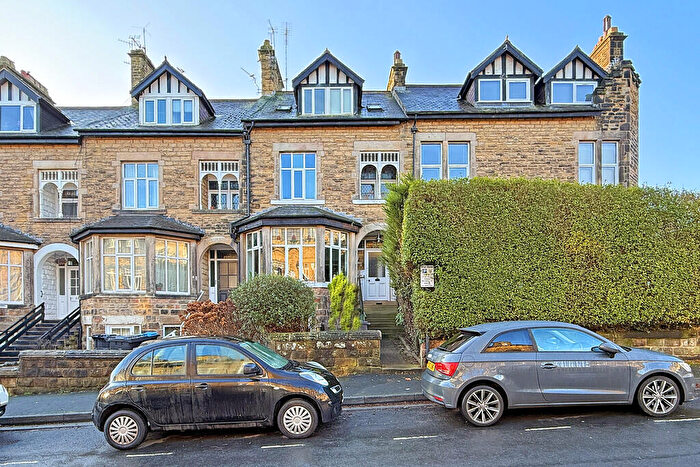
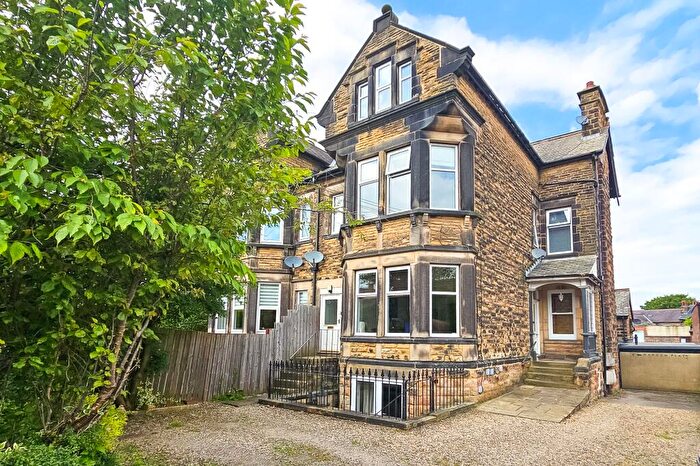
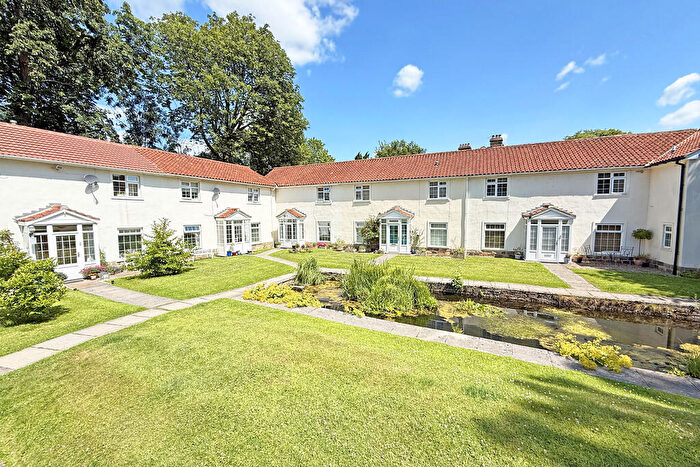
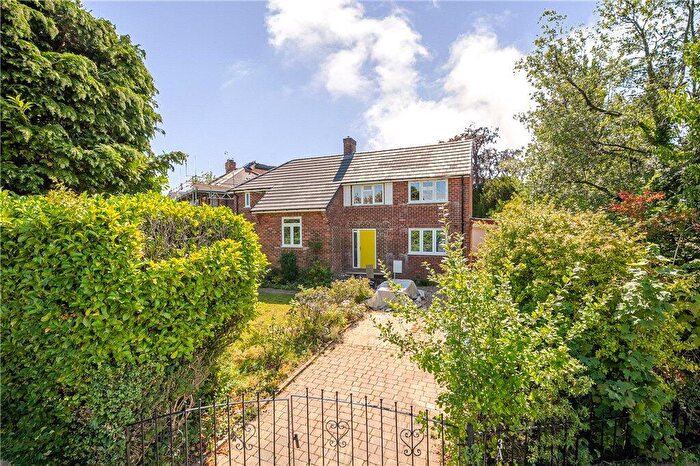
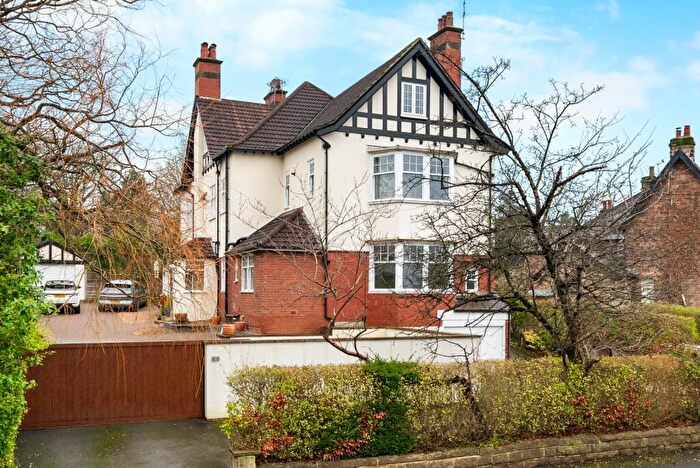
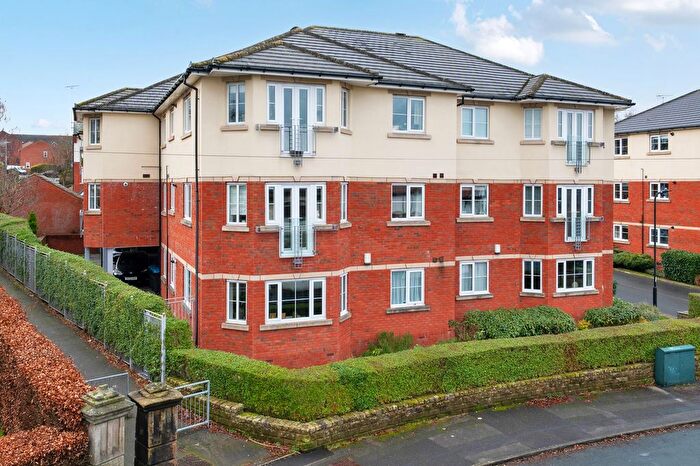
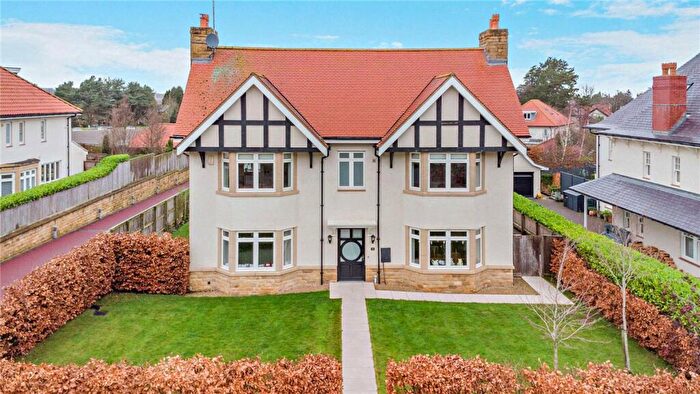
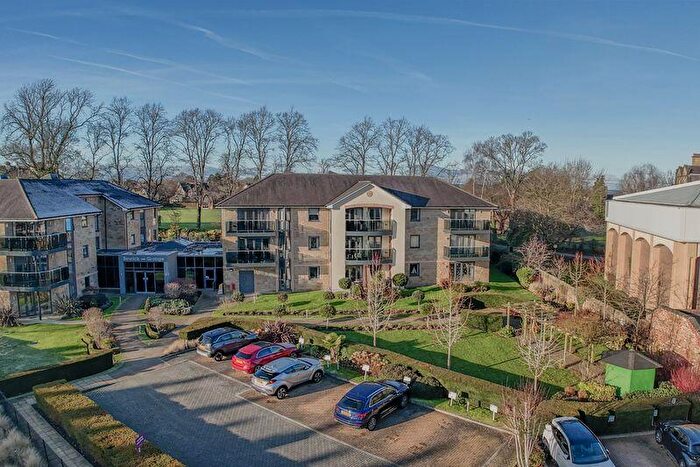
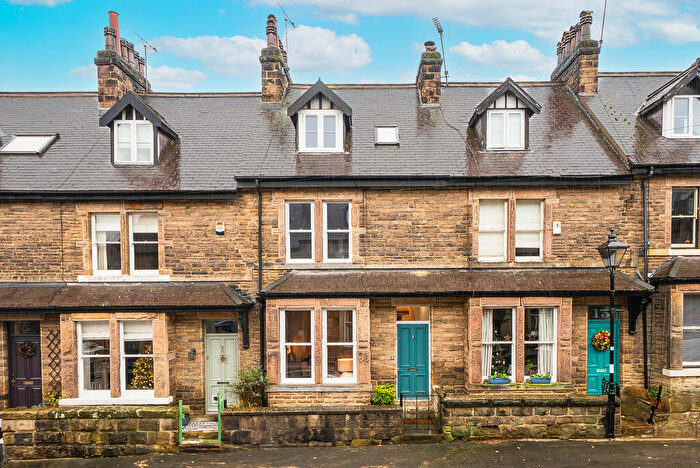
Houses for sale & to rent in Harlow Moor, Harrogate
House Prices in Harlow Moor
Properties in Harlow Moor have an average house price of £551,100.00 and had 271 Property Transactions within the last 3 years¹.
Harlow Moor is an area in Harrogate, North Yorkshire with 2,249 households², where the most expensive property was sold for £2,300,000.00.
Properties for sale in Harlow Moor
Roads and Postcodes in Harlow Moor
Navigate through our locations to find the location of your next house in Harlow Moor, Harrogate for sale or to rent.
| Streets | Postcodes |
|---|---|
| Back Harlow Moor Drive | HG2 0JE |
| Birk Crag Court | HG3 2GH |
| Brunswick Drive | HG1 2PZ HG1 2QP HG1 2QW |
| Chapman Square | HG1 2SL HG1 2SQ |
| Clarence Drive | HG1 2QE |
| Cliffe Road | HG2 0PW |
| Cold Bath Place | HG2 0PQ |
| Cold Bath Road | HG2 0HW HG2 0NX HG2 0PB |
| Cornwall Close | HG1 2NY |
| Cornwall Road | HG1 2NB HG1 2NE HG1 2NG HG1 2PL HG1 2PP HG1 2PR |
| Crag Lane | HG3 1QA |
| Dale Bank | HG1 2LP |
| Dorset Close | HG1 2LR |
| Dorset Crescent | HG1 2LU |
| Duchy Road | HG1 2EP HG1 2ER HG1 2EY HG1 2EZ HG1 2HA HG1 2HB HG1 2HE |
| Ebor Rise | HG1 2QJ |
| Ellis Court | HG1 2SH |
| Evelyn Court | HG3 2GD |
| Florence Road | HG2 0LD |
| Florin Walk | HG1 2SN |
| Garden Mews | HG2 0FD |
| Harlow Grange Park | HG3 1GW HG3 1PX |
| Harlow Manor Park | HG2 0EG HG2 0HH HG2 0QH HG2 0QJ |
| Harlow Moor Drive | HG2 0EP HG2 0JX HG2 0JY HG2 0LE |
| Harlow Moor Road | HG2 0LF |
| Harlow Oval | HG2 0DR HG2 0DS HG2 0DT |
| Harlow Oval Mews | HG2 0HJ |
| Harlow Pines | HG3 1PZ |
| Harlow Terrace | HG2 0PN HG2 0PP |
| Heath Grove | HG2 0PX |
| Hereford Road | HG1 2NP HG1 2NW HG1 2PX |
| Kent Avenue | HG1 2ES |
| Kent Bank | HG1 2NQ |
| Kent Drive | HG1 2LG |
| Kent Road | HG1 2ET HG1 2EU HG1 2LE HG1 2LH HG1 2LJ HG1 2NH HG1 2NL |
| Kent Road North | HG1 2EX |
| Lascelles Grove | HG2 0LB |
| Lascelles Road | HG2 0LA |
| Long Crag View | HG3 2GJ |
| Manor Drive | HG2 0HR |
| Manor Road | HG2 0HP |
| Margaret Road | HG2 0JZ |
| Nursery Lane | HG2 0AZ |
| Oakdale | HG1 2LF HG1 2LL HG1 2LS HG1 2LT HG1 2LW |
| Oakdale Glen | HG1 2JY HG1 2JZ |
| Oakdale Manor | HG1 2NA |
| Old Chapel Close | HG3 2GG |
| Otley Road | HG2 0DP HG3 1PT |
| Pavilion Square | HG2 0PZ |
| Pendragon Way | HG2 0FG |
| Penny Pot Gardens | HG3 2GB |
| Penny Pot Lane | HG3 2SA HG3 2SD |
| Pinewood Gate | HG2 0JF |
| Plantation Avenue | HG2 0DD |
| Plantation Close | HG2 0DF |
| Plantation Road | HG2 0DB |
| Plantation Terrace | HG2 0DE |
| Promenade Square | HG1 2PH HG1 2PJ |
| Queen Ethelburgas Gardens | HG3 2GF |
| Queen Ethelburgas Park | HG3 2GE |
| Ripon Road | HG1 2JL HG1 2NT |
| Rutland Close | HG1 2HF |
| Rutland Drive | HG1 2NS HG1 2NU HG1 2NX HG1 2PB |
| Rutland Road | HG1 2PY |
| Sovereign Park | HG1 2SF HG1 2SJ |
| Swinton Court | HG2 0BB HG2 0BD |
| Valley Drive | HG2 0JT |
| West Cliffe Corner | HG2 0PJ |
| West Cliffe Grove | HG2 0PL HG2 0PS |
| West Cliffe Mews | HG2 0PY |
| West Cliffe Mount | HG2 0PR |
| West Cliffe Terrace | HG2 0PT HG2 0PU |
| Wood View | HG1 2LQ |
| York Road | HG1 2QA HG1 2QH HG1 2QL |
| Youngs Drive | HG3 2GA |
Transport near Harlow Moor
- FAQ
- Price Paid By Year
- Property Type Price
Frequently asked questions about Harlow Moor
What is the average price for a property for sale in Harlow Moor?
The average price for a property for sale in Harlow Moor is £551,100. This amount is 39% higher than the average price in Harrogate. There are 2,271 property listings for sale in Harlow Moor.
What streets have the most expensive properties for sale in Harlow Moor?
The streets with the most expensive properties for sale in Harlow Moor are Duchy Road at an average of £1,348,636, Ebor Rise at an average of £1,200,000 and Cornwall Road at an average of £1,052,166.
What streets have the most affordable properties for sale in Harlow Moor?
The streets with the most affordable properties for sale in Harlow Moor are Kent Road North at an average of £137,500, Swinton Court at an average of £219,333 and Harlow Manor Park at an average of £229,073.
Which train stations are available in or near Harlow Moor?
Some of the train stations available in or near Harlow Moor are Harrogate, Hornbeam Park and Starbeck.
Property Price Paid in Harlow Moor by Year
The average sold property price by year was:
| Year | Average Sold Price | Price Change |
Sold Properties
|
|---|---|---|---|
| 2025 | £467,314 | -17% |
77 Properties |
| 2024 | £547,168 | -14% |
100 Properties |
| 2023 | £623,916 | 5% |
94 Properties |
| 2022 | £589,996 | 6% |
111 Properties |
| 2021 | £554,600 | 10% |
145 Properties |
| 2020 | £499,353 | 2% |
82 Properties |
| 2019 | £490,646 | 6% |
92 Properties |
| 2018 | £462,555 | -4% |
107 Properties |
| 2017 | £479,985 | 15% |
106 Properties |
| 2016 | £408,459 | -10% |
125 Properties |
| 2015 | £449,080 | 14% |
149 Properties |
| 2014 | £388,022 | -3% |
152 Properties |
| 2013 | £398,498 | 12% |
117 Properties |
| 2012 | £350,495 | -2% |
94 Properties |
| 2011 | £358,144 | 7% |
113 Properties |
| 2010 | £332,386 | -15% |
110 Properties |
| 2009 | £383,873 | -1% |
93 Properties |
| 2008 | £386,448 | 2% |
80 Properties |
| 2007 | £379,134 | 13% |
163 Properties |
| 2006 | £331,116 | -6% |
151 Properties |
| 2005 | £351,203 | 10% |
131 Properties |
| 2004 | £316,935 | 17% |
172 Properties |
| 2003 | £263,824 | 21% |
183 Properties |
| 2002 | £208,606 | 9% |
186 Properties |
| 2001 | £190,217 | 19% |
156 Properties |
| 2000 | £153,170 | -3% |
163 Properties |
| 1999 | £158,014 | 6% |
161 Properties |
| 1998 | £148,920 | 20% |
174 Properties |
| 1997 | £119,852 | 5% |
178 Properties |
| 1996 | £114,310 | 12% |
145 Properties |
| 1995 | £100,156 | - |
111 Properties |
Property Price per Property Type in Harlow Moor
Here you can find historic sold price data in order to help with your property search.
The average Property Paid Price for specific property types in the last three years are:
| Property Type | Average Sold Price | Sold Properties |
|---|---|---|
| Semi Detached House | £683,576.00 | 41 Semi Detached Houses |
| Detached House | £997,548.00 | 66 Detached Houses |
| Terraced House | £562,150.00 | 30 Terraced Houses |
| Flat | £288,200.00 | 134 Flats |

