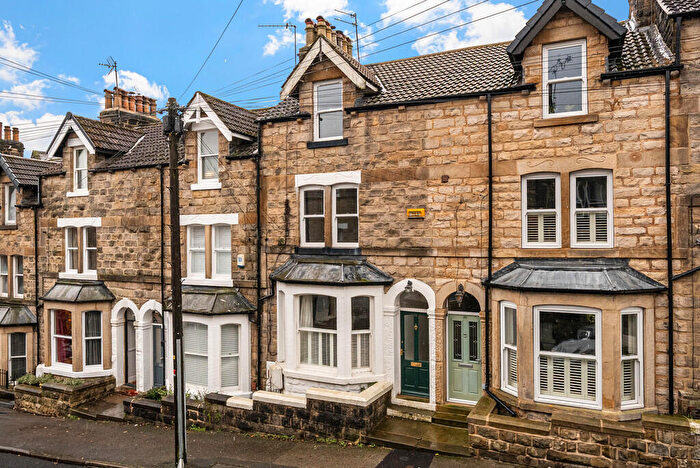
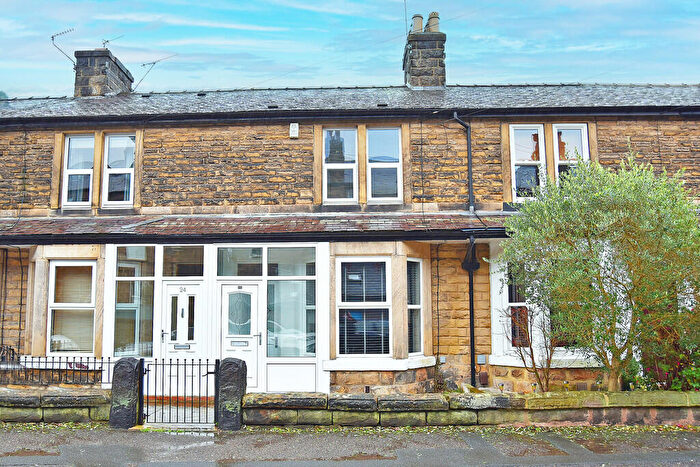
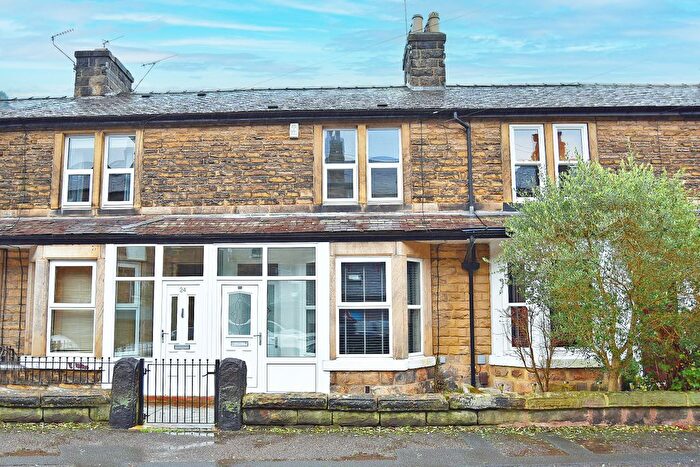
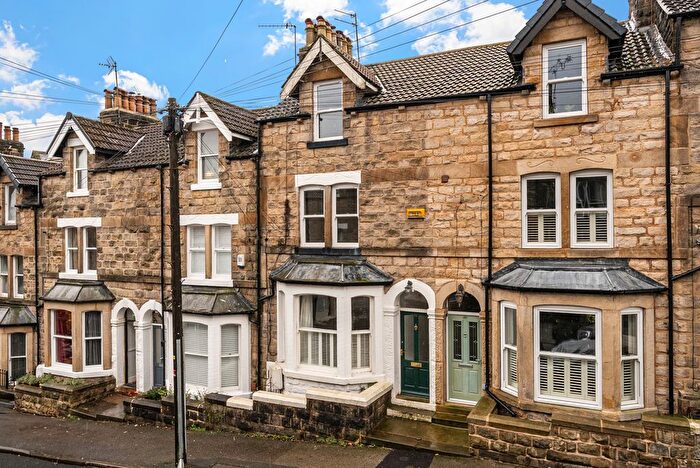
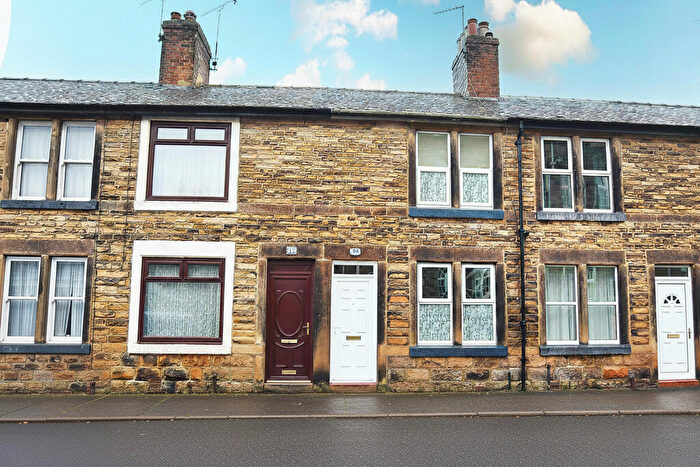
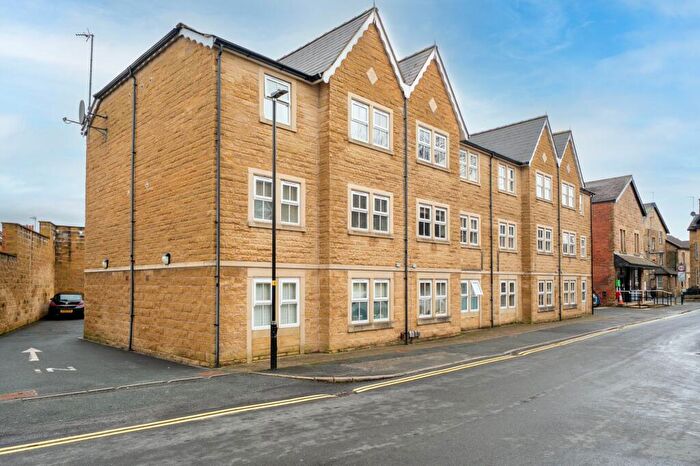
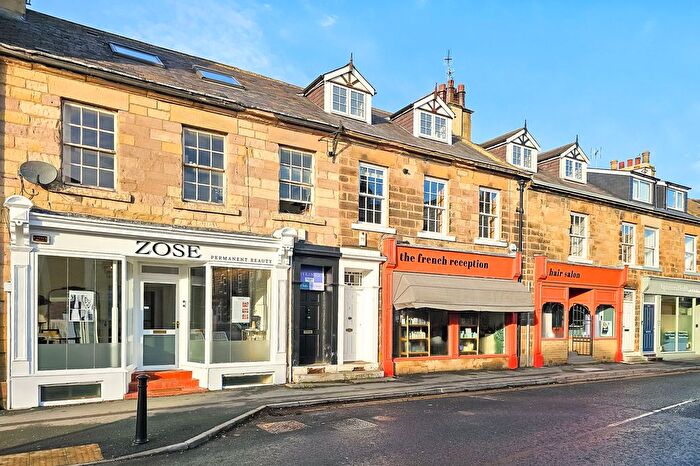
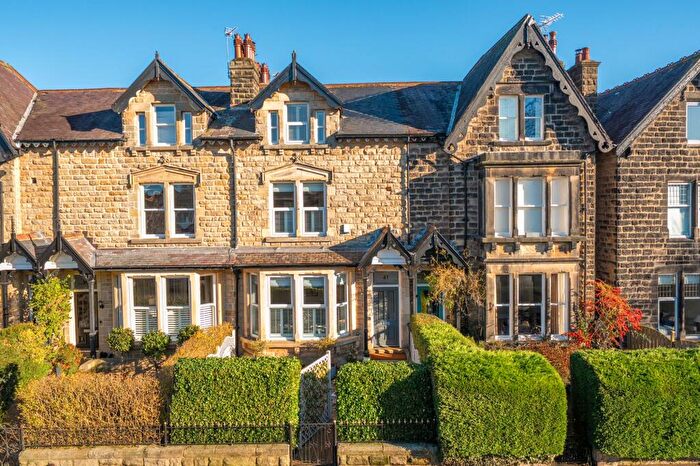
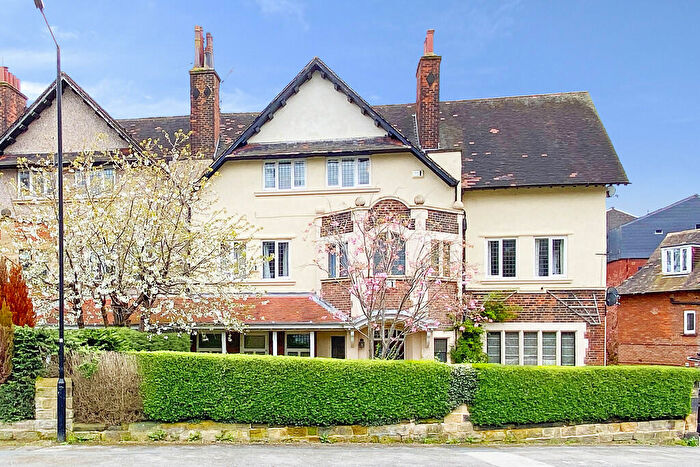
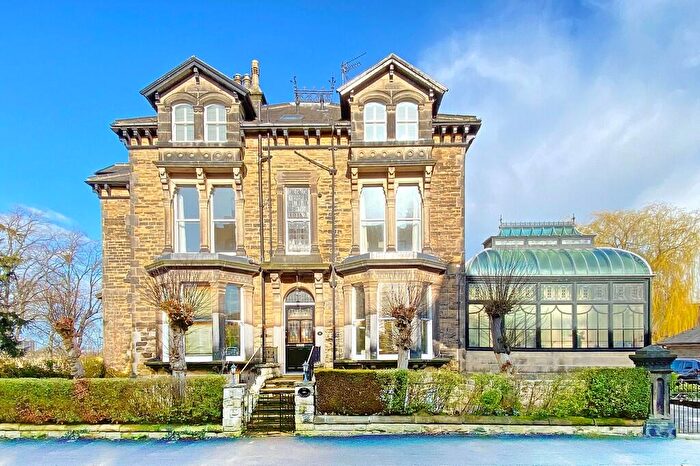
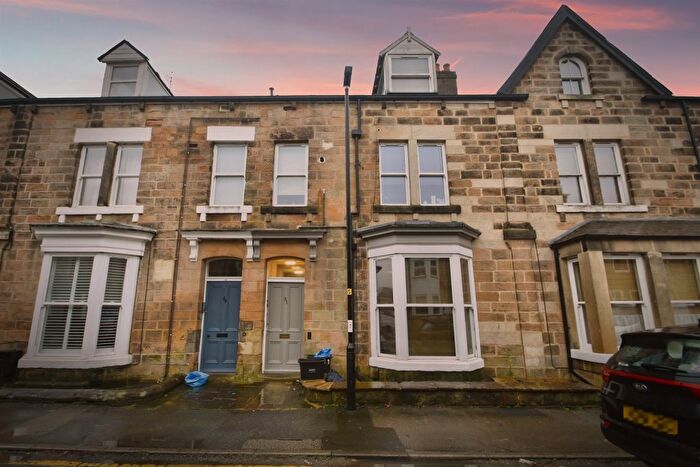
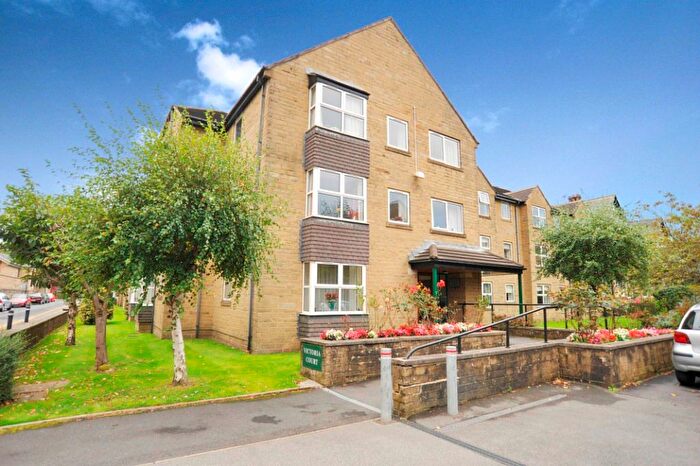
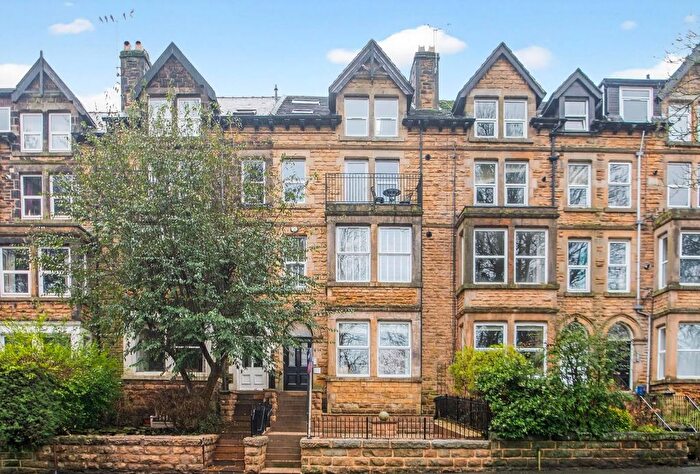
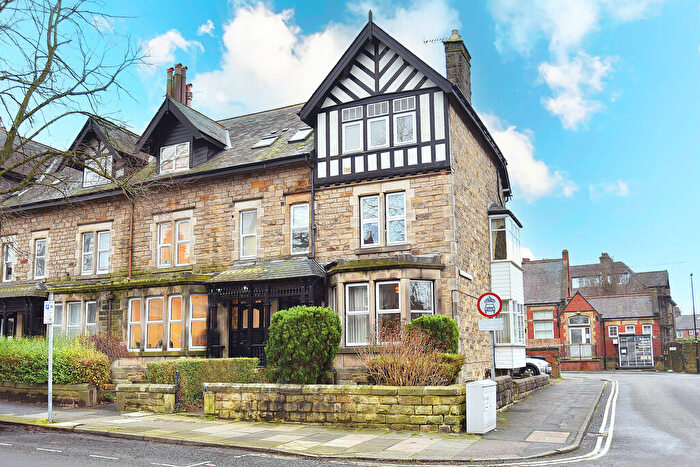
Houses for sale & to rent in Low Harrogate, Harrogate
House Prices in Low Harrogate
Properties in Low Harrogate have an average house price of £377,193.00 and had 433 Property Transactions within the last 3 years¹.
Low Harrogate is an area in Harrogate, North Yorkshire with 2,964 households², where the most expensive property was sold for £2,500,000.00.
Properties for sale in Low Harrogate
Roads and Postcodes in Low Harrogate
Navigate through our locations to find the location of your next house in Low Harrogate, Harrogate for sale or to rent.
| Streets | Postcodes |
|---|---|
| Albert Street | HG1 1JX |
| Albert Terrace | HG1 1HY |
| Alexandra Road | HG1 5JS |
| Beech Grove | HG2 0EL HG2 0ER HG2 0ES HG2 0ET HG2 0EU HG2 0EW HG2 0EX HG2 0LL |
| Beechwood Crescent | HG2 0PA |
| Belford Place | HG1 1HX |
| Belmont Road | HG2 0LR |
| Bower Road | HG1 1BA HG1 1BB HG1 1BE |
| Byron Walk Mews | HG2 0LQ |
| Cambridge Terrace | HG1 1PN |
| Cheltenham Crescent | HG1 1DH |
| Cheltenham Mount | HG1 1DL HG1 1DW |
| Cheltenham Parade | HG1 1DB HG1 1DD |
| Cold Bath Road | HG2 0HN HG2 0NA HG2 0NL HG2 0NT HG2 0NU |
| Commercial Street | HG1 1AX HG1 1TZ HG1 1UA HG1 1UB |
| Coppice Beck Court | HG1 2LB |
| Coppice Drive | HG1 2JE |
| Crescent Road | HG1 2RT |
| Duchy Avenue | HG2 0NB |
| Duchy Grove | HG2 0ND |
| Franklin Mount | HG1 5EJ |
| Franklin Road | HG1 5ED HG1 5EE HG1 5EH |
| Glebe Avenue | HG2 0LT |
| Glebe Road | HG2 0LG HG2 0LZ |
| Granville Road | HG1 1BY |
| Hampsthwaite Road | HG1 2JQ |
| Heywood Road | HG2 0LU |
| Hollins Crescent | HG1 2JG |
| Hollins Mews | HG1 2HJ |
| Hollins Road | HG1 2JF |
| Kensington Square | HG2 0NW |
| Kings Road | HG1 5HH HG1 5HJ HG1 5JR HG1 5JX HG1 5JY |
| Lancaster Road | HG2 0EZ |
| Mansfield Court | HG1 2QR HG1 2QT |
| Mayfield Grove | HG1 5EY HG1 5HB HG1 5HD |
| Mayfield Terrace | HG1 5EZ |
| Montpellier Parade | HG1 2TJ |
| Montpellier Road | HG1 2EG |
| Mount Parade | HG1 1BX |
| Nydd Vale Terrace | HG1 5HA |
| Oak Terrace | HG2 0EN |
| Otley Road | HG2 0DN |
| Oxford Terrace | HG1 1HT |
| Parliament Street | HG1 2BU HG1 2QU HG1 2RL |
| Parliament Terrace | HG1 2QY |
| Portland Crescent | HG1 2QS HG1 2TR HG1 2TS |
| Prince Of Wales Mansions | HG1 1JB |
| Princes Square | HG1 1LX |
| Prospect Crescent | HG1 1RH |
| Prospect Place | HG1 1LB |
| Queens Close | HG2 0HG |
| Queens Road | HG2 0HA HG2 0HB HG2 0HD HG2 0HE HG2 0HF HG2 0QD |
| Raglan Street | HG1 1LE |
| Ripon Road | HG1 2JB HG1 2JJ |
| Robert Street | HG1 1HP |
| Royal Gardens | HG2 0NR |
| Royal Parade | HG1 2SZ HG1 2TA |
| Somerset Road | HG2 0LY |
| Spring Grove | HG1 2HS HG1 2HT |
| Spring Mount | HG1 2HX |
| Springfield Avenue | HG1 2HR |
| Springfield Mews | HG1 2HP |
| St Marys Avenue | HG2 0LP |
| St Marys Walk | HG2 0LS HG2 0LW |
| St Peters Square | HG2 0NP |
| Station Bridge | HG1 1SS |
| Station Parade | HG1 1HQ HG1 1TU HG1 1TX HG1 1UF |
| Strawberry Dale | HG1 5EF |
| Strawberry Dale Avenue | HG1 5EA |
| Strawberry Dale Square | HG1 5EB |
| Strawberry Dale Terrace | HG1 5EQ |
| Studley Road | HG1 5JU |
| Swan Road | HG1 2SA HG1 2SB HG1 2SS HG1 2SW |
| Tower Street | HG1 1HS |
| Trafalgar Road | HG1 1HN HG1 1HW HG1 1SG |
| Treesdale Road | HG2 0LX |
| Union Street | HG1 1BS HG1 1BW |
| Valley Drive | HG2 0BF HG2 0DH HG2 0JH HG2 0JJ HG2 0JL HG2 0JN HG2 0JP HG2 0JR HG2 0JS HG2 0JW |
| Valley Mount | HG2 0JG HG2 0NH |
| Valley Road | HG2 0JQ |
| Victoria Avenue | HG1 1EQ |
| Victoria Road | HG2 0EJ HG2 0EY HG2 0HQ HG2 0LJ |
| Wellington Square | HG2 0NN |
| West Park | HG1 1BJ HG1 1BL |
| Woodbine Terrace | HG1 5EG |
| Wordsworth Crescent | HG2 0HL |
| York Place | HG1 1HL |
Transport near Low Harrogate
- FAQ
- Price Paid By Year
- Property Type Price
Frequently asked questions about Low Harrogate
What is the average price for a property for sale in Low Harrogate?
The average price for a property for sale in Low Harrogate is £377,193. This amount is 5% lower than the average price in Harrogate. There are 3,898 property listings for sale in Low Harrogate.
What streets have the most expensive properties for sale in Low Harrogate?
The streets with the most expensive properties for sale in Low Harrogate are Royal Parade at an average of £1,040,000, Swan Road at an average of £1,017,142 and Royal Gardens at an average of £1,000,000.
What streets have the most affordable properties for sale in Low Harrogate?
The streets with the most affordable properties for sale in Low Harrogate are Cheltenham Parade at an average of £123,162, Bower Road at an average of £128,750 and Parliament Street at an average of £159,500.
Which train stations are available in or near Low Harrogate?
Some of the train stations available in or near Low Harrogate are Harrogate, Hornbeam Park and Starbeck.
Property Price Paid in Low Harrogate by Year
The average sold property price by year was:
| Year | Average Sold Price | Price Change |
Sold Properties
|
|---|---|---|---|
| 2025 | £357,021 | -4% |
120 Properties |
| 2024 | £371,432 | -8% |
170 Properties |
| 2023 | £400,969 | 15% |
143 Properties |
| 2022 | £339,615 | 1% |
196 Properties |
| 2021 | £336,249 | 6% |
232 Properties |
| 2020 | £315,168 | -3% |
123 Properties |
| 2019 | £323,456 | 5% |
161 Properties |
| 2018 | £306,931 | -18% |
177 Properties |
| 2017 | £362,366 | 9% |
193 Properties |
| 2016 | £328,367 | 14% |
204 Properties |
| 2015 | £281,531 | 8% |
181 Properties |
| 2014 | £259,732 | 1% |
215 Properties |
| 2013 | £256,004 | 1% |
189 Properties |
| 2012 | £253,149 | 5% |
152 Properties |
| 2011 | £241,549 | -12% |
118 Properties |
| 2010 | £271,453 | 12% |
145 Properties |
| 2009 | £238,987 | -16% |
143 Properties |
| 2008 | £278,366 | 9% |
127 Properties |
| 2007 | £252,901 | 3% |
232 Properties |
| 2006 | £246,522 | 4% |
290 Properties |
| 2005 | £237,681 | 7% |
220 Properties |
| 2004 | £221,220 | 16% |
281 Properties |
| 2003 | £186,882 | 13% |
210 Properties |
| 2002 | £162,636 | 19% |
292 Properties |
| 2001 | £131,863 | 9% |
269 Properties |
| 2000 | £120,440 | 24% |
243 Properties |
| 1999 | £91,908 | 12% |
182 Properties |
| 1998 | £80,898 | 7% |
178 Properties |
| 1997 | £74,855 | -2% |
238 Properties |
| 1996 | £76,131 | 2% |
182 Properties |
| 1995 | £74,941 | - |
122 Properties |
Property Price per Property Type in Low Harrogate
Here you can find historic sold price data in order to help with your property search.
The average Property Paid Price for specific property types in the last three years are:
| Property Type | Average Sold Price | Sold Properties |
|---|---|---|
| Semi Detached House | £638,882.00 | 35 Semi Detached Houses |
| Detached House | £738,323.00 | 17 Detached Houses |
| Terraced House | £451,461.00 | 90 Terraced Houses |
| Flat | £301,652.00 | 291 Flats |

