
Houses for sale & to rent in HG3 2HA, High Street, Killinghall, Harrogate
House Prices in HG3 2HA, High Street, Killinghall
Properties in HG3 2HA have no sales history available within the last 3 years. HG3 2HA is a postcode in High Street located in Killinghall, an area in Harrogate, North Yorkshire, with 7 households².
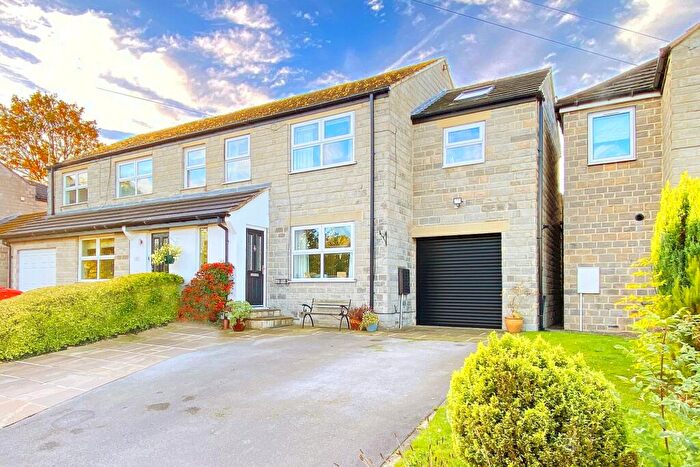
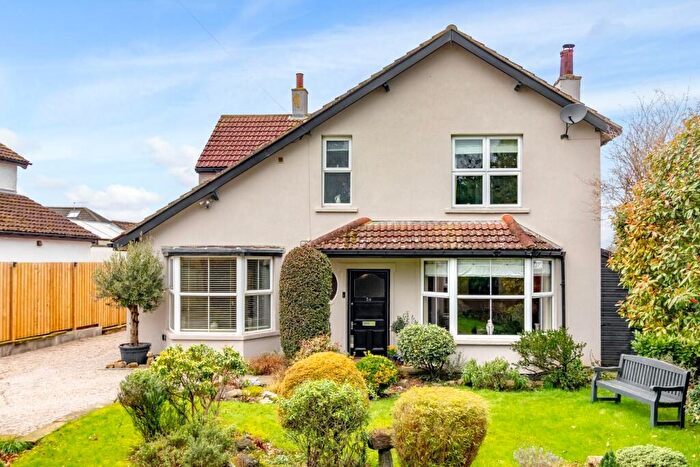
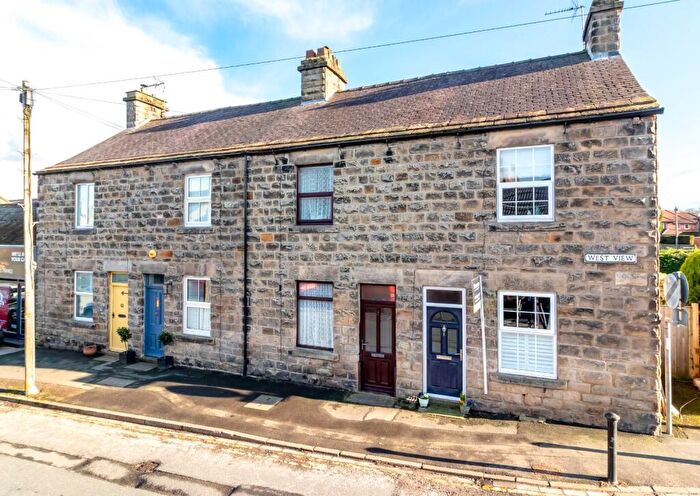
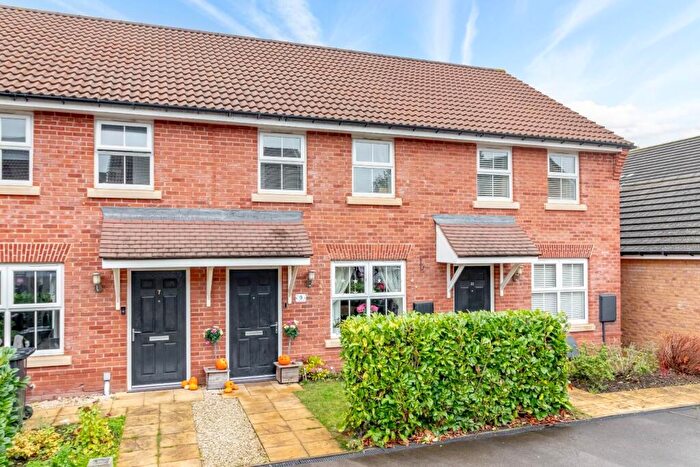
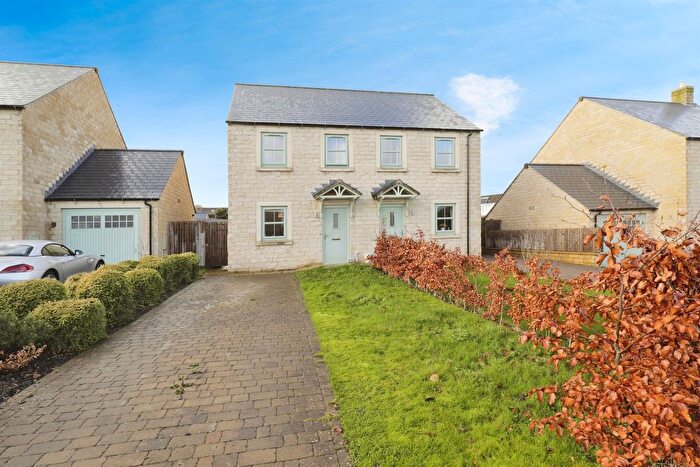
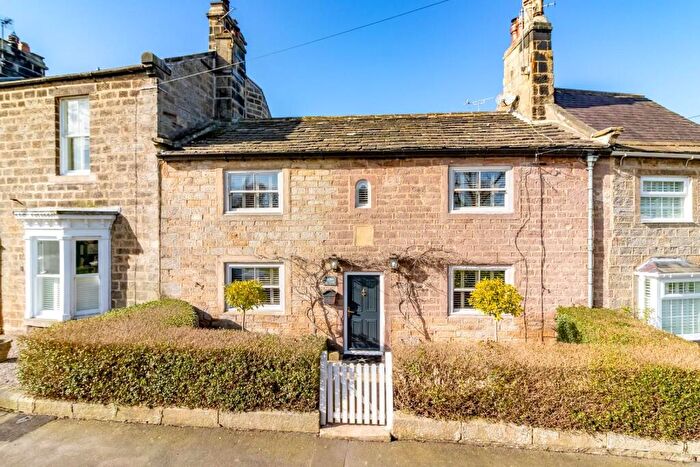
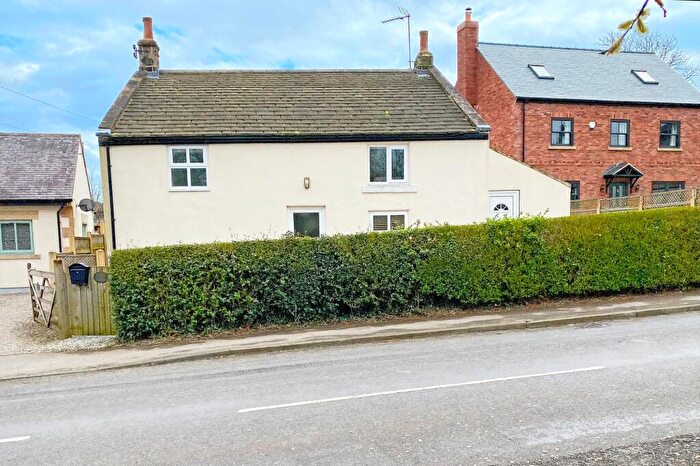
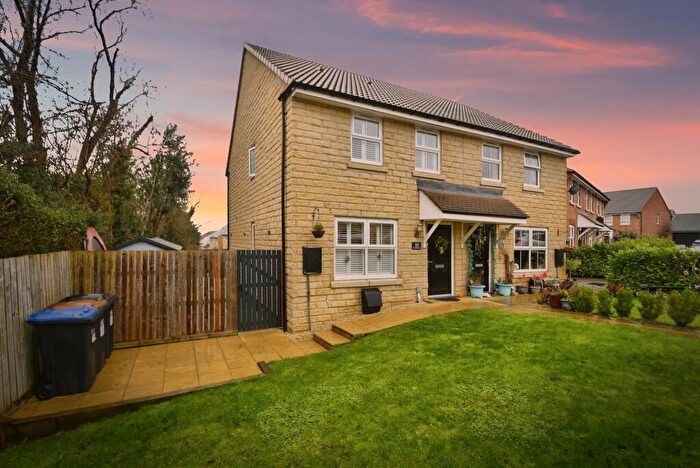
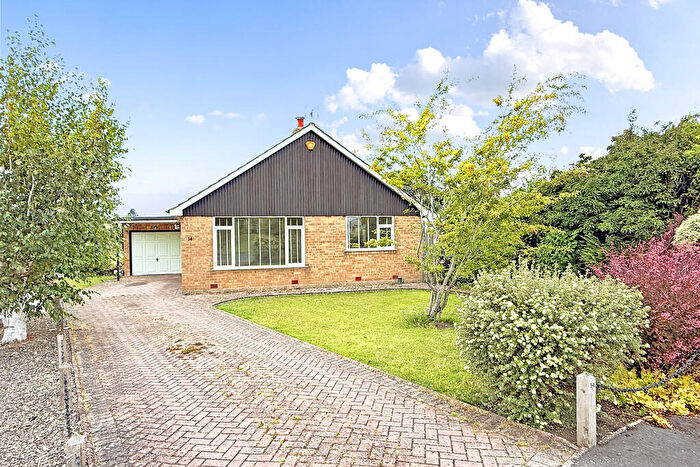
Properties for sale near HG3 2HA, High Street

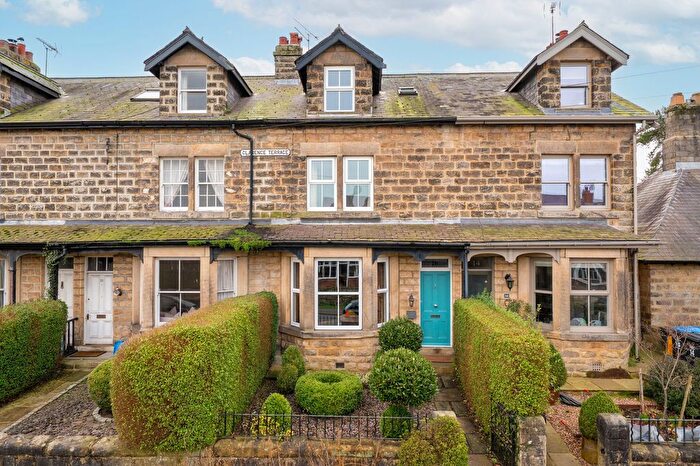
![]()
If you are looking to sell your house, let it out, or receive a property valuation, an expert can help you.
Click the button below to get started.

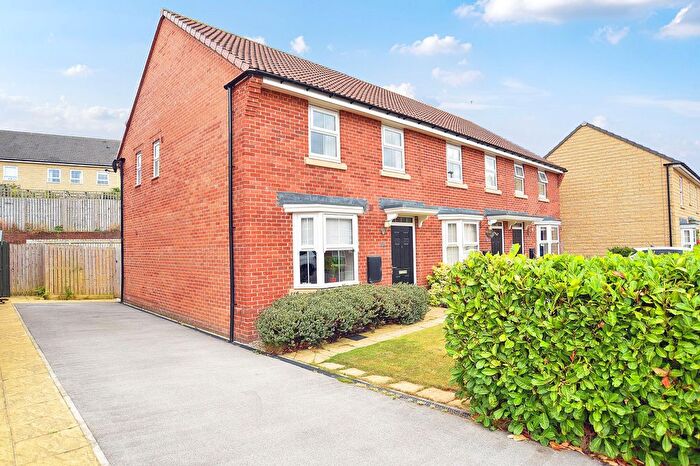
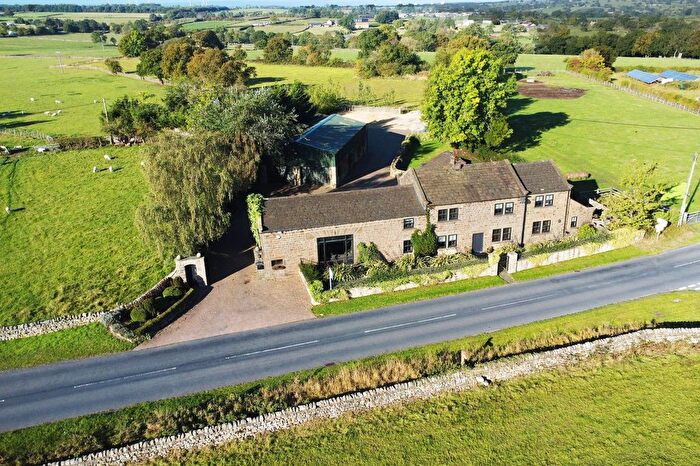
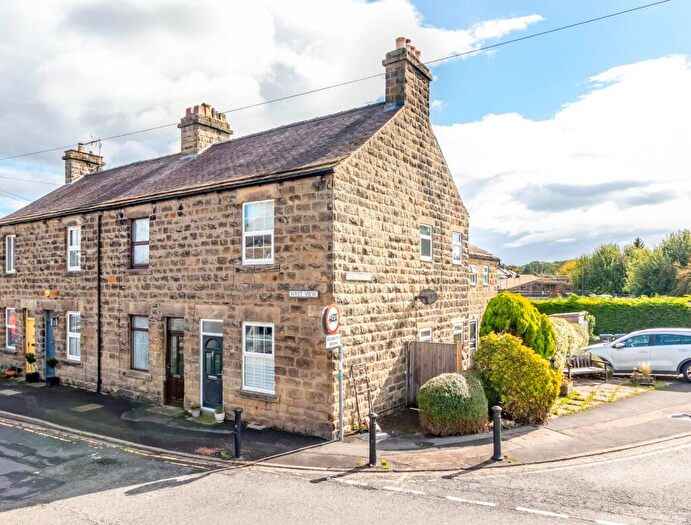
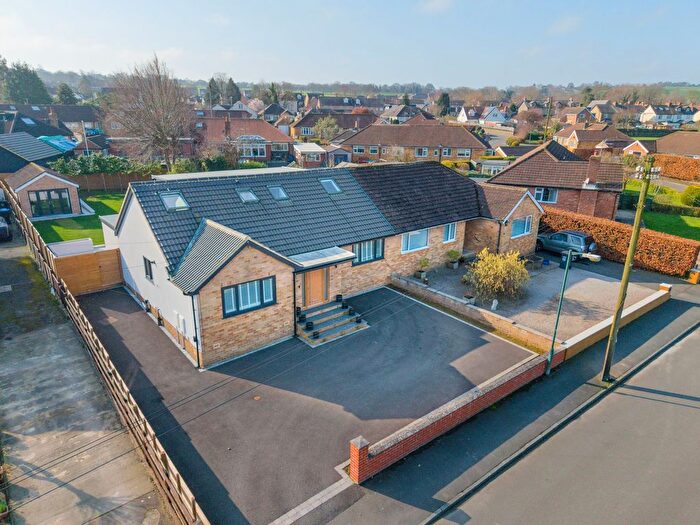
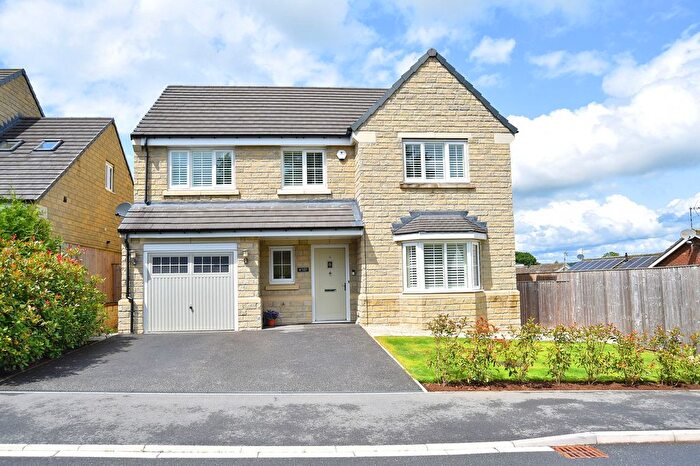
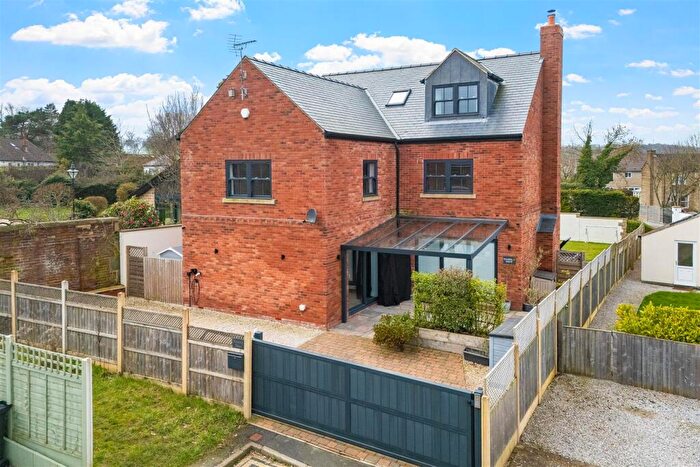
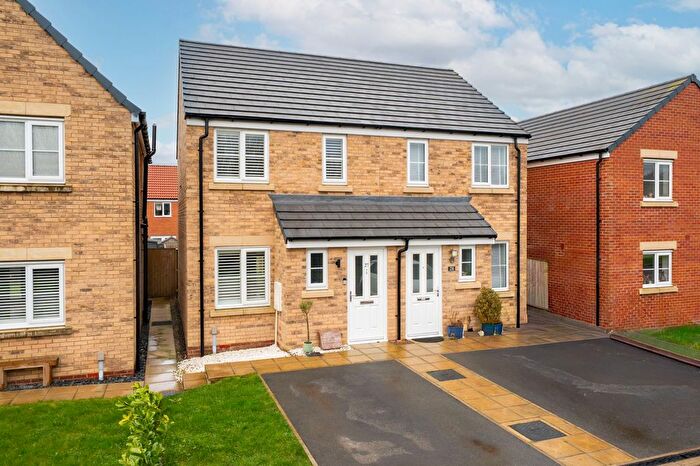
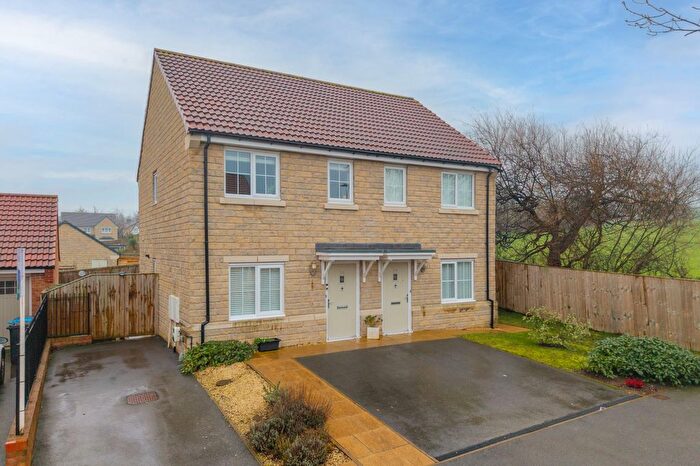
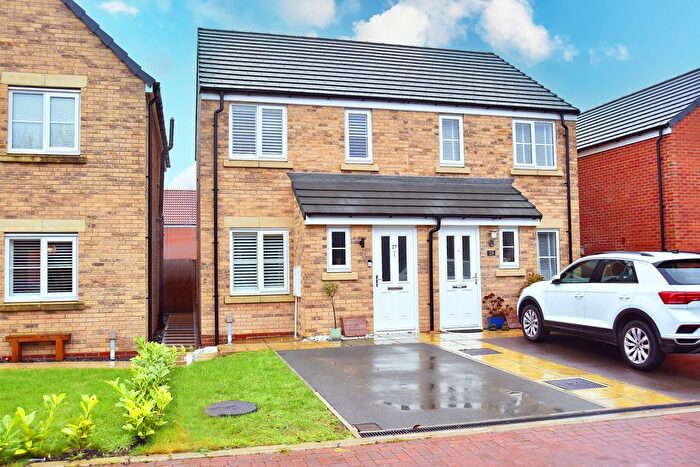
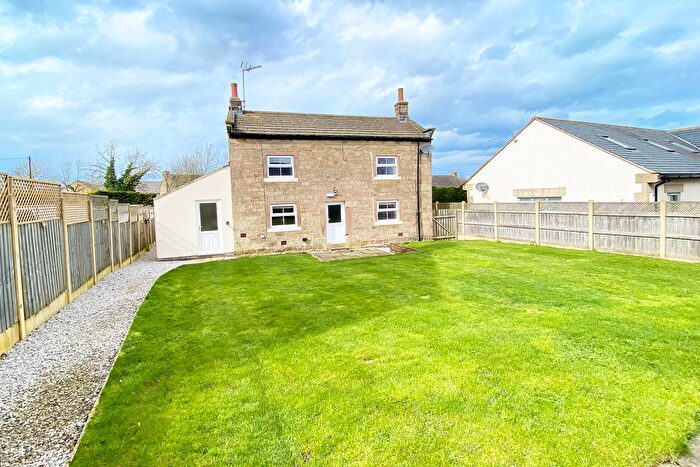
Previously listed properties near HG3 2HA, High Street

![]()
If you are looking to sell your house, let it out, or receive a property valuation, an expert can help you.
Click the button below to get started.
Price Paid in High Street, HG3 2HA, Killinghall
THE OLD PARSONAGE High Street, HG3 2HA, Killinghall Harrogate
Property THE OLD PARSONAGE has been sold 3 times. The last time it was sold was in 09/06/2021 and the sold price was £1,850,000.00.
This detached house, sold as a freehold on 09/06/2021, is a 250 sqm detached house with an EPC rating of E.
| Date | Price | Property Type | Tenure | Classification |
|---|---|---|---|---|
| 09/06/2021 | £1,850,000.00 | Detached House | freehold | Established Building |
| 03/09/2012 | £1,400,000.00 | Detached House | freehold | Established Building |
| 31/08/2005 | £750,000.00 | Detached House | freehold | Established Building |
GRANARY HOUSE High Street, HG3 2HA, Killinghall Harrogate
Property GRANARY HOUSE has been sold 2 times. The last time it was sold was in 14/08/2015 and the sold price was £795,000.00.
This detached house, sold as a freehold on 14/08/2015, is a 165 sqm detached house with an EPC rating of C.
| Date | Price | Property Type | Tenure | Classification |
|---|---|---|---|---|
| 14/08/2015 | £795,000.00 | Detached House | freehold | Established Building |
| 28/01/2000 | £240,160.00 | Detached House | freehold | Established Building |
Postcodes in High Street, Killinghall
Navigate through other locations in High Street, Killinghall, Harrogate to see more property listings for sale or to rent.
Transport near HG3 2HA, High Street

House price paid reports for HG3 2HA, High Street
Click on the buttons below to see price paid reports by year or property price:
- Price Paid By Year
Property Price Paid in HG3 2HA, High Street by Year
The average sold property price by year was:
| Year | Average Sold Price | Price Change |
Sold Properties
|
|---|---|---|---|
| 2021 | £1,850,000 | 57% |
1 Property |
| 2015 | £795,000 | -76% |
1 Property |
| 2012 | £1,400,000 | 46% |
1 Property |
| 2005 | £750,000 | 68% |
1 Property |
| 2000 | £240,160 | - |
1 Property |