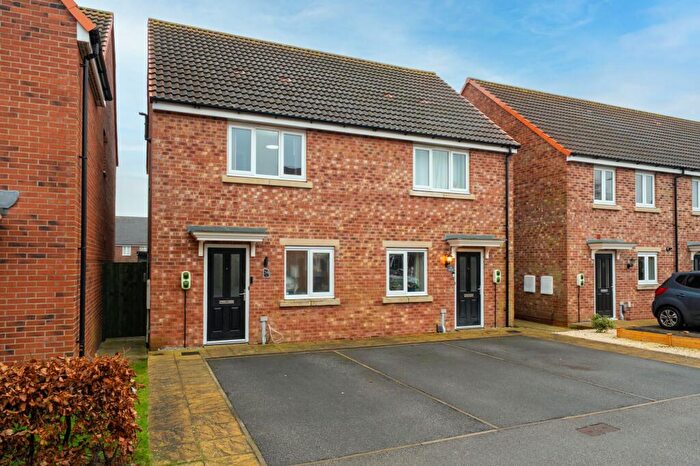
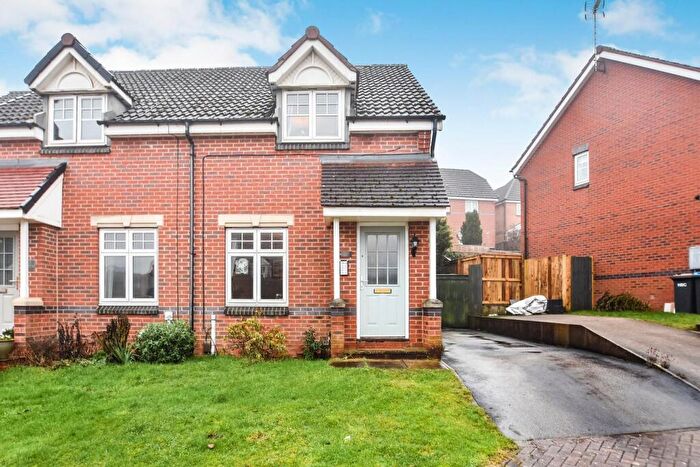
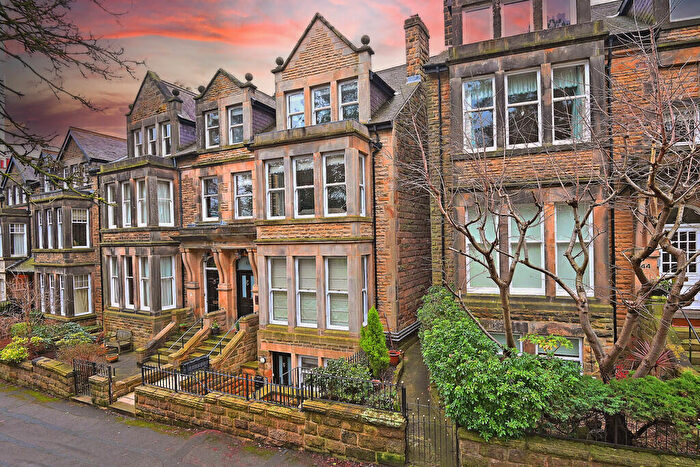
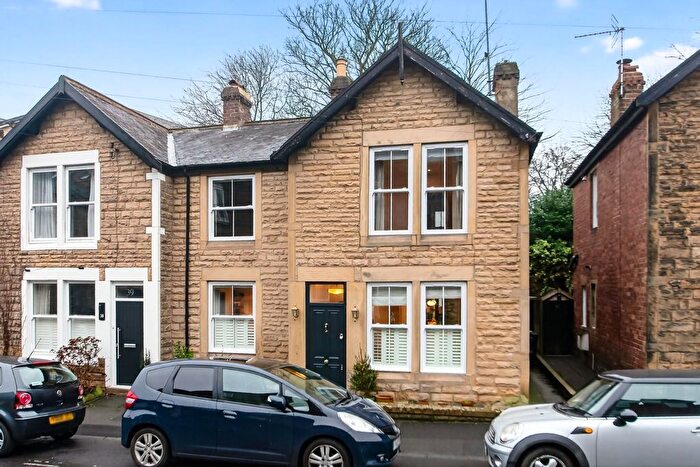
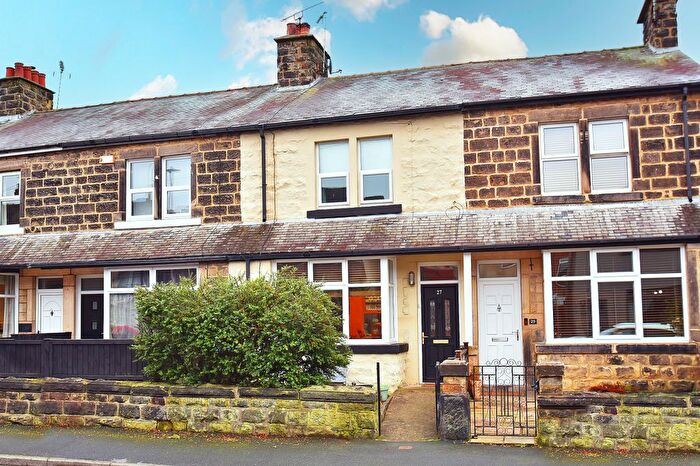
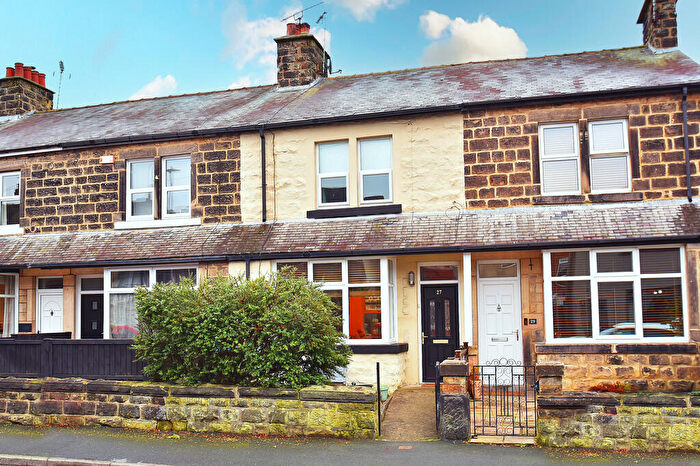
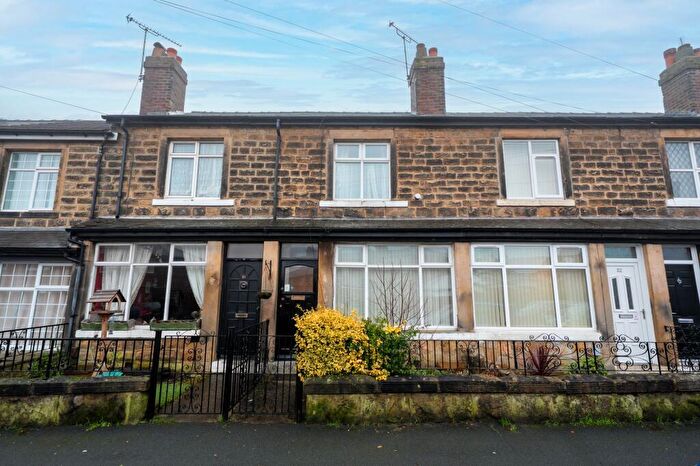
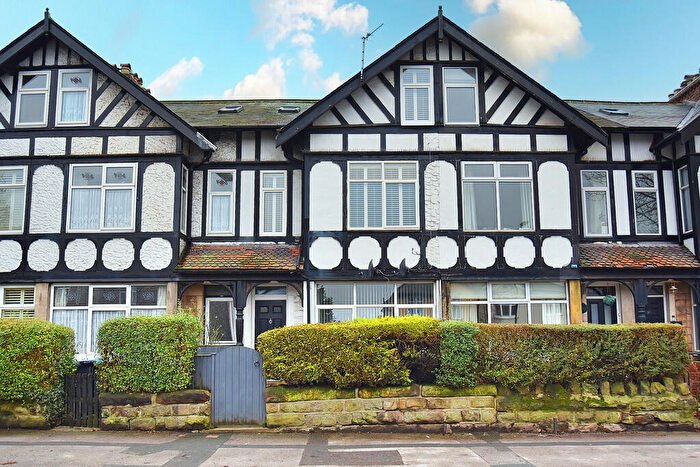
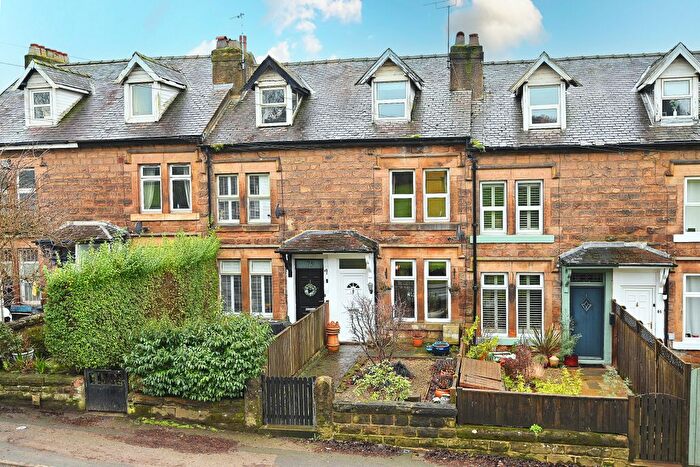
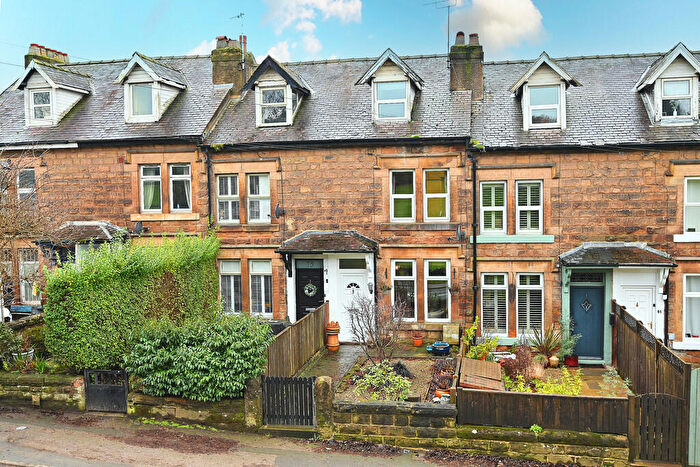
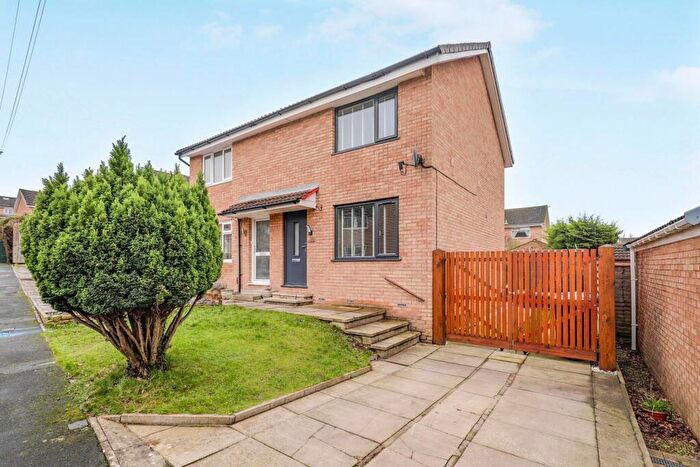
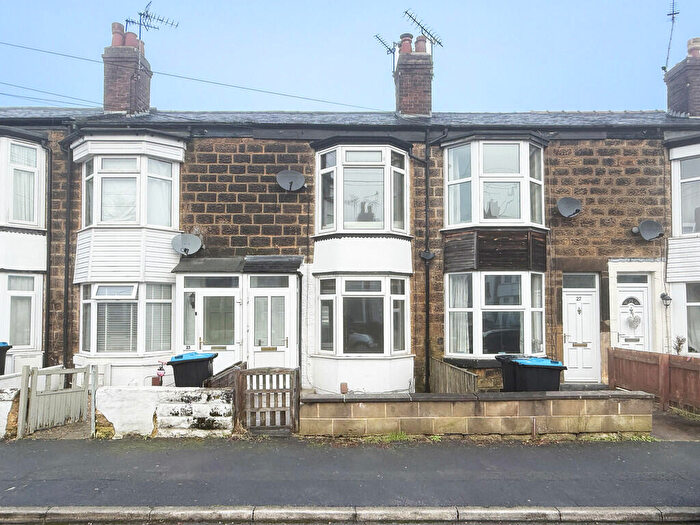
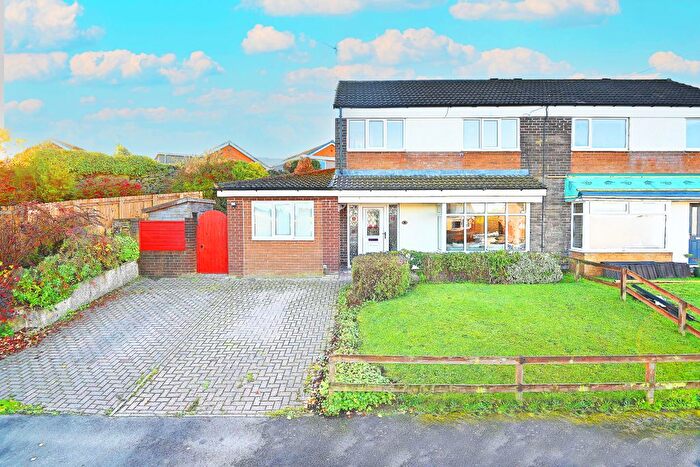
Houses for sale & to rent in Killinghall, Harrogate
House Prices in Killinghall
Properties in Killinghall have an average house price of £440,402.00 and had 128 Property Transactions within the last 3 years¹.
Killinghall is an area in Harrogate, North Yorkshire with 1,166 households², where the most expensive property was sold for £2,210,000.00.
Properties for sale in Killinghall
Roads and Postcodes in Killinghall
Navigate through our locations to find the location of your next house in Killinghall, Harrogate for sale or to rent.
| Streets | Postcodes |
|---|---|
| Addison Villas | HG3 2DD |
| Back Lane | HG3 3AE |
| Brookfield | HG3 2EF |
| Brookfield Close | HG3 2EA |
| Brookfield Crescent | HG3 2EE |
| Brookfield Garth | HG3 2EB |
| Brookfield Way | HG3 2ED |
| Castle Close | HG3 2DX |
| Castle Road | HG3 2DU |
| Cautley Drive | HG3 2DJ |
| Cautley Grove | HG3 2DL |
| Chain Bar Lane | HG3 2BS |
| Chantry Court | HG3 3AD |
| Church Close | HG3 2DT |
| Church Lane | HG3 2DE HG3 2HB |
| Crag Lane | HG3 2BB HG3 2BD |
| Crofters Green | HG3 2GY |
| Cruet Fold | HG3 2HG |
| Dale Close | HG3 2EQ |
| Dawson Court | HG3 2FR |
| Finden Gardens | HG3 2EL HG3 2EN |
| Follet Close | HG3 3DZ |
| Garden Court | HG3 2GN |
| Grainbeck Lane | HG3 2AA |
| Grayston Plain Lane | HG3 2HS |
| Greystones Avenue | HG3 2BJ |
| High Street | HG3 2EP HG3 2ET HG3 2EU HG3 2EZ HG3 2HA |
| Hollins Close | HG3 2EH |
| Hollins Hall | HG3 2GL HG3 2GP |
| Hollins Lane | HG3 2EG HG3 2EJ HG3 2HH HG3 2HJ HG3 2HL |
| Knox Mill Bank | HG3 2AJ |
| Knox Mill Close | HG3 2AG |
| Knox Mill Lane | HG3 2AQ |
| Knox Park | HG3 2AF |
| Levens Close | HG3 2BN |
| Lodge Court | HG3 2WX |
| Lund Lane | HG3 2BG HG3 2BH HG3 2BQ |
| Manor Gardens | HG3 2DS |
| Manor Road | HG3 2DP |
| Meadow Close | HG3 2EX |
| Moor Close | HG3 2DY HG3 2DZ |
| Orchard Lane | HG3 3AT |
| Otley Road | HG3 2AP HG3 2BE HG3 2DN HG3 2DW |
| Park View | HG3 2HN |
| Peckfield Close | HG3 2ES |
| Red Cottages | HG3 3BW |
| Ripon Road | HG3 2AD HG3 2AX HG3 2AY HG3 2BA HG3 2DF HG3 2DG HG3 2DH |
| Rowden Lane | HG3 2ER HG3 2HR |
| Skipton Road | HG3 2AL HG3 2BU HG3 2LZ |
| South View | HG3 3AZ |
| St Thomas A Becket Walk | HG3 2FS |
| Station Cottages | HG3 3BG |
| Town Street | HG3 3BJ |
| West Court | HG3 2WY |
| West View Terrace | HG3 2EY |
| HG3 1SF HG3 3AX HG3 3AY HG3 3BA HG3 3BH HG3 3BN HG3 3BQ HG3 3DN HG3 3EA HG3 3JQ |
Transport near Killinghall
- FAQ
- Price Paid By Year
- Property Type Price
Frequently asked questions about Killinghall
What is the average price for a property for sale in Killinghall?
The average price for a property for sale in Killinghall is £440,402. This amount is 11% higher than the average price in Harrogate. There are 7,661 property listings for sale in Killinghall.
What streets have the most expensive properties for sale in Killinghall?
The streets with the most expensive properties for sale in Killinghall are Otley Road at an average of £770,333, St Thomas A Becket Walk at an average of £725,000 and Town Street at an average of £655,000.
What streets have the most affordable properties for sale in Killinghall?
The streets with the most affordable properties for sale in Killinghall are Cruet Fold at an average of £120,000, Skipton Road at an average of £183,000 and Greystones Avenue at an average of £234,000.
Which train stations are available in or near Killinghall?
Some of the train stations available in or near Killinghall are Harrogate, Starbeck and Hornbeam Park.
Property Price Paid in Killinghall by Year
The average sold property price by year was:
| Year | Average Sold Price | Price Change |
Sold Properties
|
|---|---|---|---|
| 2025 | £431,312 | 5% |
44 Properties |
| 2024 | £409,397 | -22% |
51 Properties |
| 2023 | £500,439 | 7% |
33 Properties |
| 2022 | £464,345 | 12% |
49 Properties |
| 2021 | £407,551 | -1% |
85 Properties |
| 2020 | £411,639 | 8% |
66 Properties |
| 2019 | £378,995 | -4% |
74 Properties |
| 2018 | £394,240 | -8% |
71 Properties |
| 2017 | £427,455 | 3% |
64 Properties |
| 2016 | £415,610 | 18% |
63 Properties |
| 2015 | £341,045 | 2% |
60 Properties |
| 2014 | £334,864 | 5% |
74 Properties |
| 2013 | £316,630 | -2% |
47 Properties |
| 2012 | £323,457 | -26% |
35 Properties |
| 2011 | £407,167 | 15% |
34 Properties |
| 2010 | £344,968 | 8% |
49 Properties |
| 2009 | £316,977 | -14% |
34 Properties |
| 2008 | £360,705 | 7% |
31 Properties |
| 2007 | £334,036 | -3% |
62 Properties |
| 2006 | £343,624 | 6% |
74 Properties |
| 2005 | £322,209 | 16% |
56 Properties |
| 2004 | £270,504 | 11% |
70 Properties |
| 2003 | £241,214 | 23% |
49 Properties |
| 2002 | £185,050 | 9% |
72 Properties |
| 2001 | £168,480 | 10% |
75 Properties |
| 2000 | £151,341 | 10% |
48 Properties |
| 1999 | £136,949 | 21% |
45 Properties |
| 1998 | £108,779 | 8% |
37 Properties |
| 1997 | £99,962 | -2% |
61 Properties |
| 1996 | £102,105 | 4% |
50 Properties |
| 1995 | £98,178 | - |
35 Properties |
Property Price per Property Type in Killinghall
Here you can find historic sold price data in order to help with your property search.
The average Property Paid Price for specific property types in the last three years are:
| Property Type | Average Sold Price | Sold Properties |
|---|---|---|
| Semi Detached House | £365,062.00 | 40 Semi Detached Houses |
| Detached House | £586,405.00 | 55 Detached Houses |
| Terraced House | £287,512.00 | 26 Terraced Houses |
| Flat | £291,631.00 | 7 Flats |

