Houses for sale & to rent in Woodfield, Harrogate
House Prices in Woodfield
Properties in Woodfield have an average house price of £246,628.00 and had 238 Property Transactions within the last 3 years¹.
Woodfield is an area in Harrogate, North Yorkshire with 2,478 households², where the most expensive property was sold for £635,000.00.
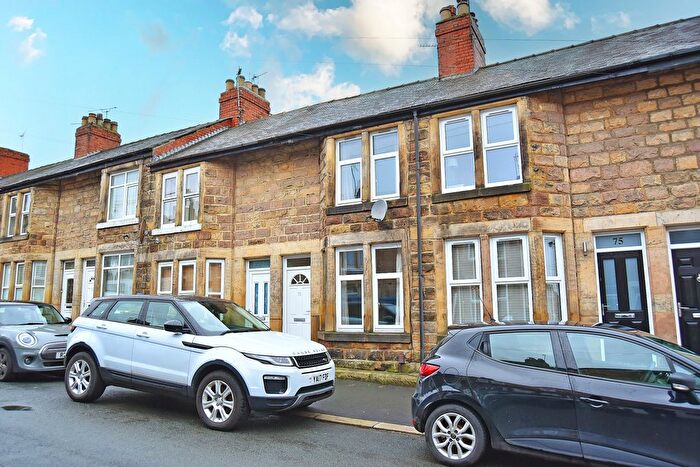
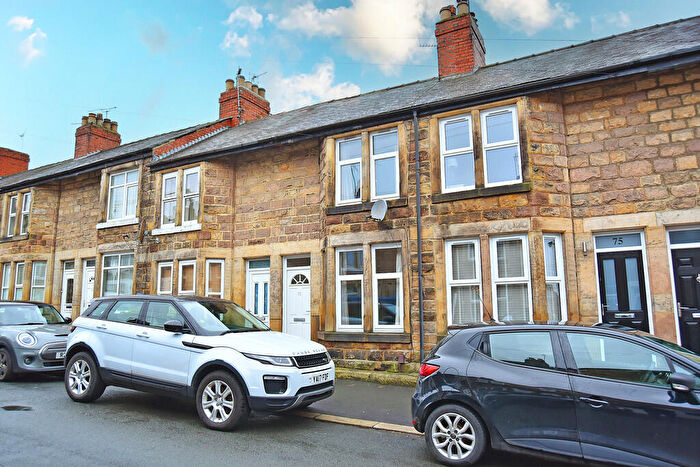
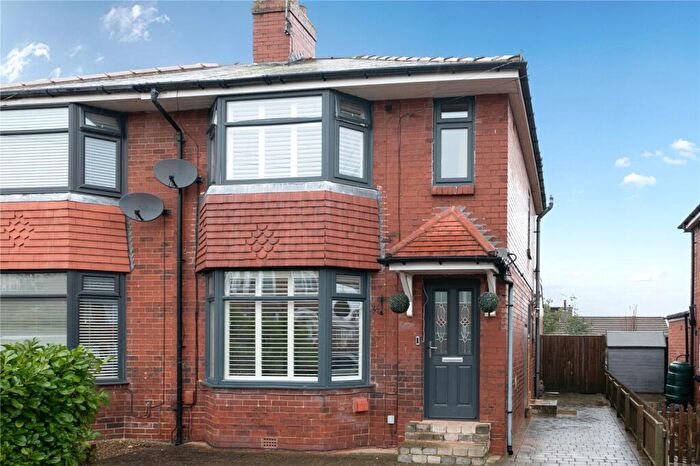
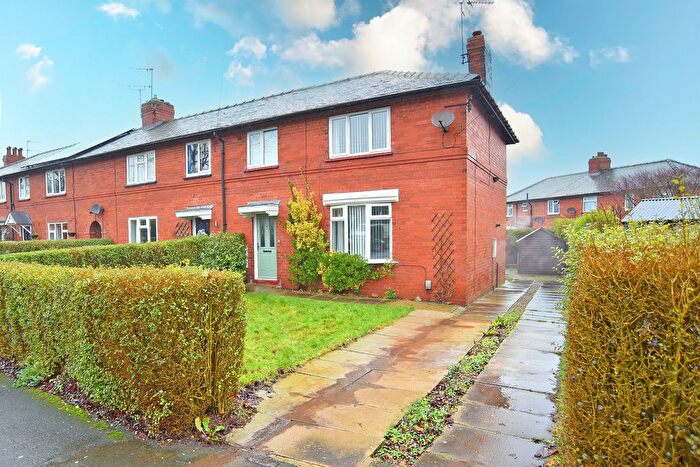
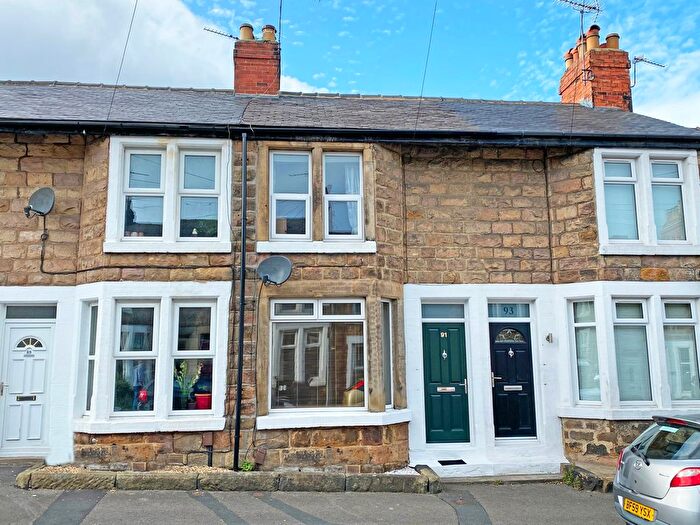
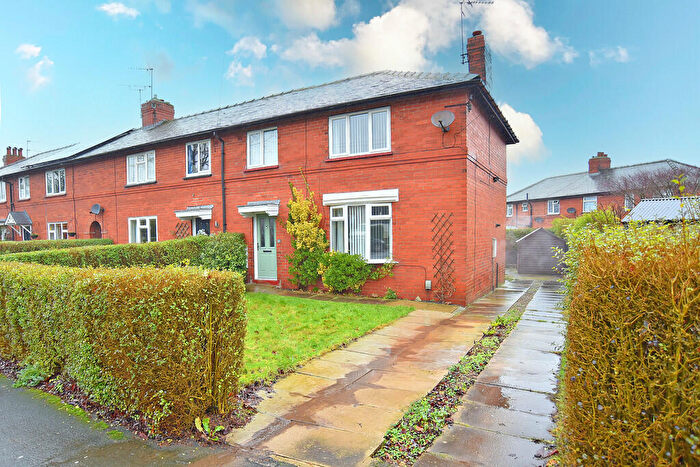
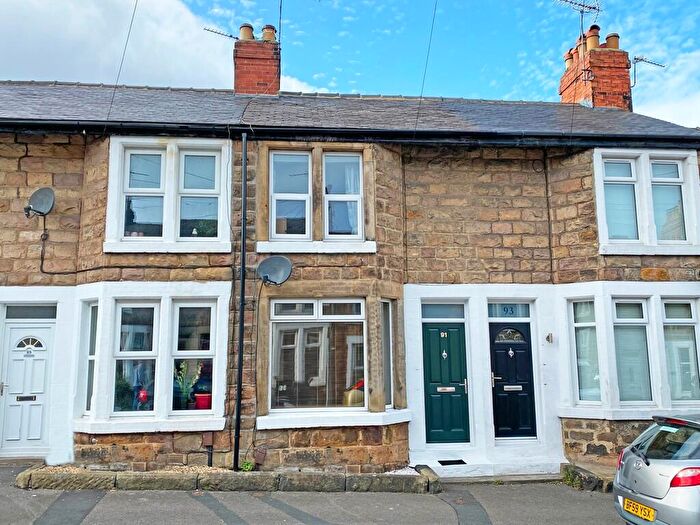
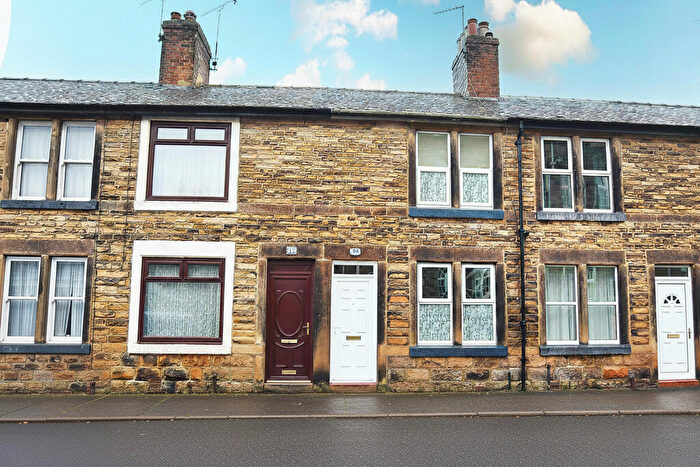
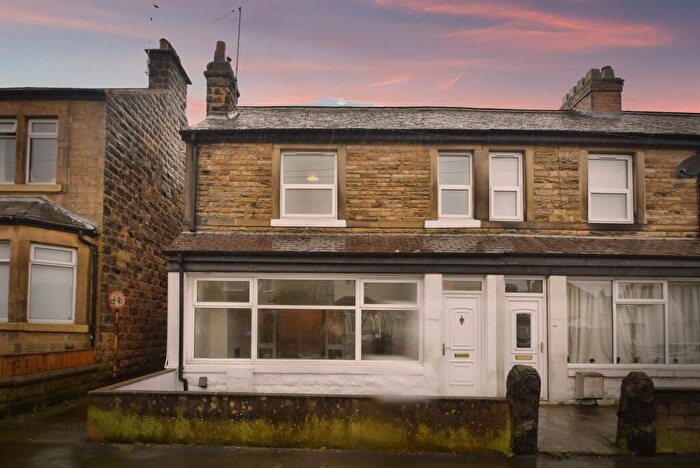
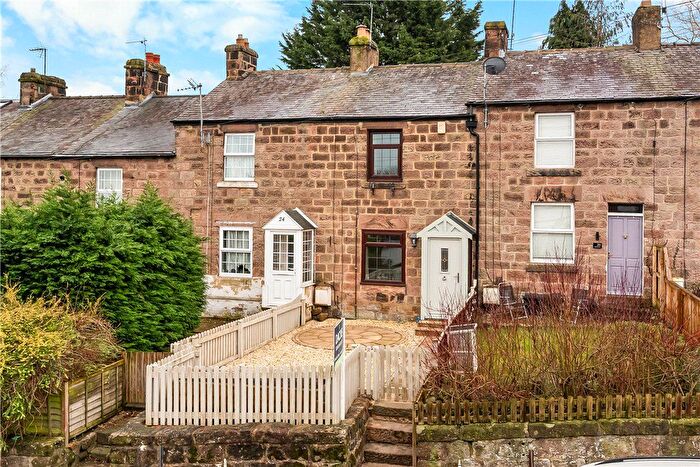
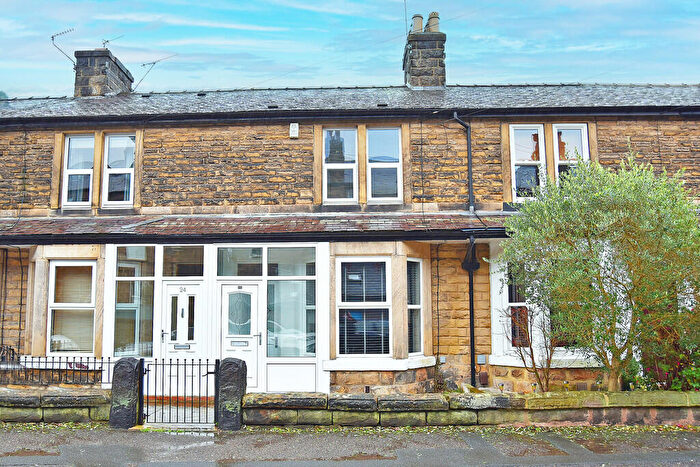
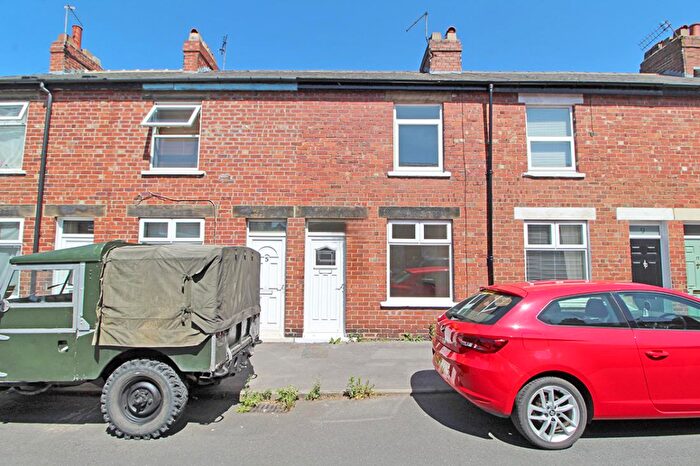
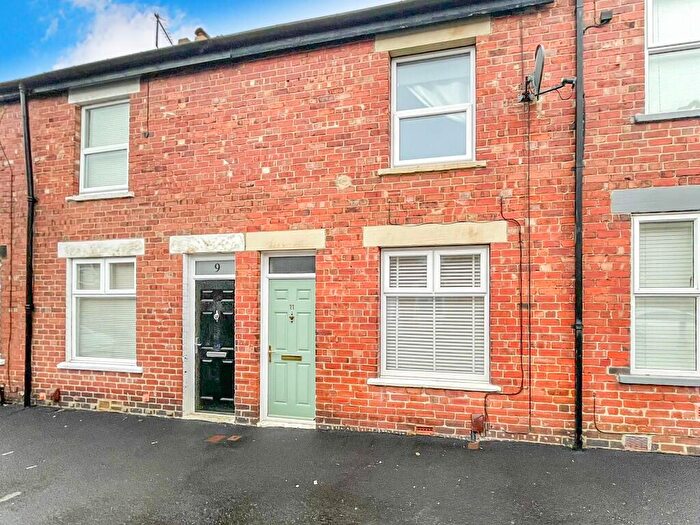
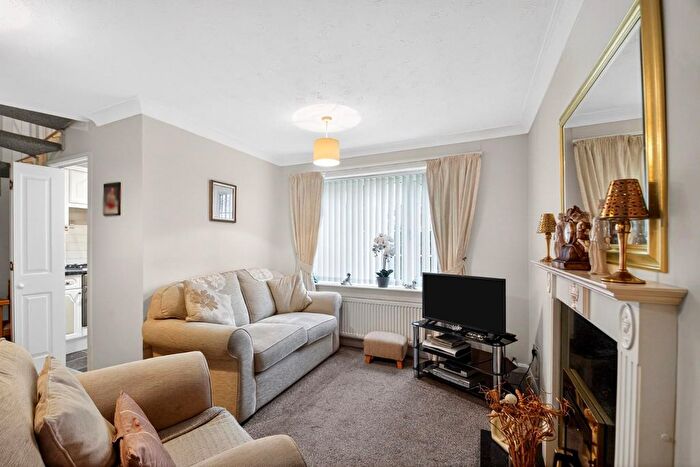
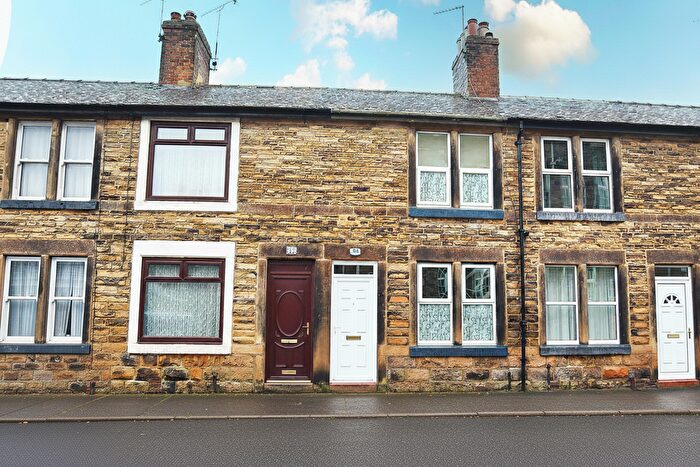
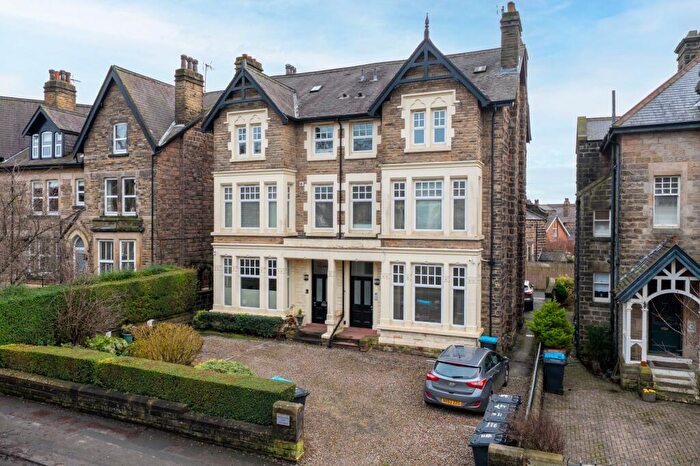
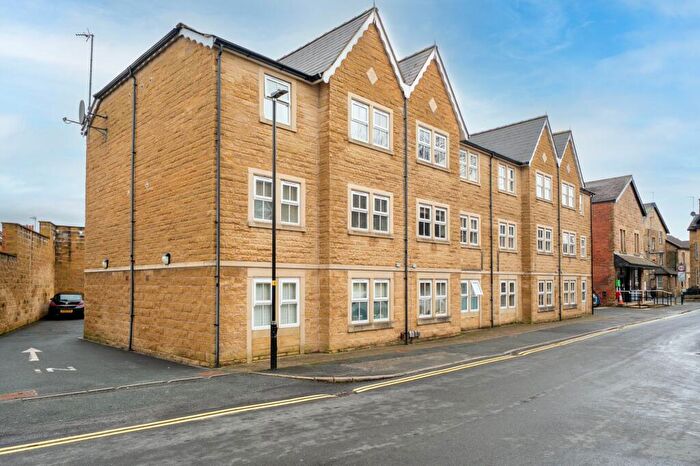
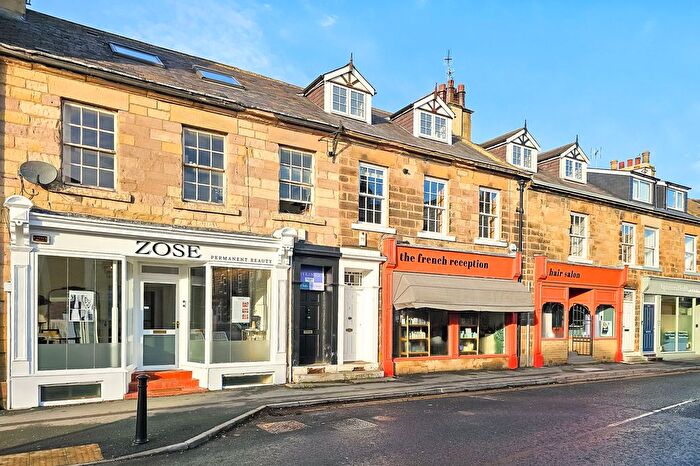
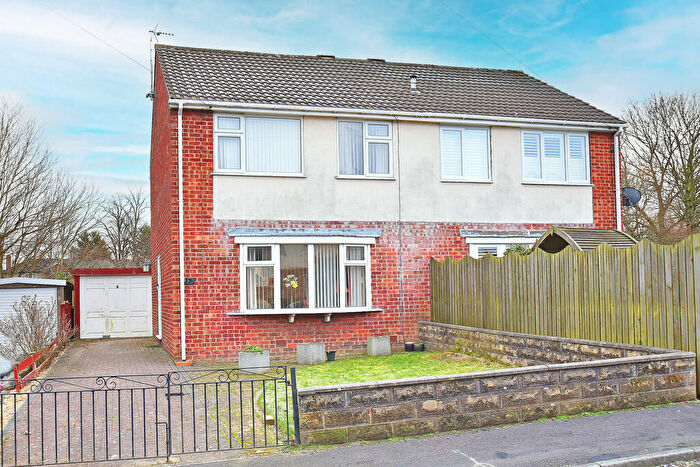
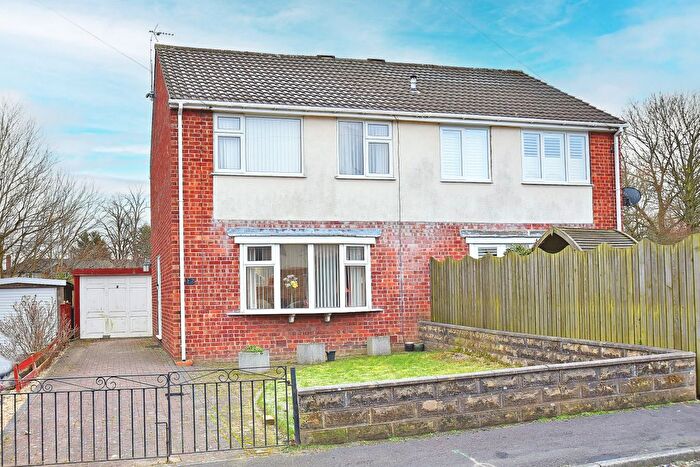
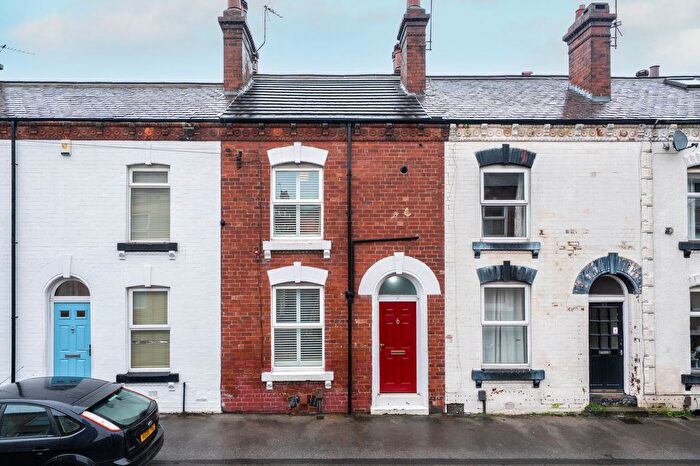
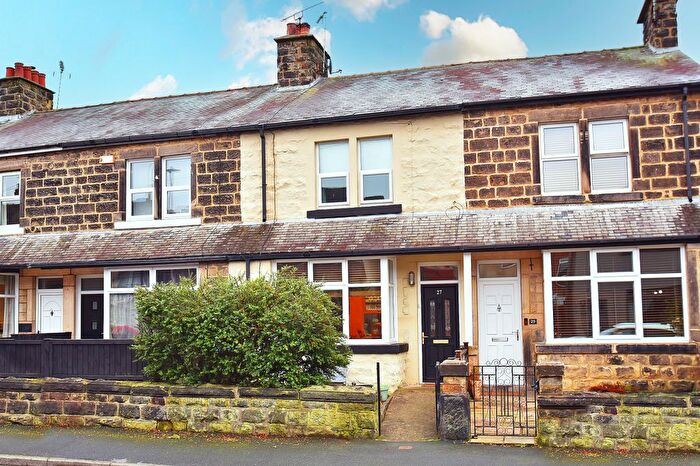
Properties for sale in Woodfield
Roads and Postcodes in Woodfield
Navigate through our locations to find the location of your next house in Woodfield, Harrogate for sale or to rent.
| Streets | Postcodes |
|---|---|
| Albany Avenue | HG1 4NF HG1 4NH |
| Albany Road | HG1 4NS |
| Albert Road | HG1 4HT HG1 4HX |
| Bilton Close | HG1 3DJ |
| Bilton Grove Avenue | HG1 4HJ HG1 4HQ |
| Bilton Lane | HG1 3DG HG1 3DR HG1 3DU HG1 3JX |
| Birch Grove | HG1 4HR |
| Burke Street | HG1 4NR |
| Butler Road | HG1 4PF |
| Byland Grove | HG1 4EU |
| Byland Place | HG1 4EZ |
| Byland Road | HG1 4ET HG1 4EY |
| Cavendish Street | HG1 4NT |
| Cecil Street | HG1 4NP |
| Charles Avenue | HG1 4PE |
| Chestnut Grove | HG1 4HS |
| Church Avenue | HG1 4HE HG1 4HG |
| Church Lane | HG1 2QX |
| Dene Park | HG1 4JU HG1 4JX HG1 4JY |
| Eastby Road | HG1 4EX |
| Elm Road | HG1 4NG |
| Fountains Avenue | HG1 4EP HG1 4ER |
| Grosvenor Road | HG1 4EG |
| King Edwards Drive | HG1 4HA HG1 4HB HG1 4HF HG1 4HL HG1 4HN HG1 4HW |
| Kirkham Grove | HG1 4EW |
| Kirkham Place | HG1 4EN |
| Kirkham Road | HG1 4EL |
| Laburnum Grove | HG1 4EH |
| Lilac Grove | HG1 4EJ |
| Oak Beck Place | HG1 4JT |
| Pine Street | HG1 4NX |
| Poplar Crescent | HG1 4PP |
| Poplar Grove | HG1 4PL HG1 4PN HG1 4PW |
| Poplar Way | HG1 4PR |
| Rawson Street | HG1 4NU |
| Roche Avenue | HG1 4ES |
| Roseway | HG1 4HH |
| Sandhill Close | HG1 4JP |
| Sandhill Drive | HG1 4JL HG1 4JR HG1 4JS HG1 4JW |
| Sandhill Way | HG1 4JN |
| Skipton Road | HG1 4LL HG1 4PS |
| The Square | HG1 5RG |
| Walnut Grove | HG1 4EQ |
| Willow Grove | HG1 4HP |
| Woodfield Avenue | HG1 4LU |
| Woodfield Close | HG1 4ND |
| Woodfield Drive | HG1 4LR HG1 4LS HG1 4LX |
| Woodfield Gardens | HG1 4LT |
| Woodfield Place | HG1 4NA |
| Woodfield Road | HG1 4HZ HG1 4JA HG1 4JB HG1 4JD HG1 4JE HG1 4JF HG1 4JG HG1 4JQ HG1 4LN HG1 4LW |
| Woodfield Square | HG1 4LY |
| Woodfield View | HG1 4NB |
| Woodhall Drive | HG1 4JH |
| Woodhall Grove | HG1 4JJ |
Transport near Woodfield
- FAQ
- Price Paid By Year
- Property Type Price
Frequently asked questions about Woodfield
What is the average price for a property for sale in Woodfield?
The average price for a property for sale in Woodfield is £246,628. This amount is 38% lower than the average price in Harrogate. There are 2,437 property listings for sale in Woodfield.
What streets have the most expensive properties for sale in Woodfield?
The streets with the most expensive properties for sale in Woodfield are Walnut Grove at an average of £467,500, Bilton Lane at an average of £393,000 and Bilton Grove Avenue at an average of £359,050.
What streets have the most affordable properties for sale in Woodfield?
The streets with the most affordable properties for sale in Woodfield are Byland Grove at an average of £160,000, Birch Grove at an average of £164,714 and Woodfield Drive at an average of £164,859.
Which train stations are available in or near Woodfield?
Some of the train stations available in or near Woodfield are Harrogate, Starbeck and Hornbeam Park.
Property Price Paid in Woodfield by Year
The average sold property price by year was:
| Year | Average Sold Price | Price Change |
Sold Properties
|
|---|---|---|---|
| 2025 | £263,343 | 4% |
63 Properties |
| 2024 | £252,033 | 10% |
94 Properties |
| 2023 | £227,356 | -13% |
81 Properties |
| 2022 | £256,281 | 11% |
91 Properties |
| 2021 | £227,848 | 6% |
136 Properties |
| 2020 | £214,733 | -2% |
69 Properties |
| 2019 | £219,923 | 8% |
86 Properties |
| 2018 | £203,223 | -1% |
105 Properties |
| 2017 | £205,921 | 4% |
96 Properties |
| 2016 | £197,291 | 3% |
98 Properties |
| 2015 | £192,072 | 6% |
109 Properties |
| 2014 | £181,138 | 9% |
110 Properties |
| 2013 | £165,403 | 1% |
104 Properties |
| 2012 | £164,465 | 5% |
81 Properties |
| 2011 | £155,437 | -9% |
75 Properties |
| 2010 | £169,340 | 11% |
84 Properties |
| 2009 | £150,115 | -18% |
74 Properties |
| 2008 | £177,060 | -6% |
56 Properties |
| 2007 | £187,222 | 17% |
135 Properties |
| 2006 | £155,722 | 6% |
162 Properties |
| 2005 | £146,041 | 4% |
109 Properties |
| 2004 | £139,905 | 17% |
146 Properties |
| 2003 | £116,342 | 18% |
116 Properties |
| 2002 | £94,902 | 16% |
124 Properties |
| 2001 | £79,413 | 15% |
134 Properties |
| 2000 | £67,126 | 9% |
108 Properties |
| 1999 | £60,882 | 13% |
89 Properties |
| 1998 | £53,106 | 5% |
72 Properties |
| 1997 | £50,201 | 7% |
120 Properties |
| 1996 | £46,869 | -1% |
95 Properties |
| 1995 | £47,159 | - |
61 Properties |
Property Price per Property Type in Woodfield
Here you can find historic sold price data in order to help with your property search.
The average Property Paid Price for specific property types in the last three years are:
| Property Type | Average Sold Price | Sold Properties |
|---|---|---|
| Semi Detached House | £274,748.00 | 105 Semi Detached Houses |
| Detached House | £341,875.00 | 8 Detached Houses |
| Terraced House | £226,367.00 | 113 Terraced Houses |
| Flat | £127,875.00 | 12 Flats |

