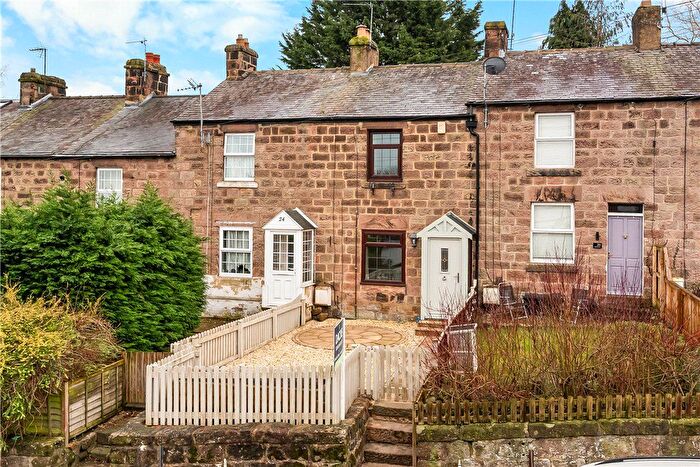
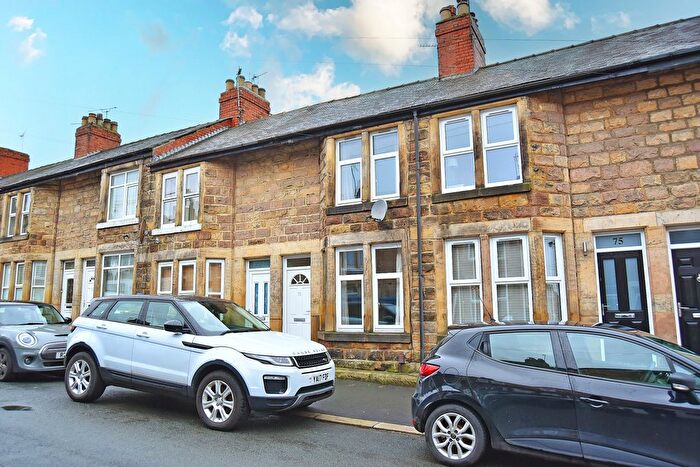
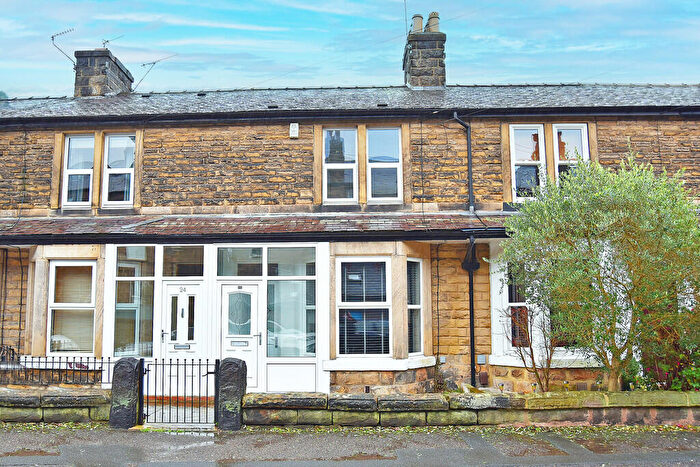
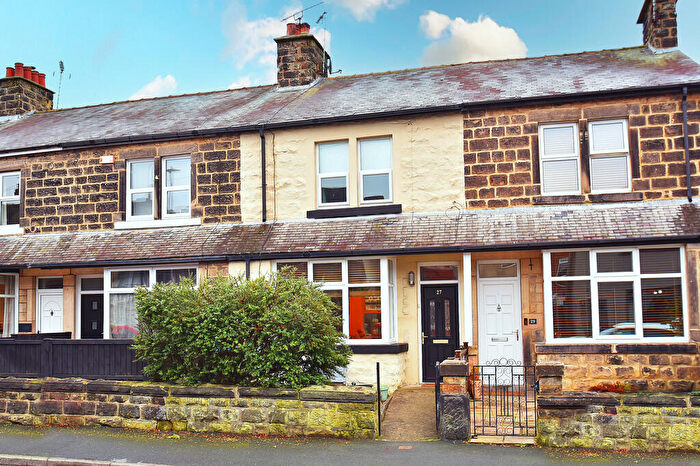
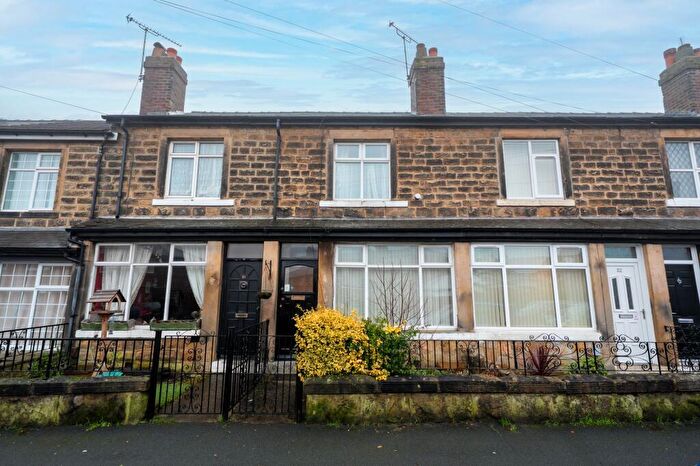
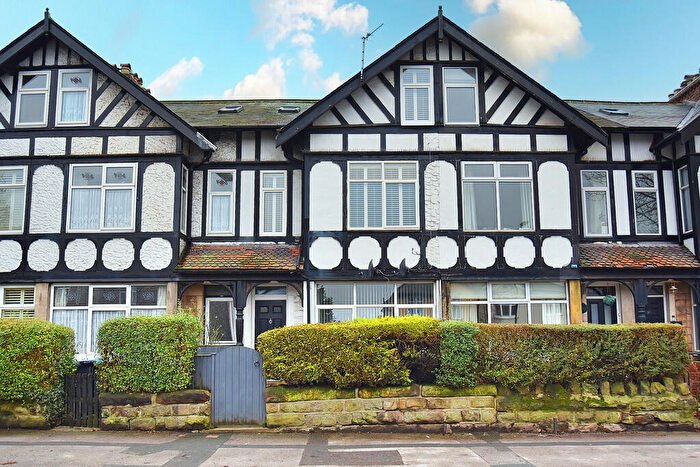
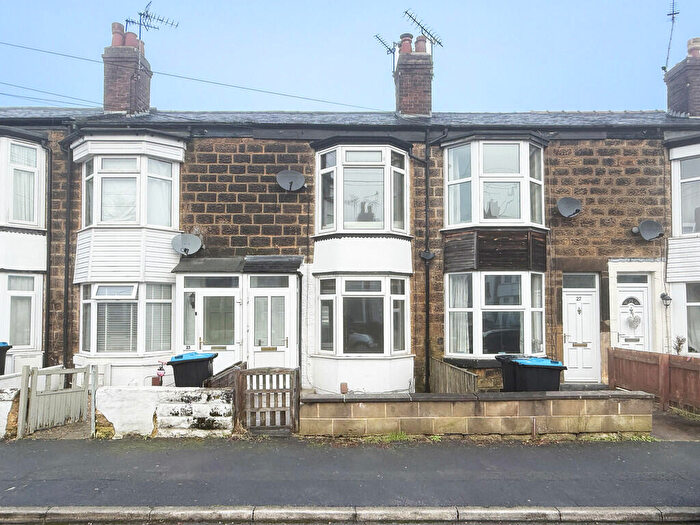
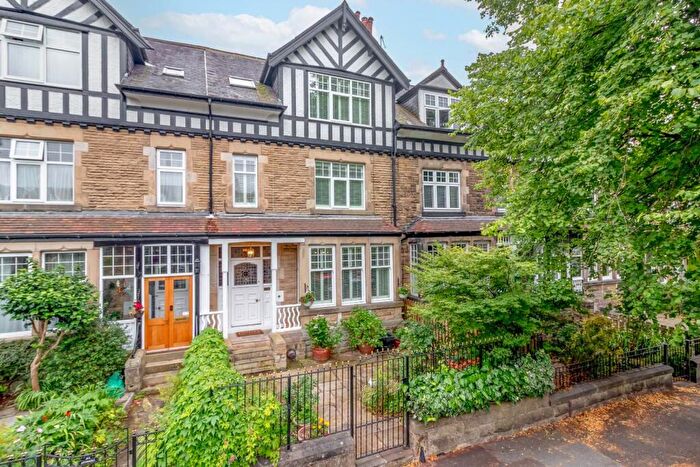
Houses for sale & to rent in Bilton, Harrogate
House Prices in Bilton
Properties in Bilton have an average house price of £290,137.00 and had 216 Property Transactions within the last 3 years¹.
Bilton is an area in Harrogate, North Yorkshire with 2,244 households², where the most expensive property was sold for £640,000.00.
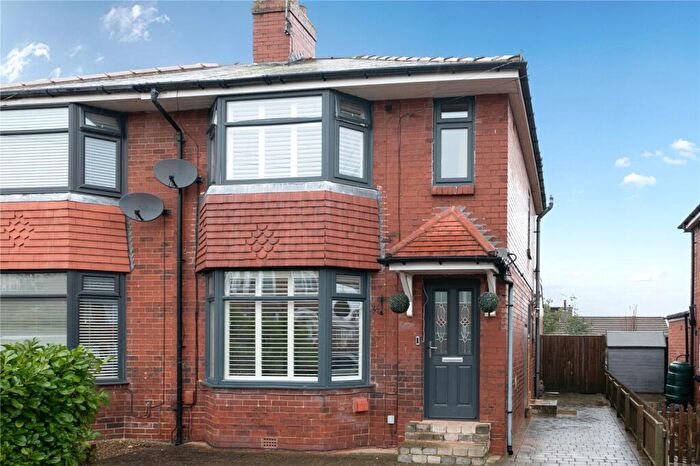
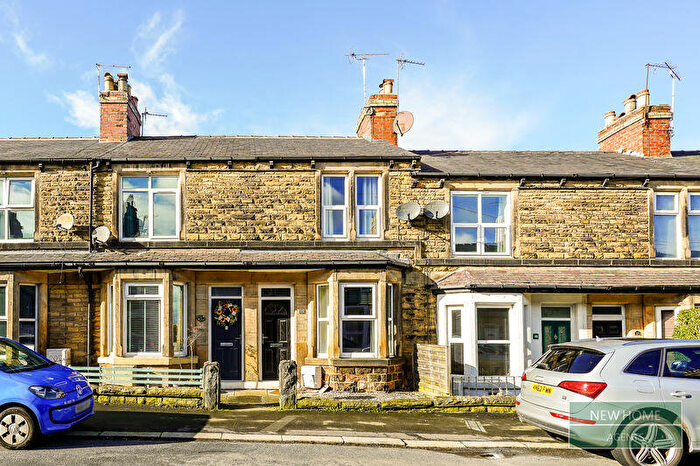
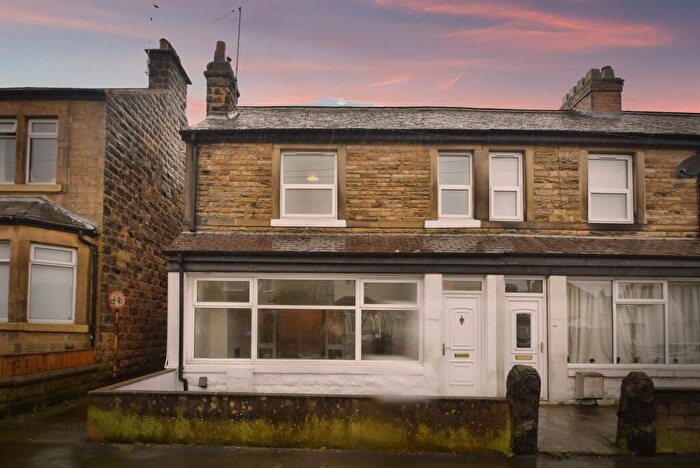
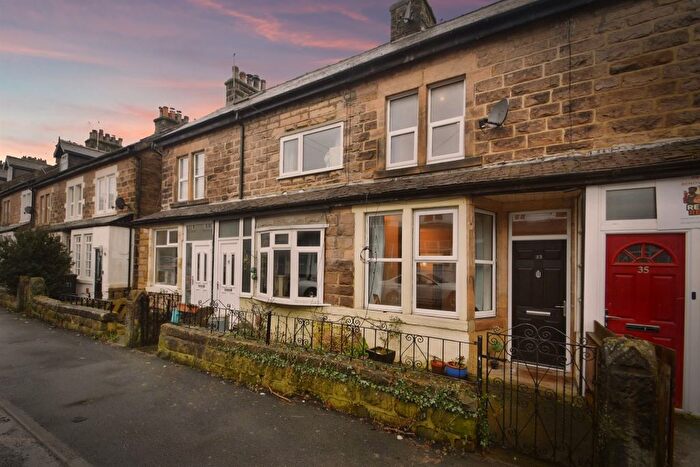
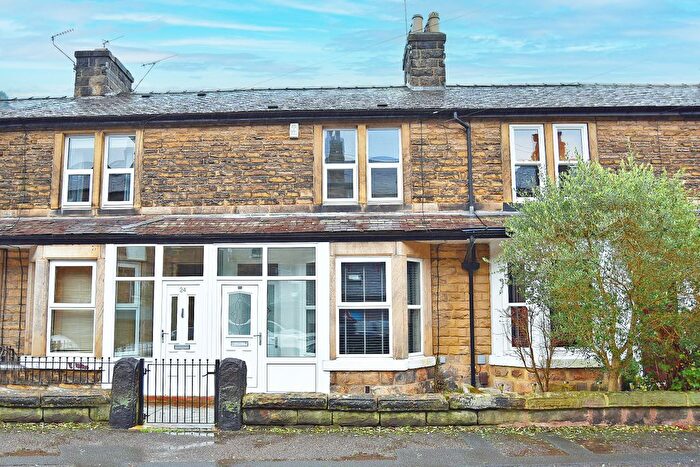
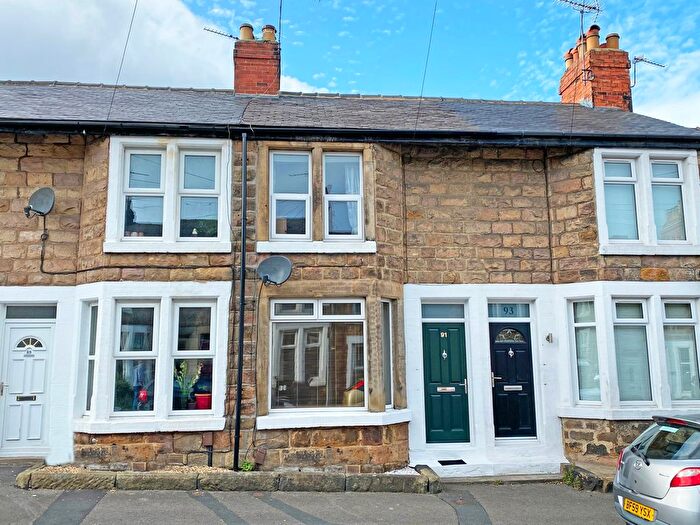
Properties for sale in Bilton
Roads and Postcodes in Bilton
Navigate through our locations to find the location of your next house in Bilton, Harrogate for sale or to rent.
| Streets | Postcodes |
|---|---|
| Bachelor Drive | HG1 3EH |
| Bachelor Gardens | HG1 3EA HG1 3EE HG1 3EL |
| Bachelor Road | HG1 3EQ |
| Bachelor Way | HG1 3EJ |
| Bar Place | HG1 2BA |
| Bilton Lane | HG1 3DP HG1 3DQ HG1 3DT HG1 3JU HG1 4DH HG1 4DJ HG1 4DN |
| Brooke Close | HG1 3ND |
| Burns Way | HG1 3NA |
| Chaucer Green | HG1 3LW |
| Coleridge Drive | HG1 3LS |
| Crab Apple Close | HG1 3AZ |
| Crab Lane | HG1 3BD HG1 3BE HG1 3BG HG1 3BQ |
| Dryden Close | HG1 3LP |
| Elm Tree Avenue | HG1 3DS |
| Fieldway | HG1 3JZ |
| Fieldway Close | HG1 3JS |
| Gordon Avenue | HG1 3DH |
| Hall Lane | HG1 3BN HG1 3DX HG1 3DZ |
| Hill Top Avenue | HG1 3BH HG1 3BJ HG1 3BS |
| Hill Top Close | HG1 3BY |
| Hill Top Crescent | HG1 3BZ |
| Hill Top Drive | HG1 3BU |
| Hill Top Grove | HG1 3BP |
| Hill Top Mount | HG1 3BL |
| Hill Top Rise | HG1 3BW |
| Hill Top Road | HG1 3AN |
| Hill Top Walk | HG1 3BT HG1 3BX |
| Keats Walk | HG1 3LN |
| Knox Close | HG1 3EG |
| Knox Lane | HG1 3AP HG1 3AS HG1 3DA |
| Knox Road | HG1 3EF |
| Marvell Rise | HG1 3LT |
| Masefield Close | HG1 3LU |
| Meadow Croft | HG1 3JY HG1 3LH |
| Meadow Drive | HG1 3LD |
| Meadow Gate | HG1 3LJ |
| Meadow Rise | HG1 3LQ |
| Meadow View | HG1 3LL |
| Meadow Way | HG1 3LG |
| Mill Gate | HG1 3DD |
| Milton Close | HG1 3NB |
| Old Barber | HG1 3DF |
| Old Trough Way | HG1 3DE |
| Over Nidd | HG1 3DB |
| Pecketts Holt | HG1 3DY |
| Pecketts Way | HG1 3EW |
| Redhill Close | HG1 3JG |
| Roberts Crescent | HG1 2AY |
| Roberts Square | HG1 2AZ |
| Sedley Close | HG1 3LB |
| Shelley Court | HG1 3LR |
| Skipton Road | HG1 3EX HG1 3EZ |
| Spencers Holt | HG1 3DL |
| Spencers Way | HG1 3DN |
| St Johns Crescent | HG1 3AB HG1 3AD |
| St Johns Drive | HG1 3AG |
| St Johns Grove | HG1 3AQ |
| St Johns Road | HG1 3AA HG1 3AE |
| St Johns Walk | HG1 3AJ |
| St Johns Way | HG1 3AL |
| Swinburne Close | HG1 3LX |
| Tennyson Avenue | HG1 3LE HG1 3LF |
| Wainfleet Road | HG1 3ED |
| Warren Place | HG1 3BB |
Transport near Bilton
- FAQ
- Price Paid By Year
- Property Type Price
Frequently asked questions about Bilton
What is the average price for a property for sale in Bilton?
The average price for a property for sale in Bilton is £290,137. This amount is 27% lower than the average price in Harrogate. There are 2,251 property listings for sale in Bilton.
What streets have the most expensive properties for sale in Bilton?
The streets with the most expensive properties for sale in Bilton are Spencers Way at an average of £533,750, Brooke Close at an average of £520,000 and Burns Way at an average of £485,000.
What streets have the most affordable properties for sale in Bilton?
The streets with the most affordable properties for sale in Bilton are Roberts Crescent at an average of £199,166, Roberts Square at an average of £200,000 and St Johns Way at an average of £216,350.
Which train stations are available in or near Bilton?
Some of the train stations available in or near Bilton are Harrogate, Starbeck and Hornbeam Park.
Property Price Paid in Bilton by Year
The average sold property price by year was:
| Year | Average Sold Price | Price Change |
Sold Properties
|
|---|---|---|---|
| 2025 | £296,234 | 5% |
53 Properties |
| 2024 | £282,209 | -5% |
87 Properties |
| 2023 | £294,960 | -7% |
76 Properties |
| 2022 | £316,128 | 17% |
81 Properties |
| 2021 | £261,496 | 0,5% |
125 Properties |
| 2020 | £260,297 | -1% |
72 Properties |
| 2019 | £262,029 | -0,2% |
68 Properties |
| 2018 | £262,493 | 4% |
83 Properties |
| 2017 | £251,855 | 2% |
94 Properties |
| 2016 | £246,410 | 3% |
104 Properties |
| 2015 | £238,187 | 9% |
112 Properties |
| 2014 | £216,117 | 5% |
107 Properties |
| 2013 | £205,835 | 1% |
82 Properties |
| 2012 | £202,897 | 2% |
65 Properties |
| 2011 | £199,325 | -1% |
63 Properties |
| 2010 | £201,552 | -5% |
73 Properties |
| 2009 | £210,734 | 5% |
86 Properties |
| 2008 | £200,226 | -2% |
50 Properties |
| 2007 | £204,715 | 2% |
115 Properties |
| 2006 | £200,512 | -0,2% |
159 Properties |
| 2005 | £200,827 | 17% |
101 Properties |
| 2004 | £165,823 | 2% |
118 Properties |
| 2003 | £161,870 | 17% |
125 Properties |
| 2002 | £133,781 | 23% |
110 Properties |
| 2001 | £102,706 | 7% |
128 Properties |
| 2000 | £95,565 | 6% |
107 Properties |
| 1999 | £90,198 | 13% |
108 Properties |
| 1998 | £78,349 | 2% |
93 Properties |
| 1997 | £76,500 | 12% |
139 Properties |
| 1996 | £67,450 | 8% |
120 Properties |
| 1995 | £62,373 | - |
82 Properties |
Property Price per Property Type in Bilton
Here you can find historic sold price data in order to help with your property search.
The average Property Paid Price for specific property types in the last three years are:
| Property Type | Average Sold Price | Sold Properties |
|---|---|---|
| Semi Detached House | £258,167.00 | 124 Semi Detached Houses |
| Detached House | £396,632.00 | 56 Detached Houses |
| Terraced House | £238,015.00 | 35 Terraced Houses |
| Flat | £115,000.00 | 1 Flat |

