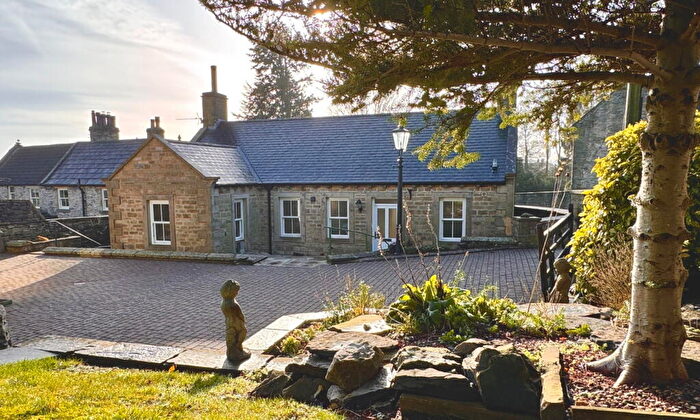
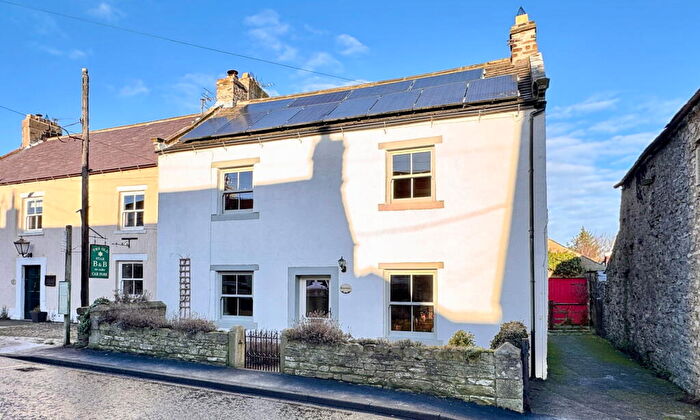
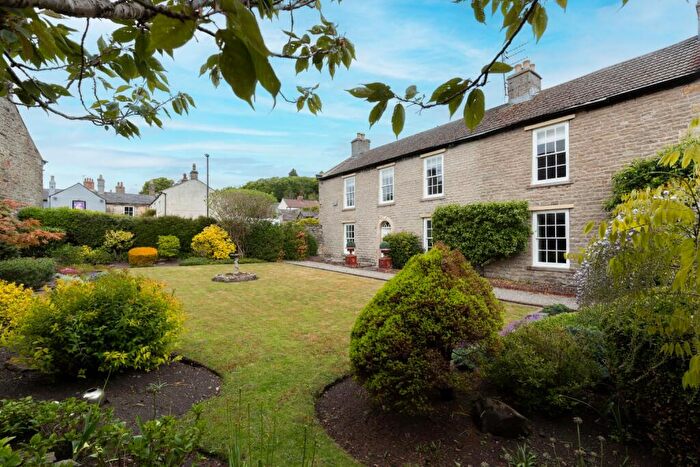
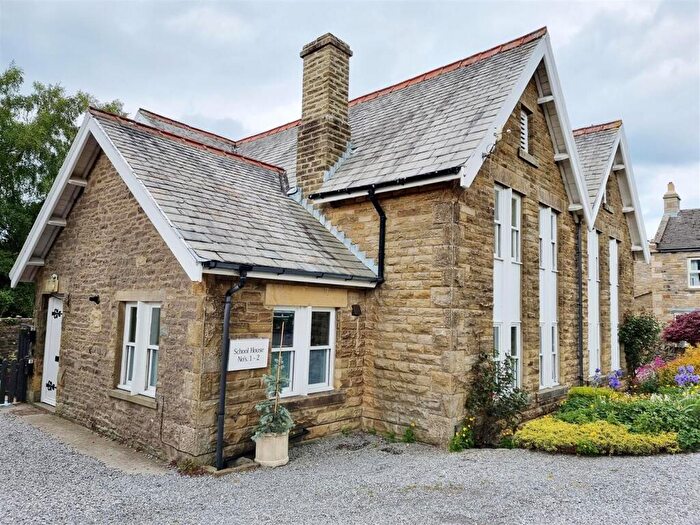
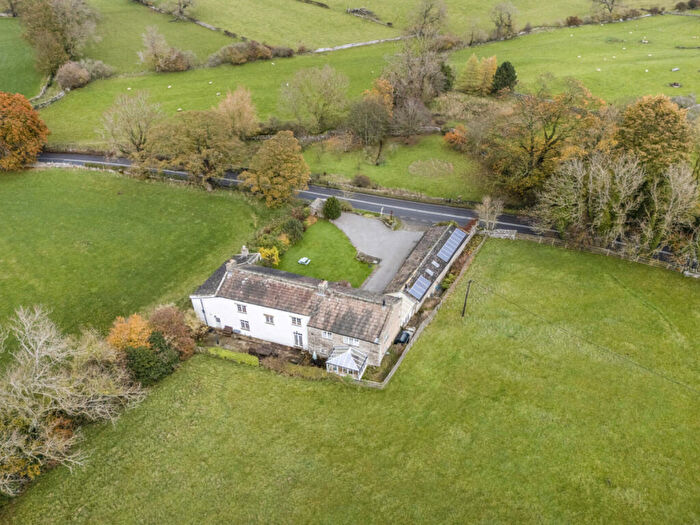
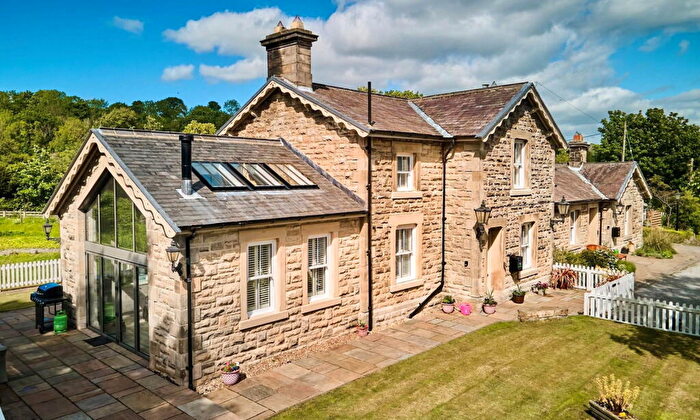
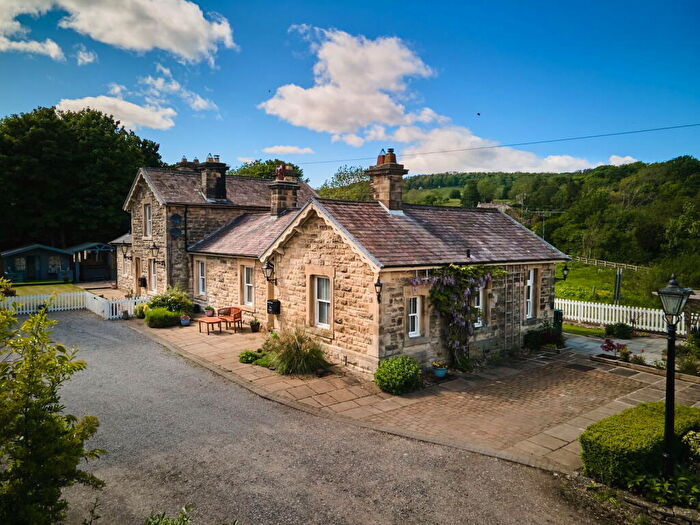
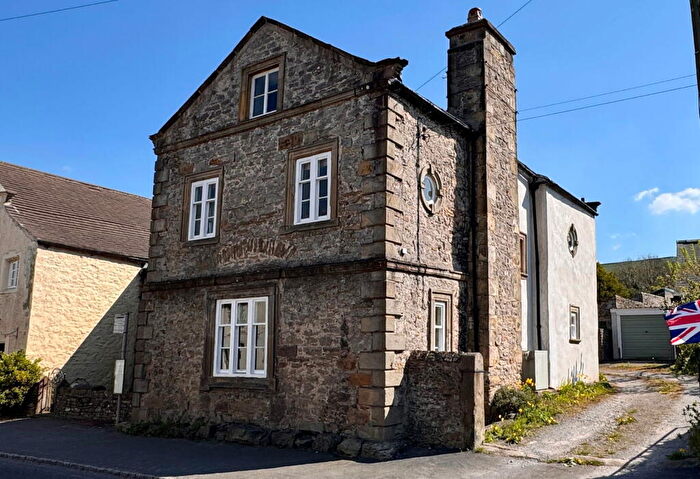
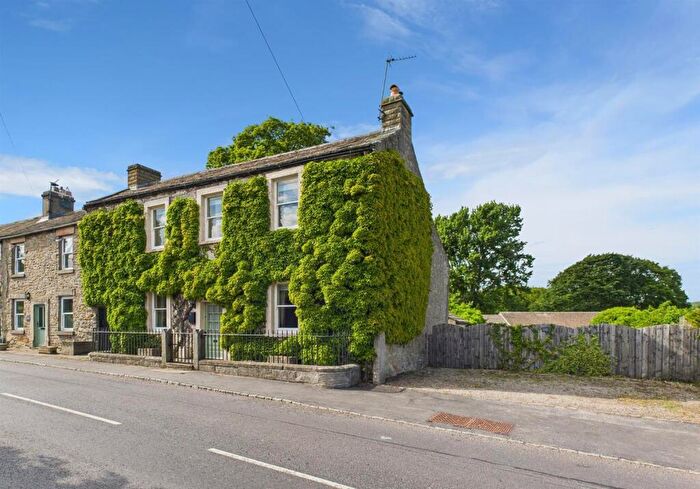
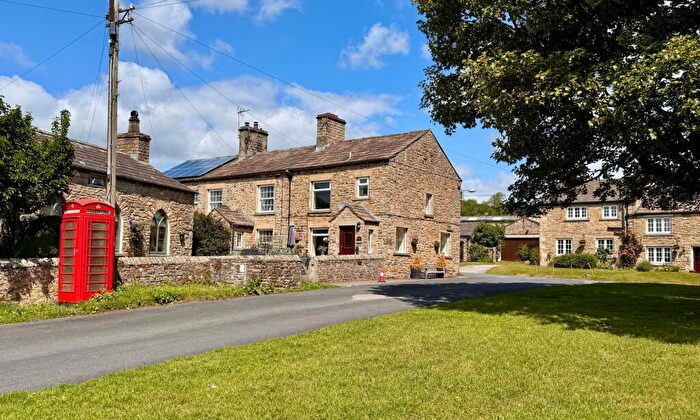
Houses for sale & to rent in Bolton Castle, Leyburn
House Prices in Bolton Castle
Properties in Bolton Castle have an average house price of £413,591.00 and had 46 Property Transactions within the last 3 years¹.
Bolton Castle is an area in Leyburn, North Yorkshire with 505 households², where the most expensive property was sold for £830,000.00.
Properties for sale in Bolton Castle
Roads and Postcodes in Bolton Castle
Navigate through our locations to find the location of your next house in Bolton Castle, Leyburn for sale or to rent.
| Streets | Postcodes |
|---|---|
| Belle Vue Terrace | DL8 5QL |
| Church Close | DL8 4HF |
| Church Street | DL8 5QG |
| Garth Gardens | DL8 4EB |
| Hargill Court | DL8 4HE |
| Hargill Drive | DL8 4DZ |
| Hargill Road | DL8 4ER |
| Herontree Close | DL8 5QZ |
| Low Lane | DL8 4HU |
| Moor Road | DL8 4AT DL8 5QU DL8 5QX DL8 5QY |
| Needham Garth | DL8 4DU |
| Preston Garth | DL8 4AS |
| Railway Cottages | DL8 4AE |
| St Johns View | DL8 5QQ |
| Studdah Close | DL8 5RB |
| The Olde Wynd | DL8 5QJ |
| The Terrace | DL8 5QR |
| Well Lane | DL8 4DY |
| Wensley Station | DL8 4AG |
| West Row | DL8 4AL |
| DL8 4AB DL8 4AH DL8 4AJ DL8 4AN DL8 4AP DL8 4AQ DL8 4DA DL8 4DB DL8 4DD DL8 4DE DL8 4DF DL8 4DG DL8 4DH DL8 4DJ DL8 4DQ DL8 4DR DL8 4EA DL8 4ED DL8 4EE DL8 4EH DL8 4EJ DL8 4EL DL8 4EQ DL8 4ES DL8 4ET DL8 4EU DL8 4EW DL8 4EX DL8 4HA DL8 4HJ DL8 4HL DL8 4HS DL8 4NL DL8 5JU DL8 5QH DL8 5QN DL8 5QP DL8 5QS DL8 5QT DL8 5QW |
Transport near Bolton Castle
- FAQ
- Price Paid By Year
- Property Type Price
Frequently asked questions about Bolton Castle
What is the average price for a property for sale in Bolton Castle?
The average price for a property for sale in Bolton Castle is £413,591. This amount is 18% higher than the average price in Leyburn. There are 277 property listings for sale in Bolton Castle.
What streets have the most expensive properties for sale in Bolton Castle?
The streets with the most expensive properties for sale in Bolton Castle are West Row at an average of £395,000, Wensley Station at an average of £300,750 and Hargill Drive at an average of £265,000.
What streets have the most affordable properties for sale in Bolton Castle?
The streets with the most affordable properties for sale in Bolton Castle are Belle Vue Terrace at an average of £219,250 and Herontree Close at an average of £230,000.
Which train stations are available in or near Bolton Castle?
Some of the train stations available in or near Bolton Castle are Garsdale, Northallerton and Dent.
Property Price Paid in Bolton Castle by Year
The average sold property price by year was:
| Year | Average Sold Price | Price Change |
Sold Properties
|
|---|---|---|---|
| 2025 | £358,704 | -25% |
11 Properties |
| 2024 | £448,815 | 9% |
19 Properties |
| 2023 | £409,496 | -14% |
16 Properties |
| 2022 | £468,745 | 29% |
12 Properties |
| 2021 | £333,738 | 15% |
31 Properties |
| 2020 | £284,802 | -9% |
22 Properties |
| 2019 | £311,078 | 8% |
19 Properties |
| 2018 | £286,842 | 1% |
19 Properties |
| 2017 | £283,694 | -1% |
27 Properties |
| 2016 | £287,420 | 9% |
17 Properties |
| 2015 | £261,122 | -12% |
20 Properties |
| 2014 | £292,375 | 10% |
20 Properties |
| 2013 | £262,308 | 15% |
24 Properties |
| 2012 | £223,500 | -26% |
15 Properties |
| 2011 | £281,281 | 15% |
16 Properties |
| 2010 | £239,663 | -10% |
15 Properties |
| 2009 | £263,613 | -21% |
22 Properties |
| 2008 | £318,352 | 3% |
17 Properties |
| 2007 | £308,356 | 13% |
29 Properties |
| 2006 | £269,338 | 2% |
21 Properties |
| 2005 | £264,475 | 10% |
22 Properties |
| 2004 | £237,161 | 26% |
17 Properties |
| 2003 | £175,807 | -6% |
21 Properties |
| 2002 | £186,718 | 36% |
24 Properties |
| 2001 | £120,097 | 22% |
23 Properties |
| 2000 | £93,528 | -26% |
25 Properties |
| 1999 | £117,808 | 30% |
27 Properties |
| 1998 | £83,032 | -19% |
20 Properties |
| 1997 | £98,641 | 22% |
28 Properties |
| 1996 | £77,186 | -3% |
25 Properties |
| 1995 | £79,384 | - |
25 Properties |
Property Price per Property Type in Bolton Castle
Here you can find historic sold price data in order to help with your property search.
The average Property Paid Price for specific property types in the last three years are:
| Property Type | Average Sold Price | Sold Properties |
|---|---|---|
| Semi Detached House | £341,375.00 | 12 Semi Detached Houses |
| Detached House | £491,119.00 | 23 Detached Houses |
| Terraced House | £330,268.00 | 11 Terraced Houses |

