
Houses for sale in Leyburn, Leyburn
House Prices in Leyburn
Properties in Leyburn have an average house price of £292k and had 140 Property Transactions within the last 3 years¹.
Leyburn is an area in Leyburn, North Yorkshire with 1,488 households², where the most expensive property was sold for £590k.
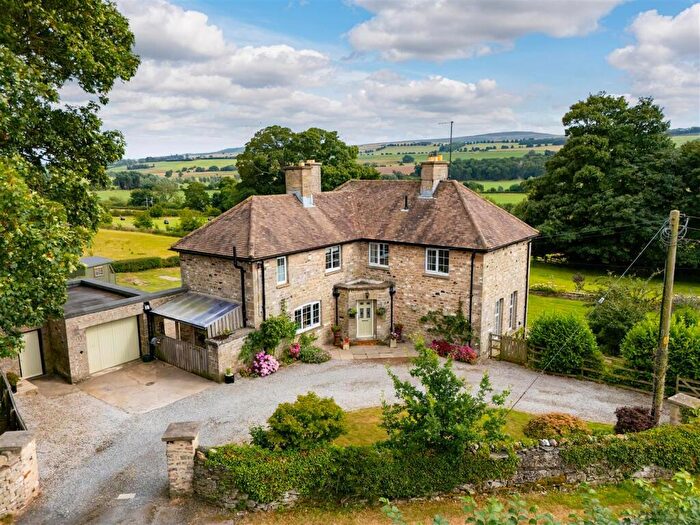
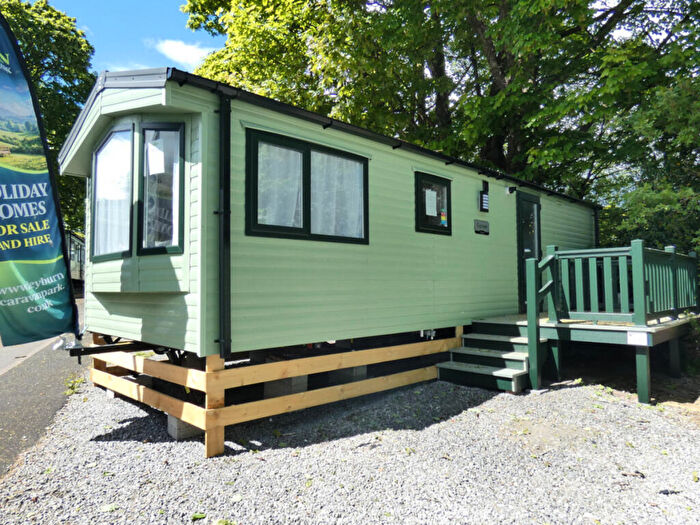
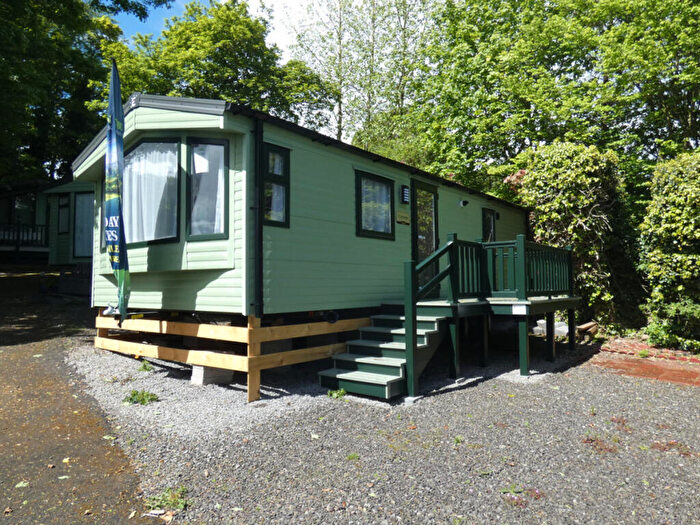
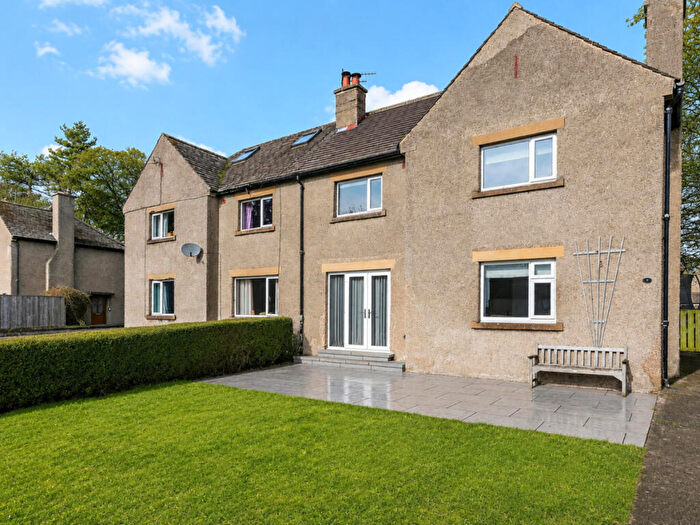
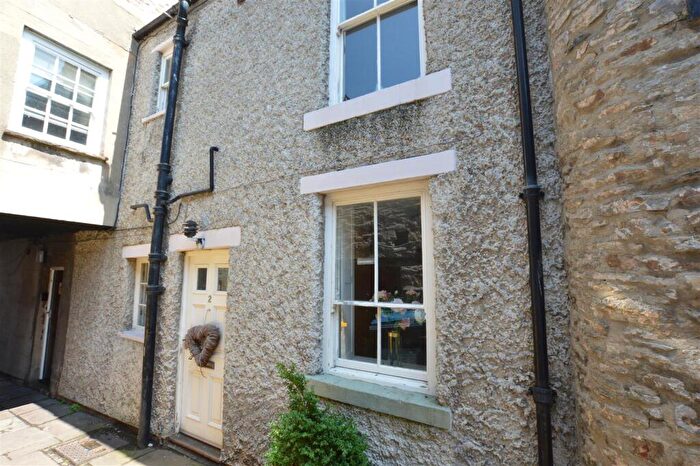
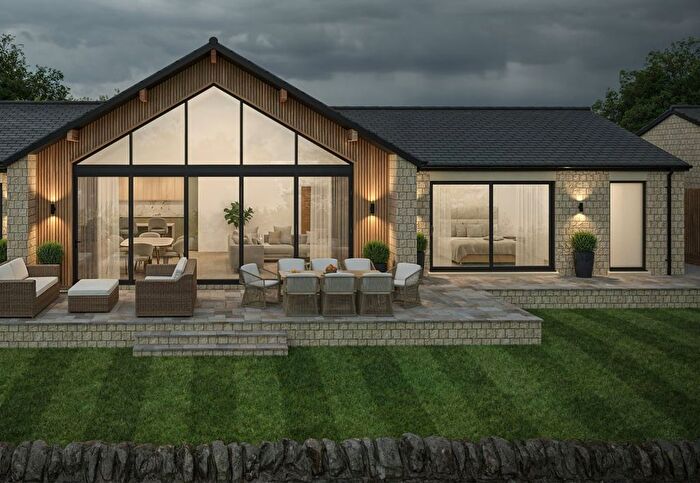
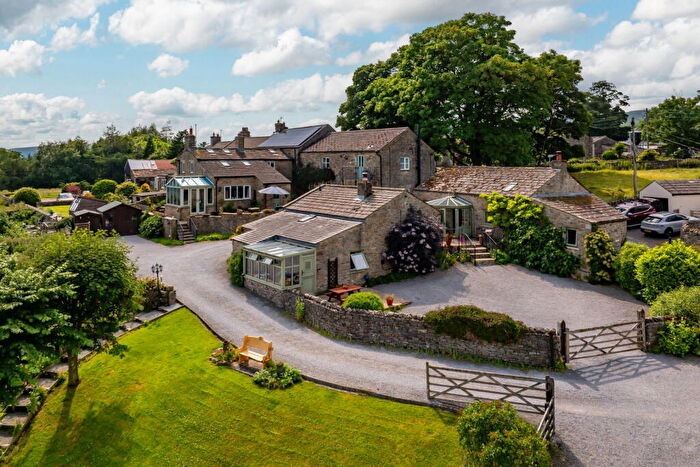
Properties for sale in Leyburn
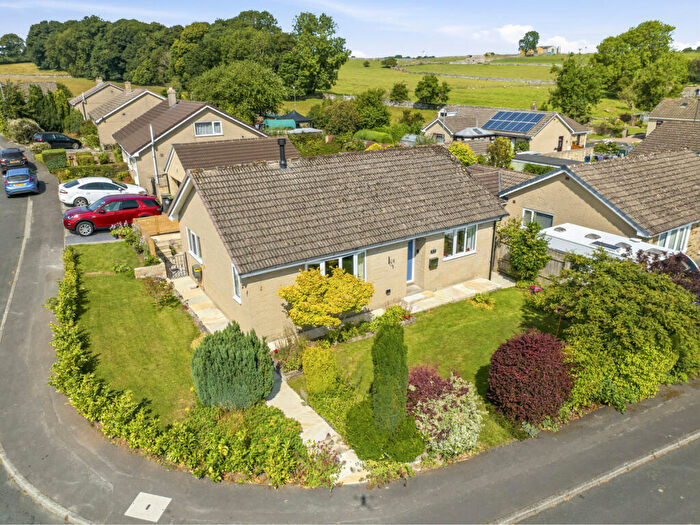
![]()
If you are looking to sell your house, let it out, or receive a property valuation, an expert can help you.
Click the button below to get started.
Roads and Postcodes in Leyburn
Navigate through our locations to find the location of your next house in Leyburn, Leyburn for sale or to rent.
| Streets | Postcodes |
|---|---|
| Annasgarth | DL8 5PJ |
| Annasgarth Close | DL8 5PL |
| Bellerby Road | DL8 5JE DL8 5JF DL8 5LB |
| Bishopdale Close | DL8 5HZ |
| Bolton Court | DL8 5HS |
| Bolton Way | DL8 5HR |
| Brentwood | DL8 5EP DL8 5HT DL8 5HW |
| Briar Close | DL8 4HG |
| Broadley Court | DL8 5EE |
| Brook Terrace | DL8 5PG |
| Cliff Drive | DL8 5EX |
| Commercial Square | DL8 5BP |
| Coverdale Close | DL8 5NN |
| Coverham | DL8 4TL |
| Crown Court | DL8 5EA |
| Curlew Close | DL8 5QF |
| Dale Grove | DL8 5GA DL8 5JG |
| Dale Way | DL8 5LE |
| East View | DL8 4HP |
| Ellerclose Road | DL8 5EZ |
| Fell View | DL8 5EB |
| Grove Square | DL8 5AE DL8 5AG |
| Hargill | DL8 5PN |
| Hargill Close | DL8 5QE |
| Hargill Lane | DL8 4FB |
| Hargill Road | DL8 4EP |
| Harmby Road | DL8 5SG DL8 5BX DL8 5ET DL8 5EU DL8 5FE DL8 5NS |
| Harmby Road Business Park | DL8 5BF |
| Hawthorn Close | DL8 5SN |
| Hetton Court | DL8 5EF |
| Hetton Garth | DL8 5HP |
| High Street | DL8 5AH DL8 5AQ |
| Horseman Street | DL8 4EF |
| Ianson Close | DL8 5LF |
| Jenkins Garth | DL8 5SP |
| Kelberdale Terrace | DL8 5AR |
| Leyburn Business Park | DL8 5QA |
| Leyburn Road | DL8 4HR |
| Love Lane | DL8 5DB |
| Manor Court | DL8 5DD |
| Market Place | DL8 5AN DL8 5AP DL8 5BL DL8 5EW DL8 5AS DL8 5AW DL8 5BD DL8 5BG DL8 5BJ DL8 5BQ DL8 5BW |
| Maythorne | DL8 5DT DL8 5DU |
| Middleham Road | DL8 5EY DL8 5HA DL8 5HD |
| Mill Lane | DL8 5RD |
| Moor Road | DL8 5AA DL8 5AD DL8 5DE DL8 5DH DL8 5DJ DL8 5JZ DL8 5LA DL8 5NZ |
| Mount Drive | DL8 5JQ |
| Oak Close | DL8 5BY |
| Park View | DL8 5HN DL8 5SF |
| Prospect Villas | DL8 5JD |
| Quarry Hills Lane | DL8 5EJ |
| Railway Street | DL8 5BB DL8 5AT DL8 5AY DL8 5EH |
| Richmond Road | DL8 5DP DL8 5HY DL8 5DL DL8 5DN DL8 5DR DL8 5HX |
| Richmond Terrace | DL8 5DW |
| Riseber | DL8 5DF |
| Riseber Lane | DL8 5DQ |
| Rowan Court | DL8 5SL |
| Rumford Way | DL8 5LG |
| Runs Bank | DL8 5JH |
| Shawl Mews | DL8 5SR |
| Shawl Quarry Lane | DL8 5BU |
| Shawl Terrace | DL8 5DA |
| Smithy Lane | DL8 5DZ |
| South View | DL8 5ES |
| South View Lane | DL8 5ER |
| Spennithorne Road | DL8 5PH |
| Springfield Close | DL8 5LQ |
| St Marys Mount | DL8 5JB |
| St Matthews Close | DL8 5HB |
| St Matthews Mews | DL8 5FD |
| St Matthews Terrace | DL8 5EL |
| Station Rise | DL8 5BZ |
| The Mount | DL8 5JA |
| The Nurseries | DL8 5AU DL8 5AX |
| The Shawl | DL8 5DG |
| Thornborough Crescent | DL8 5DY |
| Thornborough Hall Gardens | DL8 5BE |
| Vale Terrace | DL8 5BA |
| Wensley Road | DL8 5BN DL8 5ED |
| Wensley Station | DL8 4AF |
| Wensleydale Avenue | DL8 5SD |
| Woodburn Drive | DL8 5HU |
| Woodside | DL8 5DS DL8 5DX |
| Yew Tree Close | DL8 5SU |
| Yoredale Avenue | DL8 5BH |
| DL8 3TH DL8 4AD DL8 4DT DL8 4HD DL8 4YP DL8 5AB DL8 9AJ DL8 9AL DL8 9AN DL8 4AA DL8 4DL DL8 4DN DL8 4DP DL8 4DS DL8 4EG DL8 4EN DL8 4EY DL8 4HB DL8 4HN DL8 4HX DL8 4HY DL8 4HZ DL8 4JA DL8 4UE DL8 4UF DL8 5AF DL8 5AZ DL8 5EN DL8 5HF DL8 5HJ DL8 5HL DL8 5JJ DL8 5JL DL8 5JX DL8 5JY DL8 5NT DL8 5PA DL8 5PD DL8 5PE DL8 5RA |
Property price trends in Leyburn
According to the latest Land Registry data, the average home in Leyburn sold for £201,500 in 2026. That figure comes from 1,734 sales logged over the past 31 years.
Prices have fallen back over the last three years. Compared with 2023, when the typical sale came in around £296,895, that's a fall of roughly 32.1%.
Looking back five years, average prices are down about 31.8% since 2021, a drop of around £93,915 in cash terms.
Zoom out to the past decade for the fuller picture. Back in 2016, homes here averaged £231,232, so the typical sold price has fallen about 12.9% since then, around 1.4% a year lower. Stretch the view to fifteen years and that annual pace edges up closer to -0.3%.
Frequently asked questions about Leyburn
What is the average price for a property for sale in Leyburn?
The average price for a property for sale in Leyburn is £292,249. This amount is 16% lower than the average price in Leyburn. There are 610 property listings for sale in Leyburn.
What streets have the most expensive properties for sale in Leyburn?
The streets with the most expensive properties for sale in Leyburn are South View at an average of £510,000, Springfield Close at an average of £495,000 and Shawl Quarry Lane at an average of £478,000.
What streets have the most affordable properties for sale in Leyburn?
The streets with the most affordable properties for sale in Leyburn are Richmond Terrace at an average of £155,333, Maythorne at an average of £167,000 and Hetton Court at an average of £167,000.
Which train stations are available in or near Leyburn?
Some of the train stations available in or near Leyburn are Northallerton, Darlington and North Road.
Property Price Paid in Leyburn by Year
The average sold property price by year was:
| Year | Average Sold Price | Price Change |
Sold Properties
|
|---|---|---|---|
| 2026 | £201,500 | -46% |
4 Properties |
| 2025 | £295,084 | 1% |
53 Properties |
| 2024 | £292,575 | -1% |
40 Properties |
| 2023 | £296,895 | -11% |
43 Properties |
| 2022 | £330,626 | 11% |
47 Properties |
| 2021 | £295,415 | 16% |
69 Properties |
| 2020 | £248,350 | -8% |
59 Properties |
| 2019 | £268,246 | 14% |
55 Properties |
| 2018 | £231,982 | -4% |
80 Properties |
| 2017 | £240,800 | 4% |
70 Properties |
Property Price per Property Type in Leyburn
Here you can find historic sold price data in order to help with your property search.
The average Property Paid Price for specific property types in the last three years are:
| Property Type | Average Sold Price | Sold Properties |
|---|---|---|
| Flat | £169,500.00 | 6 Flats |
| Semi Detached House | £274,166.00 | 42 Semi Detached Houses |
| Detached House | £349,868.00 | 57 Detached Houses |
| Terraced House | £241,157.00 | 35 Terraced Houses |
