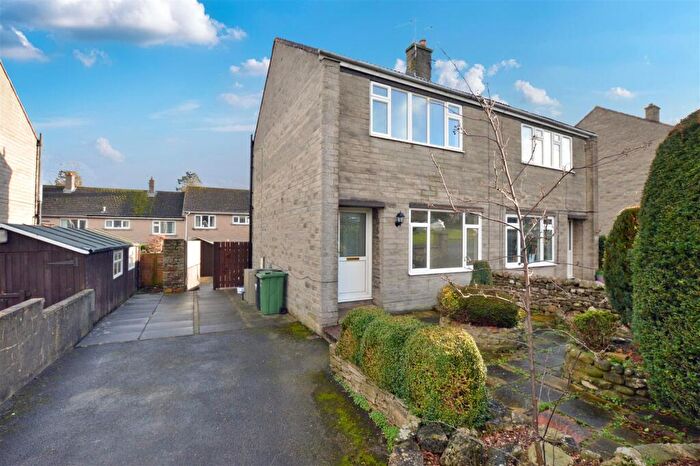
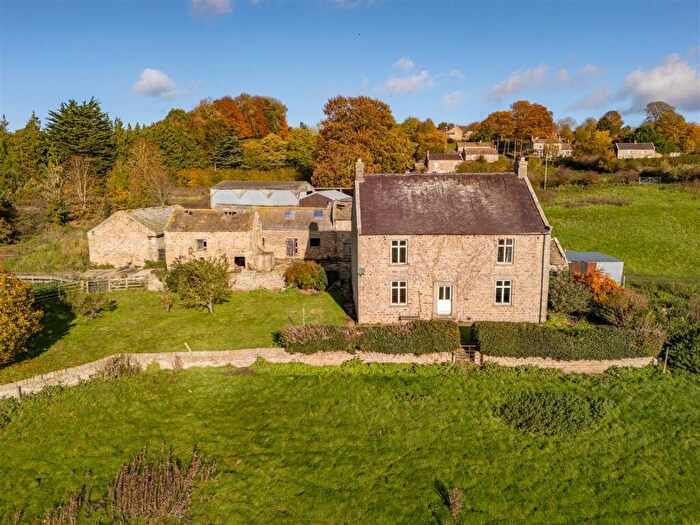
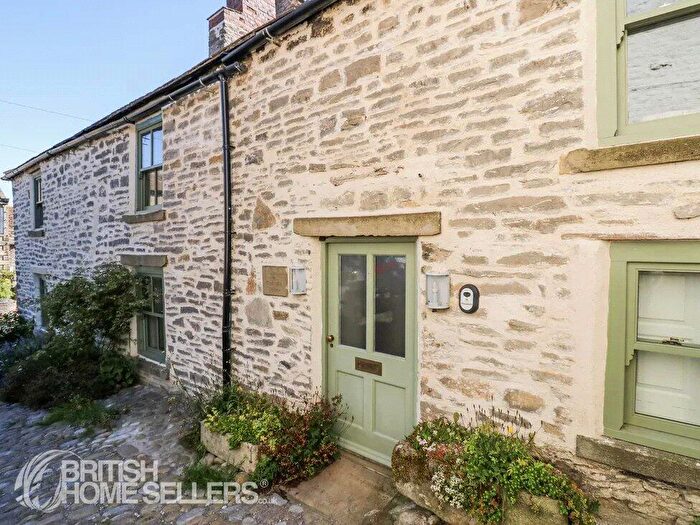
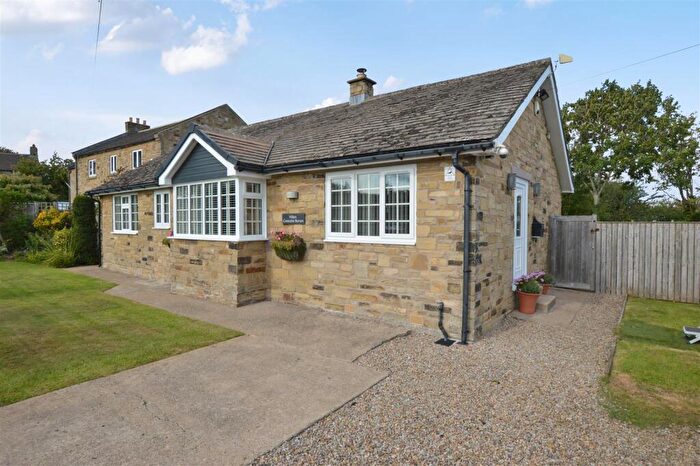
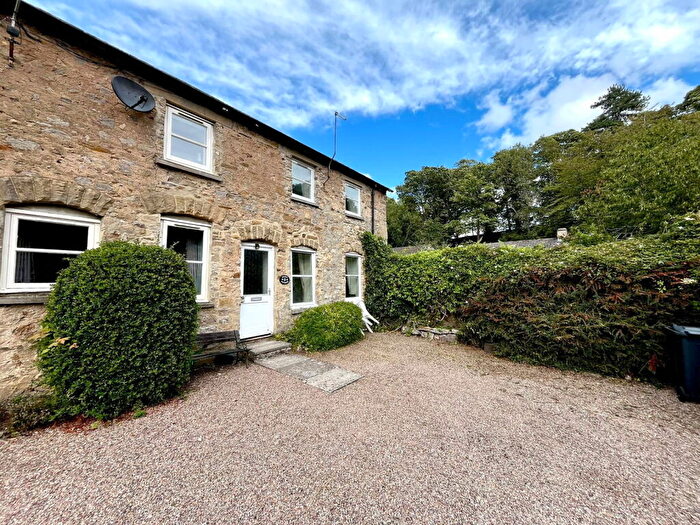
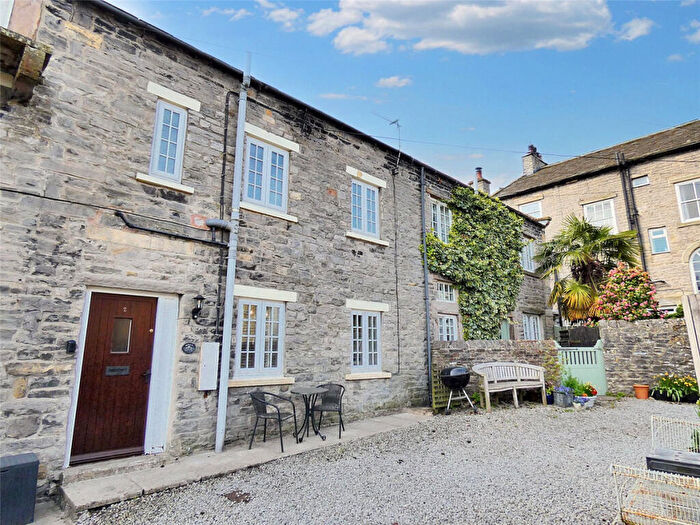
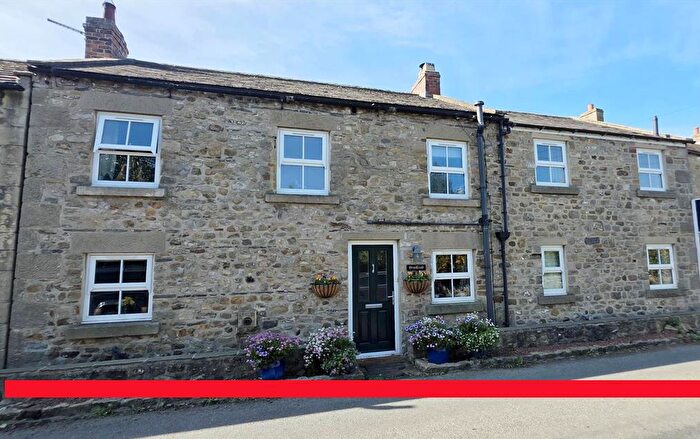
Houses for sale & to rent in Lower Wensleydale, Leyburn
House Prices in Lower Wensleydale
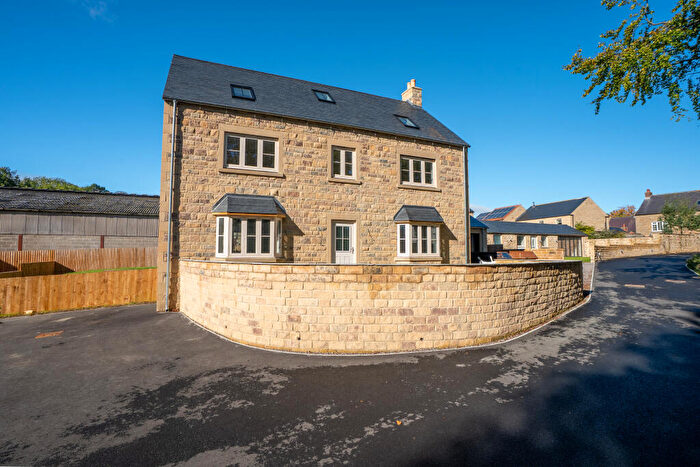
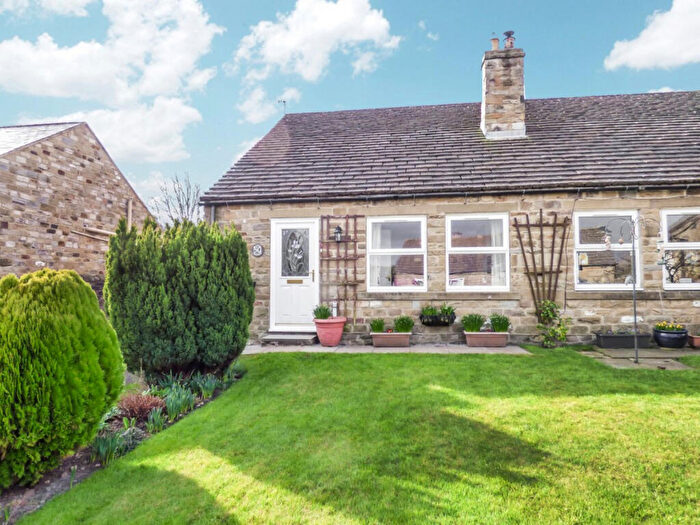
Properties in Lower Wensleydale have an average house price of £469,770.00 and had 24 Property Transactions within the last 3 years¹.
Lower Wensleydale is an area in Leyburn, North Yorkshire with 317 households², where the most expensive property was sold for £1,290,000.00.
Properties for sale in Lower Wensleydale
Roads and Postcodes in Lower Wensleydale
Navigate through our locations to find the location of your next house in Lower Wensleydale, Leyburn for sale or to rent.
| Streets | Postcodes |
|---|---|
| Ashfield Close | DL8 5RS |
| Beckwood | DL8 5FB |
| Blewhouse Lane | DL8 5NP |
| Chapel Lane | DL8 5LZ |
| Church Lane | DL8 5NA |
| Donald Smith Court | DL8 5RR |
| Hargill Lane | DL8 5NB |
| Main Street | DL8 5PY |
| Mill Lane | DL8 5RQ |
| New Park | DL8 5QD |
| Pump Street | DL8 5LU |
| Stable Cottages | DL8 5QB |
| Sycamore Close | DL8 5PP |
| The Glebe | DL8 5NR |
| Thorney Meadows | DL8 5RE |
| Willow Court | DL8 5NL |
| DL8 5JR DL8 5JS DL8 5JT DL8 5LH DL8 5LN DL8 5ND DL8 5NG DL8 5NH DL8 5NJ DL8 5NQ DL8 5PR DL8 5PS DL8 5PW DL8 5RG DL8 5RJ DL8 5RL DL8 5RN DL8 5RW DL8 4PU DL8 4PX DL8 5GB DL8 5HG DL8 5HH DL8 5HQ DL8 5JN DL8 5JW DL8 5LJ DL8 5LL DL8 5LP DL8 5LR DL8 5LS DL8 5LT DL8 5LW DL8 5LX DL8 5LY DL8 5NE DL8 5NF DL8 5NU DL8 5NX DL8 5PB DL8 5PF DL8 5PQ DL8 5PT DL8 5PU DL8 5PZ DL8 5RP |
Transport near Lower Wensleydale
-
Northallerton Station
-
Thirsk Station
-
Darlington Station
-
North Road Station
-
Dinsdale Station
-
Teesside Airport Station
- FAQ
- Price Paid By Year
- Property Type Price
Frequently asked questions about Lower Wensleydale
What is the average price for a property for sale in Lower Wensleydale?
The average price for a property for sale in Lower Wensleydale is £469,770. This amount is 34% higher than the average price in Leyburn. There are 326 property listings for sale in Lower Wensleydale.
What streets have the most expensive properties for sale in Lower Wensleydale?
The streets with the most expensive properties for sale in Lower Wensleydale are Main Street at an average of £640,000, Hargill Lane at an average of £435,000 and Ashfield Close at an average of £378,500.
What streets have the most affordable properties for sale in Lower Wensleydale?
The streets with the most affordable properties for sale in Lower Wensleydale are Sycamore Close at an average of £235,000, Willow Court at an average of £280,000 and Thorney Meadows at an average of £297,750.
Which train stations are available in or near Lower Wensleydale?
Some of the train stations available in or near Lower Wensleydale are Northallerton, Thirsk and Darlington.
Property Price Paid in Lower Wensleydale by Year
The average sold property price by year was:
| Year | Average Sold Price | Price Change |
Sold Properties
|
|---|---|---|---|
| 2025 | £459,538 | 17% |
13 Properties |
| 2024 | £383,416 | -56% |
6 Properties |
| 2023 | £600,000 | 28% |
5 Properties |
| 2022 | £431,793 | 5% |
10 Properties |
| 2021 | £411,177 | 4% |
11 Properties |
| 2020 | £392,817 | -2% |
15 Properties |
| 2019 | £401,400 | 11% |
5 Properties |
| 2018 | £356,742 | 18% |
14 Properties |
| 2017 | £293,285 | -22% |
21 Properties |
| 2016 | £357,590 | -11% |
10 Properties |
| 2015 | £395,541 | -27% |
12 Properties |
| 2014 | £501,545 | 31% |
10 Properties |
| 2013 | £345,800 | 7% |
5 Properties |
| 2012 | £321,575 | 26% |
6 Properties |
| 2011 | £239,500 | -43% |
8 Properties |
| 2010 | £342,437 | -7% |
8 Properties |
| 2009 | £367,400 | 15% |
5 Properties |
| 2008 | £311,571 | -36% |
7 Properties |
| 2007 | £424,650 | 36% |
10 Properties |
| 2006 | £269,996 | -46% |
15 Properties |
| 2005 | £395,000 | 24% |
7 Properties |
| 2004 | £301,944 | 21% |
9 Properties |
| 2003 | £239,136 | 25% |
11 Properties |
| 2002 | £178,395 | 17% |
12 Properties |
| 2001 | £147,250 | -11% |
6 Properties |
| 2000 | £163,392 | 18% |
7 Properties |
| 1999 | £134,150 | 32% |
12 Properties |
| 1998 | £91,750 | -1% |
12 Properties |
| 1997 | £93,000 | 10% |
5 Properties |
| 1996 | £83,475 | -44% |
10 Properties |
| 1995 | £119,950 | - |
6 Properties |
Property Price per Property Type in Lower Wensleydale
Here you can find historic sold price data in order to help with your property search.
The average Property Paid Price for specific property types in the last three years are:
| Property Type | Average Sold Price | Sold Properties |
|---|---|---|
| Semi Detached House | £288,333.00 | 6 Semi Detached Houses |
| Detached House | £607,423.00 | 13 Detached Houses |
| Terraced House | £329,600.00 | 5 Terraced Houses |

