
Houses for sale in Croft, Northallerton
House Prices in Croft
Properties in Croft have an average house price of £383k and had 17 Property Transactions within the last 3 years¹.
Croft is an area in Northallerton, North Yorkshire with 202 households², where the most expensive property was sold for £725k.
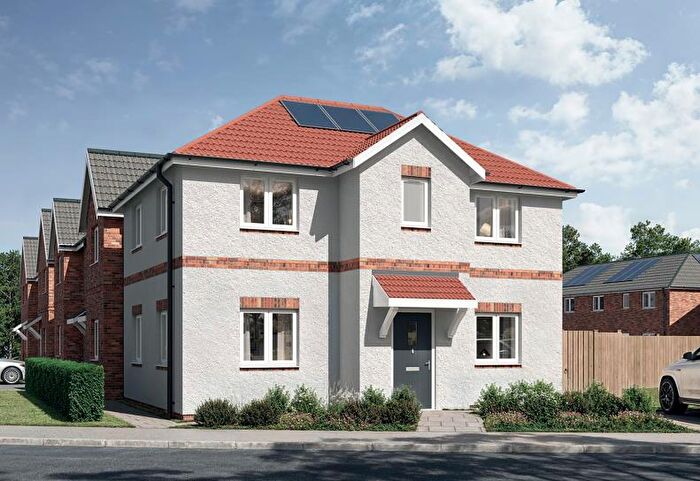
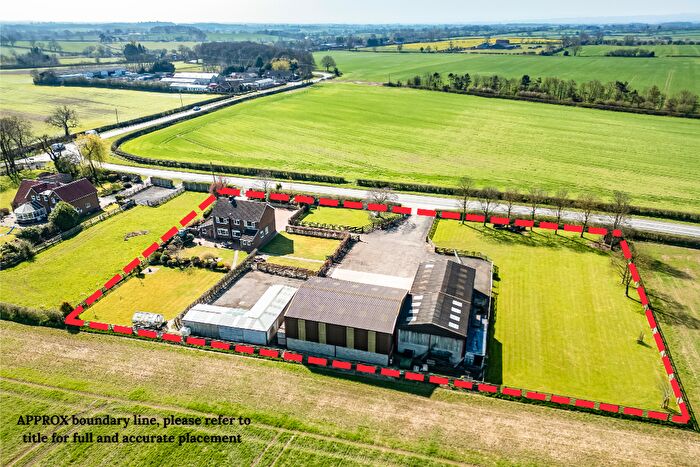
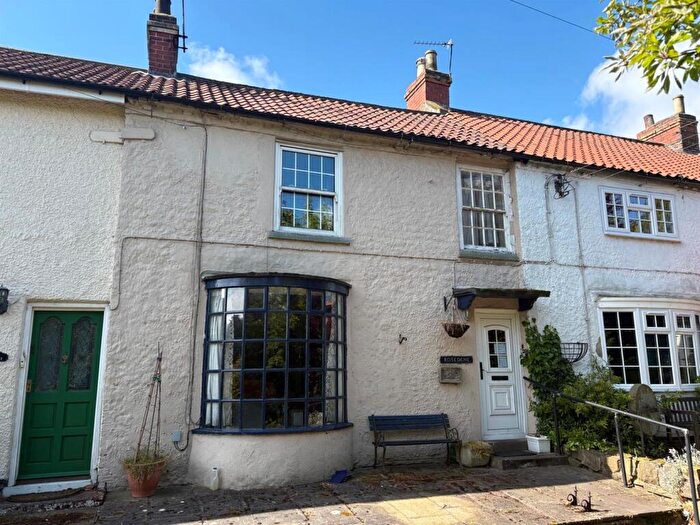
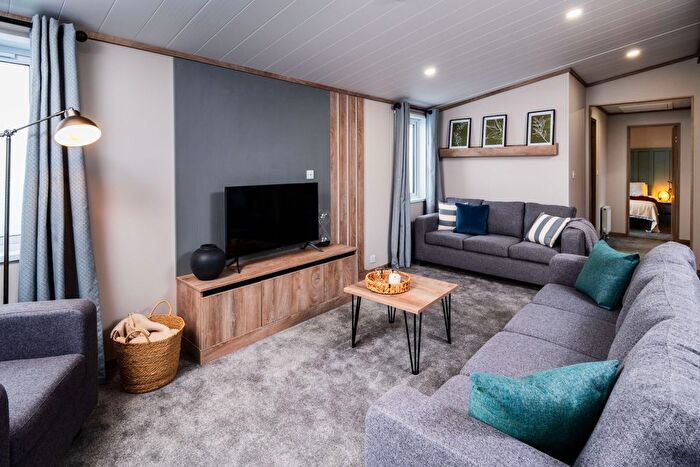
Properties for sale in Croft
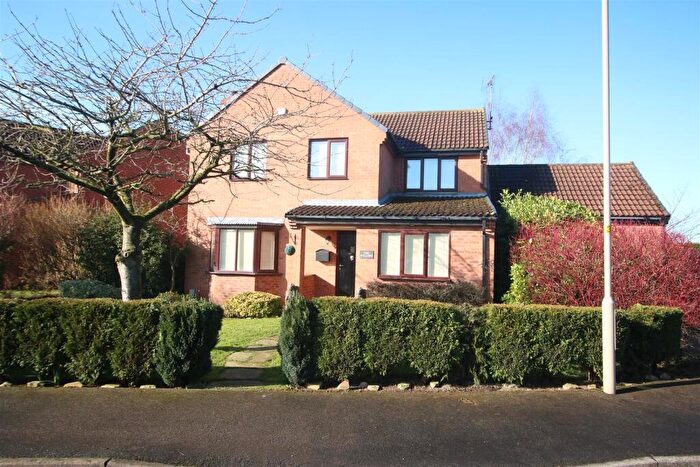
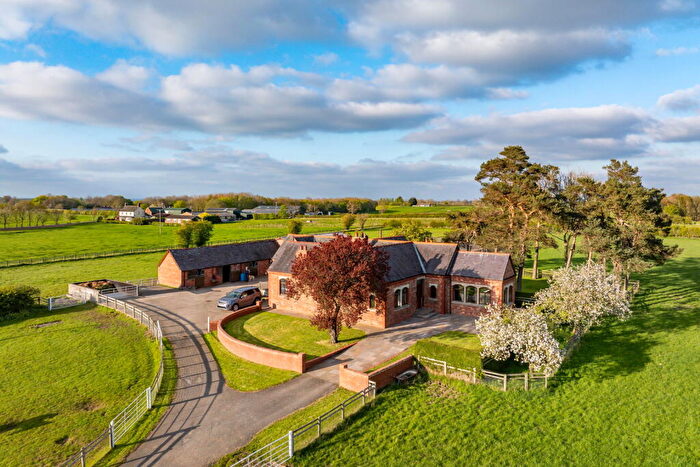
![]()
If you are looking to sell your house, let it out, or receive a property valuation, an expert can help you.
Click the button below to get started.
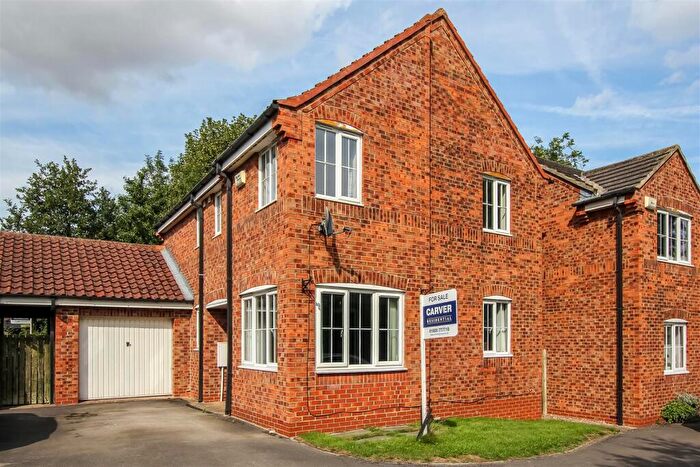
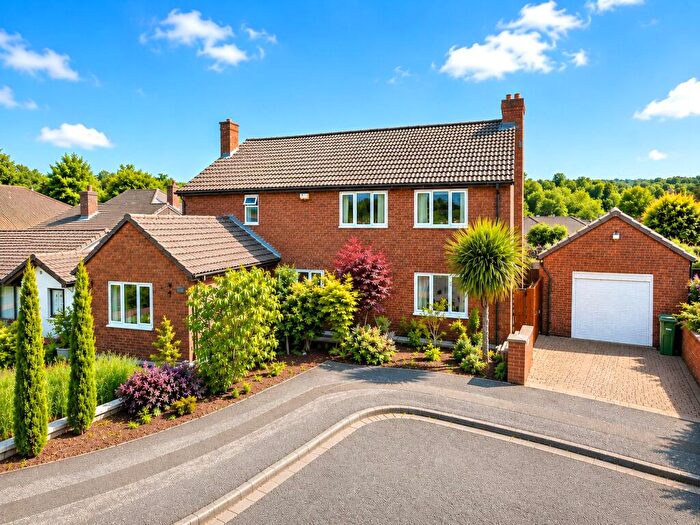
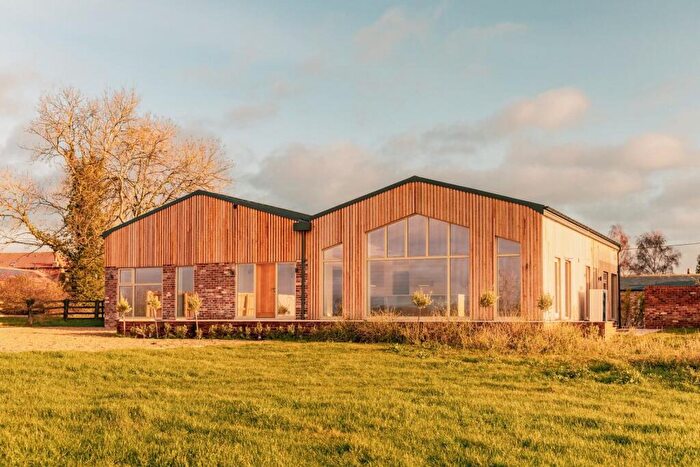
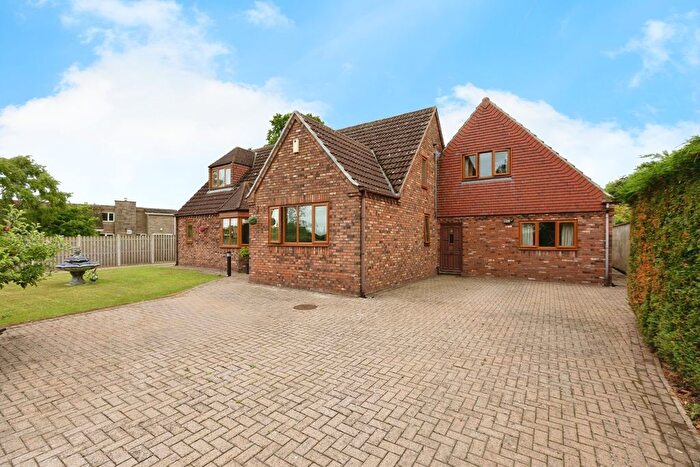
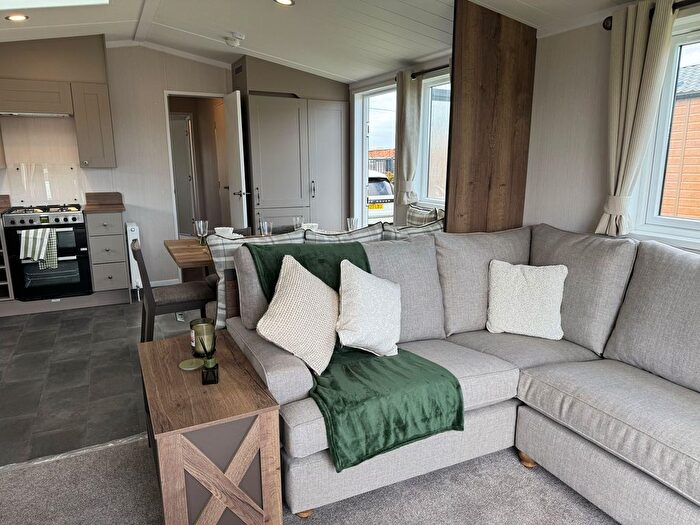
Previously listed properties in Croft

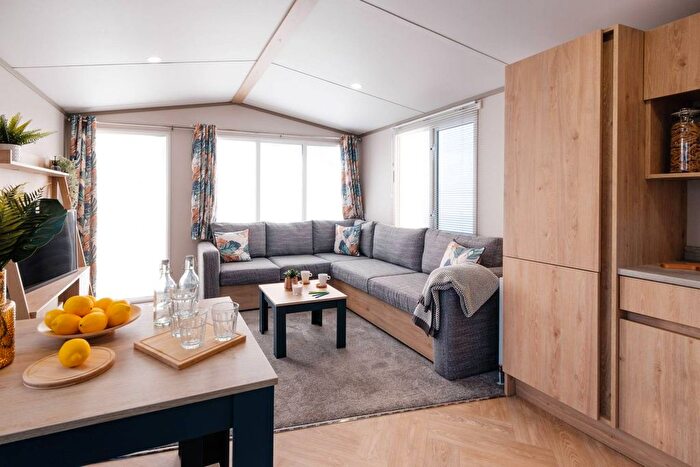
![]()
If you are looking to sell your house, let it out, or receive a property valuation, an expert can help you.
Click the button below to get started.
Roads and Postcodes in Croft
Navigate through our locations to find the location of your next house in Croft, Northallerton for sale or to rent.
| Streets | Postcodes |
|---|---|
| Anvil Way | DL7 0EJ |
| Blacksmith Court | DL7 0EL |
| Dalton Gates | DL7 0JS |
| Follet Close | DL7 0HL |
| Hill Top Court | DL7 0HU |
| Holywell Lane | DL7 0HE |
| Lancaster Road | DL7 0ES |
| Main Road | DL7 0EZ |
| Moulton Lane | DL7 0JR |
| Myton Terrace | DL7 0EU |
| Silver Hill | DL7 0EX |
| Station Road | DL7 0HH DL7 0HQ |
| DL6 2HY DL7 0ER DL7 0ET DL7 0HB DL7 0HF DL7 0HG DL7 0HP |
Property price trends in Croft
According to the latest Land Registry data, the average home in Croft sold for £725,000 in 2026. That figure comes from 240 sales logged over the past 31 years.
Prices have continued to climb over the last three years. Compared with 2023, when the typical sale came in around £363,125, that's a rise of roughly 99.7%.
Looking back five years, average prices are up about 67.7% since 2021, a gain of around £292,784 in cash terms.
Zoom out to the past decade for the fuller picture. Back in 2016, homes here averaged £303,000, so the typical sold price has climbed about 139.3% since then, roughly 9.1% a year. Stretch the view to fifteen years and that annual pace eases back to about 5.3%.
Frequently asked questions about Croft
What is the average price for a property for sale in Croft?
The average price for a property for sale in Croft is £383,264. This amount is 35% higher than the average price in Northallerton. There are 236 property listings for sale in Croft.
What streets have the most expensive properties for sale in Croft?
The streets with the most expensive properties for sale in Croft are Anvil Way at an average of £360,000 and Holywell Lane at an average of £346,750.
What streets have the most affordable properties for sale in Croft?
The streets with the most affordable properties for sale in Croft are Hill Top Court at an average of £248,333 and Moulton Lane at an average of £290,000.
Which train stations are available in or near Croft?
Some of the train stations available in or near Croft are Darlington, Dinsdale and North Road.
Property Price Paid in Croft by Year
The average sold property price by year was:
| Year | Average Sold Price | Price Change |
Sold Properties
|
|---|---|---|---|
| 2026 | £725,000 | 52% |
1 Property |
| 2025 | £350,700 | -8% |
5 Properties |
| 2024 | £377,333 | 4% |
3 Properties |
| 2023 | £363,125 | 4% |
8 Properties |
| 2022 | £349,438 | -24% |
9 Properties |
| 2021 | £432,216 | 22% |
9 Properties |
| 2020 | £337,470 | 32% |
4 Properties |
| 2019 | £230,250 | -13% |
6 Properties |
| 2018 | £260,000 | -0,5% |
2 Properties |
| 2017 | £261,250 | -16% |
8 Properties |
Property Price per Property Type in Croft
Here you can find historic sold price data in order to help with your property search.
The average Property Paid Price for specific property types in the last three years are:
| Property Type | Average Sold Price | Sold Properties |
|---|---|---|
| Semi Detached House | £275,833.00 | 6 Semi Detached Houses |
| Detached House | £441,863.00 | 11 Detached Houses |
