Houses for sale & to rent in Croft, Darlington
House Prices in Croft
Properties in Croft have an average house price of £364,653.00 and had 20 Property Transactions within the last 3 years¹.
Croft is an area in Darlington, North Yorkshire with 244 households², where the most expensive property was sold for £1,250,000.00.
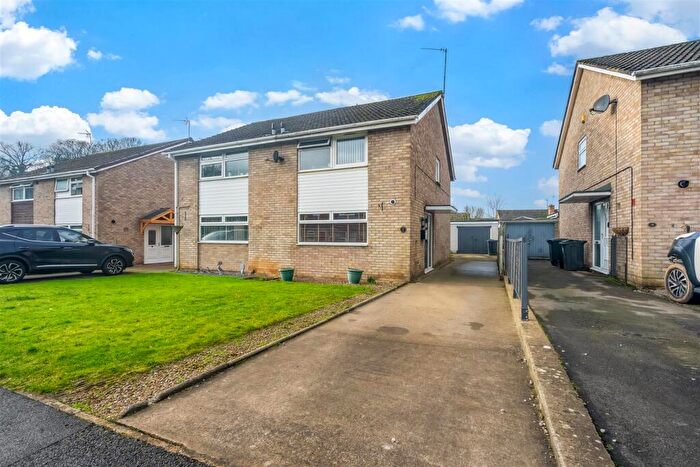
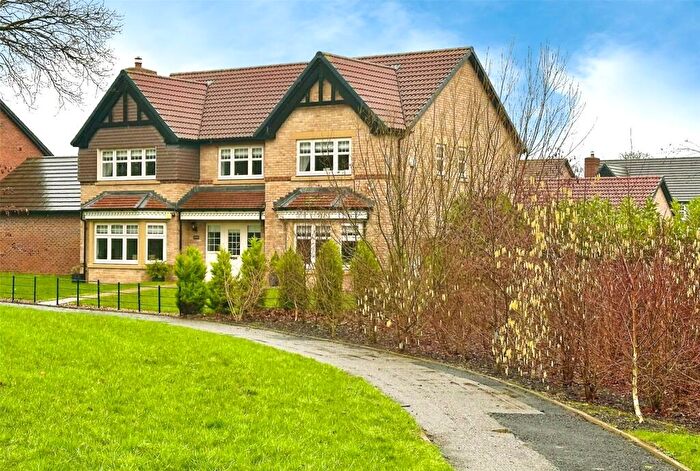
Properties for sale in Croft
Roads and Postcodes in Croft
Navigate through our locations to find the location of your next house in Croft, Darlington for sale or to rent.
| Streets | Postcodes |
|---|---|
| Byron Court | DL2 2PX |
| Carroll Place | DL2 2SS |
| Dalton Road | DL2 2SX DL2 2SY |
| Eryholme Lane | DL2 2PD |
| Garth Terrace | DL2 2NU |
| Monk End | DL2 2SW |
| Monk End Gardens | DL2 2SP |
| Monkend Terrace | DL2 2SQ |
| Northallerton Road | DL2 2NR |
| Orchard Close | DL2 2PY |
| Rectory Cottages | DL2 2SG |
| Ruskin Close | DL2 2PZ |
| South Parade | DL2 2SN |
| South Terrace | DL2 2TE |
| Spa Courtyard | DL2 2SU |
| The Green | DL2 2PA |
| The Mill Race | DL2 2TN |
| The Terrace | DL2 2TD |
| West Lane | DL2 2PJ DL2 2PL DL2 2PP DL2 2PT |
| DL2 2NT DL2 2NX DL2 2PB DL2 2PF DL2 2PN DL2 2PQ DL2 2PS DL2 2QS DL2 2SJ DL2 2TJ |
Transport near Croft
- FAQ
- Price Paid By Year
- Property Type Price
Frequently asked questions about Croft
What is the average price for a property for sale in Croft?
The average price for a property for sale in Croft is £364,653. This amount is 8% lower than the average price in Darlington. There are 2,022 property listings for sale in Croft.
What streets have the most expensive properties for sale in Croft?
The streets with the most expensive properties for sale in Croft are South Terrace at an average of £560,000, Dalton Road at an average of £503,333 and South Parade at an average of £334,032.
What streets have the most affordable properties for sale in Croft?
The streets with the most affordable properties for sale in Croft are Carroll Place at an average of £245,000, The Green at an average of £281,250 and Monk End Gardens at an average of £300,000.
Which train stations are available in or near Croft?
Some of the train stations available in or near Croft are Darlington, Dinsdale and North Road.
Property Price Paid in Croft by Year
The average sold property price by year was:
| Year | Average Sold Price | Price Change |
Sold Properties
|
|---|---|---|---|
| 2025 | £337,750 | -30% |
6 Properties |
| 2024 | £440,000 | 29% |
7 Properties |
| 2023 | £312,366 | -36% |
7 Properties |
| 2022 | £423,425 | 13% |
8 Properties |
| 2021 | £366,909 | 15% |
11 Properties |
| 2020 | £311,208 | 12% |
12 Properties |
| 2019 | £272,372 | 5% |
8 Properties |
| 2018 | £259,426 | -22% |
6 Properties |
| 2017 | £315,900 | 9% |
10 Properties |
| 2016 | £286,428 | 6% |
7 Properties |
| 2015 | £269,037 | -58% |
12 Properties |
| 2014 | £425,000 | 36% |
5 Properties |
| 2013 | £274,125 | 9% |
4 Properties |
| 2012 | £250,666 | -107% |
6 Properties |
| 2011 | £517,875 | 53% |
8 Properties |
| 2010 | £241,406 | -10% |
15 Properties |
| 2009 | £266,306 | -12% |
8 Properties |
| 2008 | £299,250 | 6% |
4 Properties |
| 2007 | £280,968 | -31% |
16 Properties |
| 2006 | £367,844 | 12% |
9 Properties |
| 2005 | £322,564 | 19% |
7 Properties |
| 2004 | £261,636 | 27% |
11 Properties |
| 2003 | £189,865 | 3% |
10 Properties |
| 2002 | £184,779 | 5% |
17 Properties |
| 2001 | £175,888 | 34% |
9 Properties |
| 2000 | £115,492 | -7% |
7 Properties |
| 1999 | £123,659 | 9% |
11 Properties |
| 1998 | £113,125 | 3% |
8 Properties |
| 1997 | £109,822 | 17% |
9 Properties |
| 1996 | £91,150 | -40% |
13 Properties |
| 1995 | £127,707 | - |
7 Properties |
Property Price per Property Type in Croft
Here you can find historic sold price data in order to help with your property search.
The average Property Paid Price for specific property types in the last three years are:
| Property Type | Average Sold Price | Sold Properties |
|---|---|---|
| Semi Detached House | £272,071.00 | 7 Semi Detached Houses |
| Terraced House | £310,355.00 | 3 Terraced Houses |
| Detached House | £445,750.00 | 10 Detached Houses |


