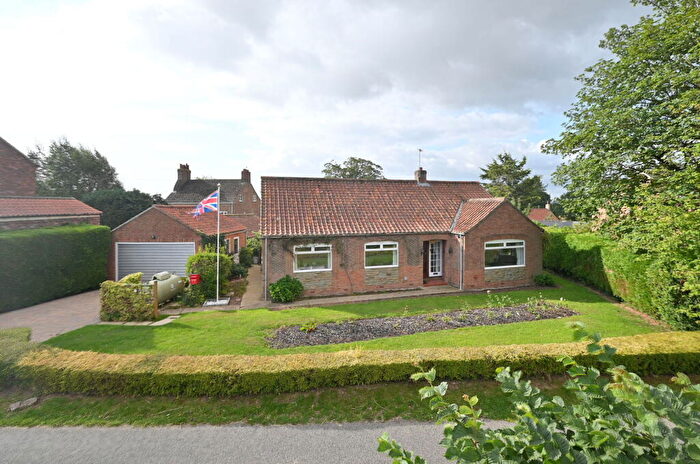
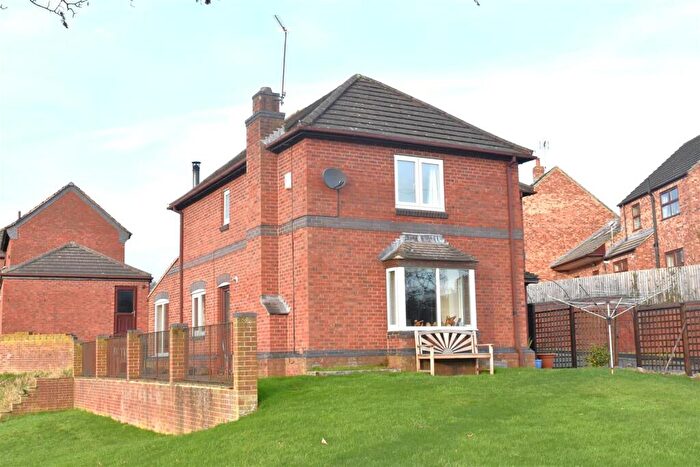
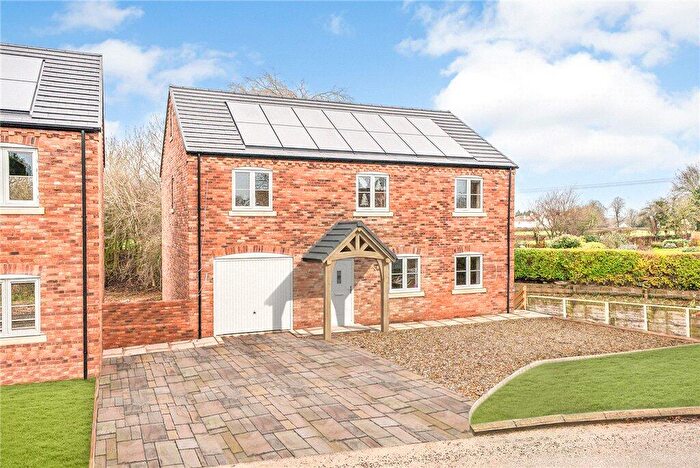
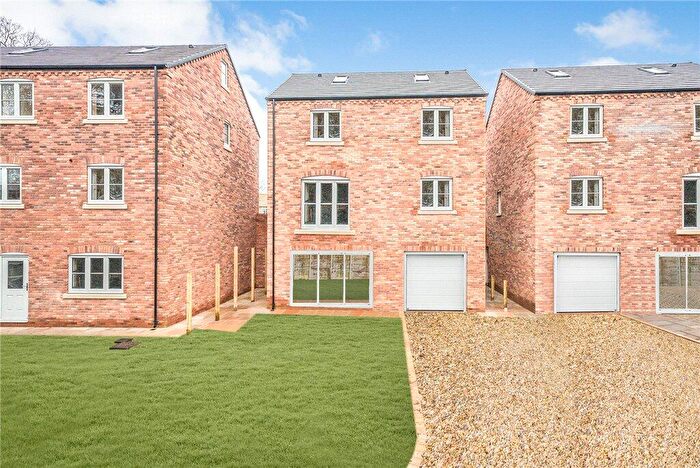
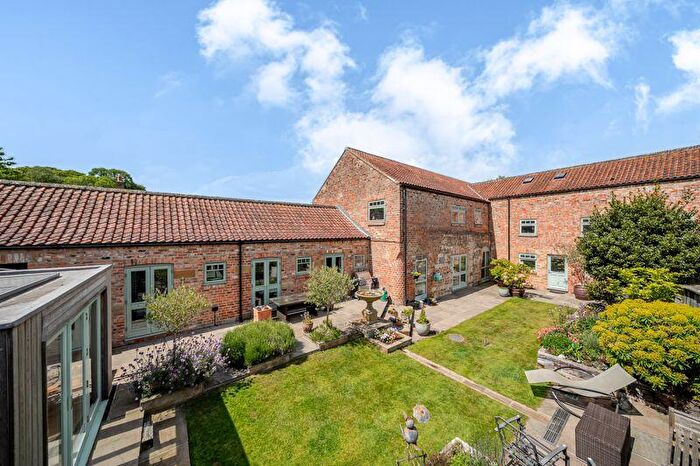
Houses for sale & to rent in Newby, Ripon
House Prices in Newby
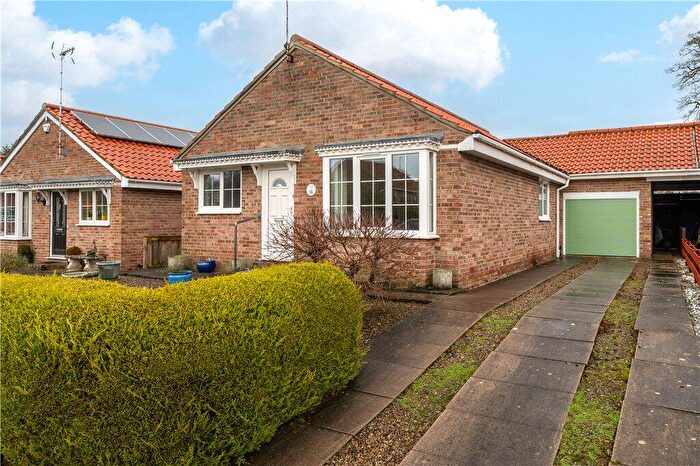
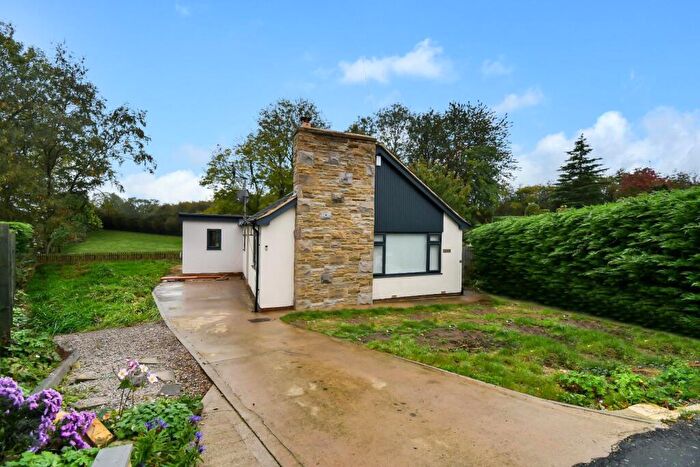
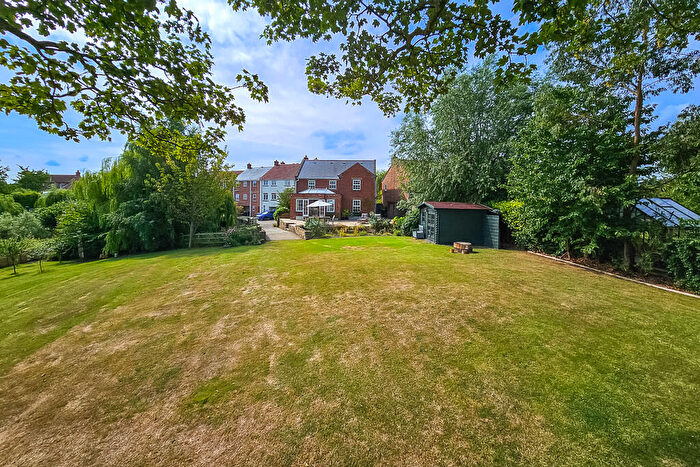
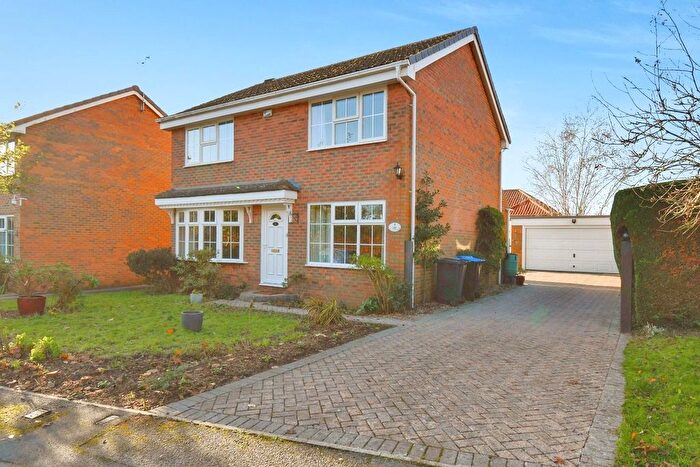
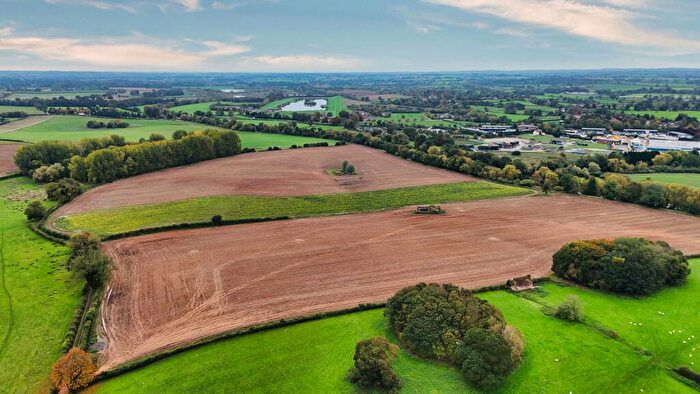
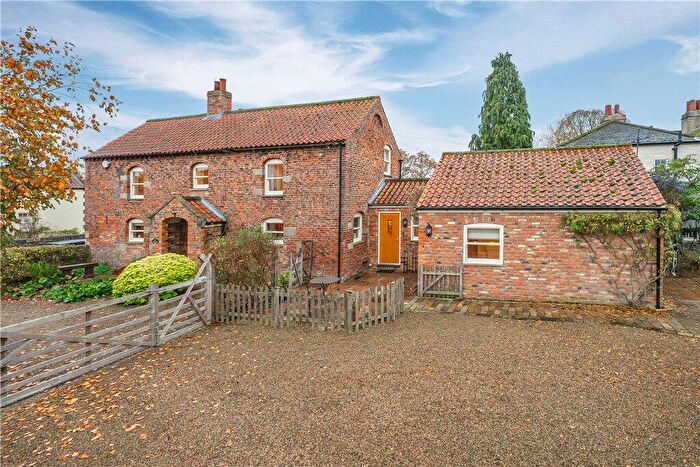
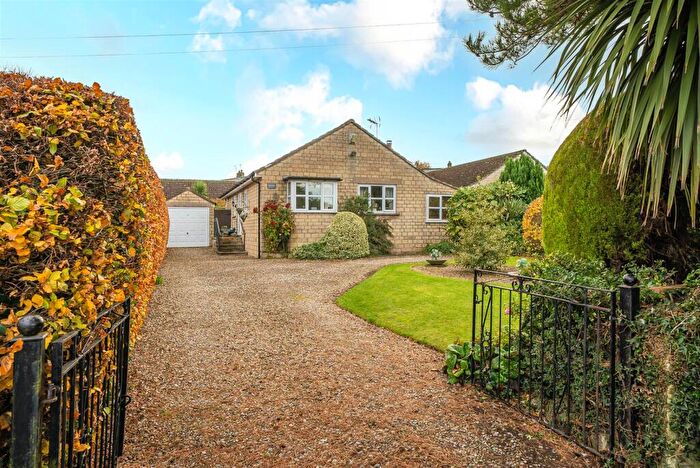
Properties in Newby have an average house price of £477,745.00 and had 45 Property Transactions within the last 3 years¹.
Newby is an area in Ripon, North Yorkshire with 526 households², where the most expensive property was sold for £1,530,189.00.
Properties for sale in Newby
Roads and Postcodes in Newby
Navigate through our locations to find the location of your next house in Newby, Ripon for sale or to rent.
| Streets | Postcodes |
|---|---|
| Back Lane | HG4 5DB |
| Berrygate Lane | HG4 5BJ |
| Cana Avenue | HG4 5AU |
| Cana Lane | HG4 5BT |
| Chapel Lane | HG4 5AS |
| Chapel Row | HG4 5BZ |
| Cherry Tree Close | HG4 5AL |
| Church Close | HG4 5BL |
| Church Row | HG4 5DA |
| Church Wood Close | HG4 5EG |
| Crow Garth | HG4 5AF |
| Devonshire Green | HG4 5DL |
| Dishforth Road | HG4 5BQ HG4 5BU |
| Glebe Meadow | HG4 5BD |
| Hutton Bank | HG4 5DP |
| Keldale Gardens | HG4 5BA |
| Keldale Terrace | HG4 5BW |
| Manor Garth | HG4 5ND |
| New Road | HG4 5BS |
| Orchard Close | HG4 5BE |
| Ray Lane | HG4 5AB |
| Sharow | HG4 5BN HG4 5BP |
| Sharow Lane | HG4 5BG HG4 5BH |
| St Johns Close | HG4 5BB |
| Tithe Way | HG4 5AN |
| Vale View | HG4 5DD |
| Whitegate Lane | HG4 5AT |
| HG4 5AG HG4 5AJ HG4 5BY HG4 5DE HG4 5DF HG4 5DJ |
Transport near Newby
- FAQ
- Price Paid By Year
- Property Type Price
Frequently asked questions about Newby
What is the average price for a property for sale in Newby?
The average price for a property for sale in Newby is £477,745. This amount is 44% higher than the average price in Ripon. There are 207 property listings for sale in Newby.
What streets have the most expensive properties for sale in Newby?
The streets with the most expensive properties for sale in Newby are Sharow at an average of £677,000, Dishforth Road at an average of £595,600 and Devonshire Green at an average of £547,500.
What streets have the most affordable properties for sale in Newby?
The streets with the most affordable properties for sale in Newby are Cana Avenue at an average of £228,400, Crow Garth at an average of £260,375 and Glebe Meadow at an average of £355,625.
Which train stations are available in or near Newby?
Some of the train stations available in or near Newby are Thirsk, Knaresborough and Starbeck.
Property Price Paid in Newby by Year
The average sold property price by year was:
| Year | Average Sold Price | Price Change |
Sold Properties
|
|---|---|---|---|
| 2025 | £401,333 | -9% |
6 Properties |
| 2024 | £435,766 | -12% |
9 Properties |
| 2023 | £489,724 | -5% |
12 Properties |
| 2022 | £516,219 | 8% |
18 Properties |
| 2021 | £474,602 | 31% |
24 Properties |
| 2020 | £327,672 | -31% |
20 Properties |
| 2019 | £428,855 | 20% |
19 Properties |
| 2018 | £343,046 | -16% |
16 Properties |
| 2017 | £398,625 | 5% |
24 Properties |
| 2016 | £380,500 | 10% |
22 Properties |
| 2015 | £341,598 | 7% |
25 Properties |
| 2014 | £318,259 | -10% |
21 Properties |
| 2013 | £349,926 | 14% |
17 Properties |
| 2012 | £301,576 | -29% |
13 Properties |
| 2011 | £389,562 | -50% |
8 Properties |
| 2010 | £585,550 | 48% |
9 Properties |
| 2009 | £303,949 | -15% |
20 Properties |
| 2008 | £350,981 | 4% |
16 Properties |
| 2007 | £335,706 | 1% |
15 Properties |
| 2006 | £330,922 | 18% |
20 Properties |
| 2005 | £271,027 | 10% |
18 Properties |
| 2004 | £244,318 | -2% |
25 Properties |
| 2003 | £249,266 | 10% |
28 Properties |
| 2002 | £225,426 | 30% |
22 Properties |
| 2001 | £157,886 | - |
22 Properties |
| 2000 | £157,840 | 1% |
27 Properties |
| 1999 | £156,406 | 36% |
16 Properties |
| 1998 | £99,340 | -6% |
16 Properties |
| 1997 | £105,783 | -7% |
31 Properties |
| 1996 | £112,996 | 21% |
16 Properties |
| 1995 | £89,689 | - |
19 Properties |
Property Price per Property Type in Newby
Here you can find historic sold price data in order to help with your property search.
The average Property Paid Price for specific property types in the last three years are:
| Property Type | Average Sold Price | Sold Properties |
|---|---|---|
| Semi Detached House | £318,992.00 | 14 Semi Detached Houses |
| Terraced House | £335,883.00 | 9 Terraced Houses |
| Detached House | £636,804.00 | 22 Detached Houses |

