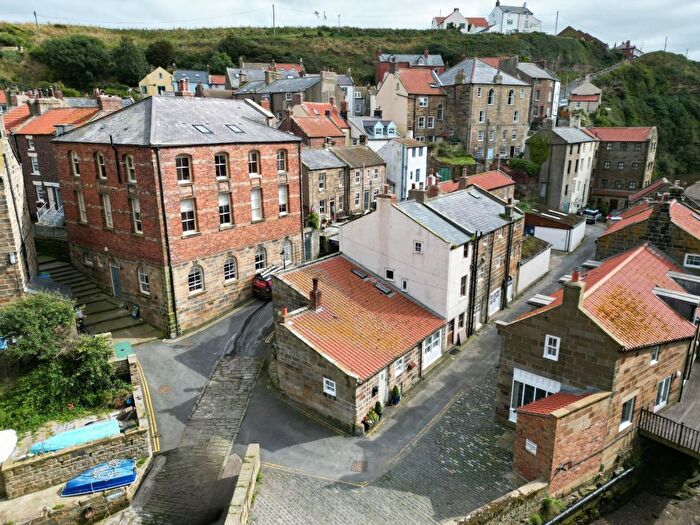
Houses for sale & to rent in Mulgrave, Saltburn-by-the-sea
House Prices in Mulgrave
Properties in Mulgrave have an average house price of £303,142.00 and had 133 Property Transactions within the last 3 years¹.
Mulgrave is an area in Saltburn-by-the-sea, North Yorkshire with 914 households², where the most expensive property was sold for £1,850,000.00.
Properties for sale in Mulgrave
Previously listed properties in Mulgrave
Roads and Postcodes in Mulgrave
Navigate through our locations to find the location of your next house in Mulgrave, Saltburn-by-the-sea for sale or to rent.
| Streets | Postcodes |
|---|---|
| Abram Lane | TS13 5BX |
| Bank Top Lane | TS13 5JF |
| Barbers Yard | TS13 5BP |
| Barras Square | TS13 5DF |
| Beckside | TS13 5BU |
| Beckstones | TS13 5BS |
| Boathouse Yard | TS13 5BN |
| Broom Hill | TS13 5DL |
| Browns Terrace | TS13 5BG TS13 5HE TS13 5HG |
| Captain Cooks Close | TS13 5AP |
| Church Street | TS13 5DB |
| Cliff Cottages | TS13 5LQ |
| Cliff Road | TS13 5AE TS13 5AF |
| Coronation Avenue | TS13 5HA TS13 5HB |
| Dalehouse | TS13 5DT |
| Dalehouse Bank | TS13 5AN |
| Darlington Terrace | TS13 5DJ |
| Ellerby Lane | TS13 5HS |
| Elliotts Yard | TS13 5BJ |
| Fairfield Road | TS13 5BA |
| Garth Ends | TS13 5BW |
| Gunn Gutter | TS13 5DD |
| High Barrass | TS13 5DE |
| High Street | TS13 5BH TS13 5BQ TS13 5ES TS13 5ET TS13 5HQ TS13 5HX TS13 5JH TS13 5JX |
| Hinderwell Lane | TS13 5HR |
| Lingrow Close | TS13 5JQ |
| Long Row | TS13 5LF |
| Low Lane | TS13 5LY |
| Manns Yard | TS13 5BL |
| Moor View | TS13 5HH |
| Mount Pleasant | TS13 5DG |
| Nettledale Close | TS13 5JE |
| Palmers Square | TS13 5JU |
| Pond Farm Close | TS13 5HJ |
| Porret Lane | TS13 5JS TS13 5JT TS13 5JW |
| Ridge Lane | TS13 4TS TS13 5DX |
| Rosedale Lane | TS13 5JZ TS13 5LB TS13 5LD TS13 5LE |
| Rosehill | TS13 5EU |
| Runswick Lane | TS13 5HP TS13 5HW |
| Ryeland Lane | TS13 5LP |
| Seaton Close | TS13 5AU TS13 5AX |
| Seaton Crescent | TS13 5AY TS13 5AZ |
| Seaton Garth | TS13 5DH |
| Slippery Hill | TS13 5DQ |
| Staithes Lane | TS13 5AD TS13 5AG TS13 5AH TS13 5AJ |
| The Bungalows | TS13 5LG |
| The Lane | TS13 5LT TS13 5LU TS13 5LX |
| The Old Stubble | TS13 5AA |
| The Warren | TS13 5JL |
| Upgarth Close | TS13 5JG |
| Wesley Square | TS13 5BT |
| West End Close | TS13 5JP |
| Whitby Road | TS13 5AL TS13 5AR |
| TS13 5EG TS13 5EN TS13 5HT TS13 5HU TS13 5NF |
Transport near Mulgrave
-
Lealholm Station
-
Glaisdale Station
-
Egton Station
-
Danby Station
-
Sleights Station
-
Grosmont Station
-
Whitby Station
-
Ruswarp Station
-
Saltburn Station
-
Castleton Moor Station
- FAQ
- Price Paid By Year
- Property Type Price
Frequently asked questions about Mulgrave
What is the average price for a property for sale in Mulgrave?
The average price for a property for sale in Mulgrave is £303,142. This amount is 0.32% higher than the average price in Saltburn-by-the-sea. There are 186 property listings for sale in Mulgrave.
What streets have the most expensive properties for sale in Mulgrave?
The streets with the most expensive properties for sale in Mulgrave are Ellerby Lane at an average of £532,500, The Lane at an average of £519,166 and Ryeland Lane at an average of £510,278.
What streets have the most affordable properties for sale in Mulgrave?
The streets with the most affordable properties for sale in Mulgrave are Seaton Crescent at an average of £147,328, Captain Cooks Close at an average of £156,000 and Broom Hill at an average of £167,500.
Which train stations are available in or near Mulgrave?
Some of the train stations available in or near Mulgrave are Lealholm, Glaisdale and Egton.
Property Price Paid in Mulgrave by Year
The average sold property price by year was:
| Year | Average Sold Price | Price Change |
Sold Properties
|
|---|---|---|---|
| 2025 | £246,547 | -28% |
20 Properties |
| 2024 | £315,551 | -5% |
33 Properties |
| 2023 | £330,444 | 12% |
42 Properties |
| 2022 | £291,976 | 20% |
38 Properties |
| 2021 | £233,437 | 6% |
48 Properties |
| 2020 | £218,422 | 15% |
44 Properties |
| 2019 | £186,710 | -14% |
32 Properties |
| 2018 | £213,670 | 8% |
45 Properties |
| 2017 | £195,667 | 6% |
35 Properties |
| 2016 | £183,166 | -1% |
42 Properties |
| 2015 | £184,406 | -6% |
54 Properties |
| 2014 | £195,592 | 2% |
56 Properties |
| 2013 | £191,116 | 10% |
38 Properties |
| 2012 | £172,172 | -16% |
27 Properties |
| 2011 | £199,898 | 11% |
35 Properties |
| 2010 | £178,605 | 4% |
26 Properties |
| 2009 | £171,976 | -12% |
38 Properties |
| 2008 | £192,543 | -3% |
40 Properties |
| 2007 | £198,786 | 1% |
53 Properties |
| 2006 | £197,248 | 14% |
77 Properties |
| 2005 | £169,897 | 9% |
58 Properties |
| 2004 | £154,853 | 20% |
56 Properties |
| 2003 | £123,142 | 22% |
54 Properties |
| 2002 | £96,562 | 25% |
76 Properties |
| 2001 | £72,806 | 14% |
53 Properties |
| 2000 | £62,311 | 1% |
62 Properties |
| 1999 | £61,878 | -2% |
76 Properties |
| 1998 | £63,065 | -2% |
62 Properties |
| 1997 | £64,255 | 15% |
43 Properties |
| 1996 | £54,357 | 4% |
47 Properties |
| 1995 | £52,316 | - |
37 Properties |
Property Price per Property Type in Mulgrave
Here you can find historic sold price data in order to help with your property search.
The average Property Paid Price for specific property types in the last three years are:
| Property Type | Average Sold Price | Sold Properties |
|---|---|---|
| Semi Detached House | £246,383.00 | 50 Semi Detached Houses |
| Detached House | £514,181.00 | 30 Detached Houses |
| Terraced House | £247,768.00 | 44 Terraced Houses |
| Flat | £185,722.00 | 9 Flats |

