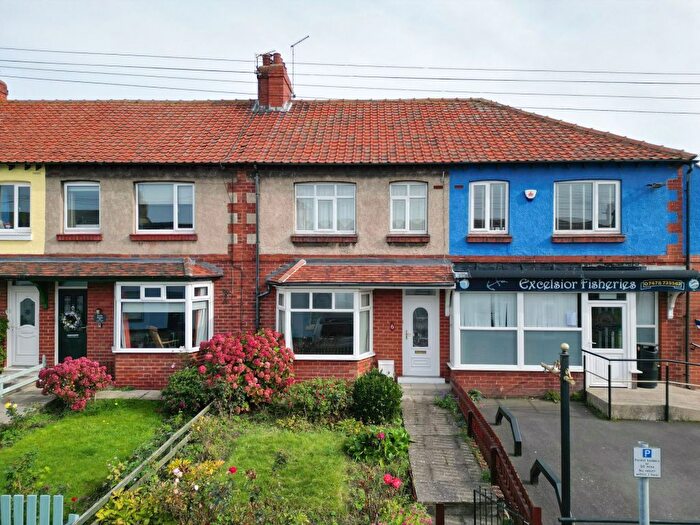
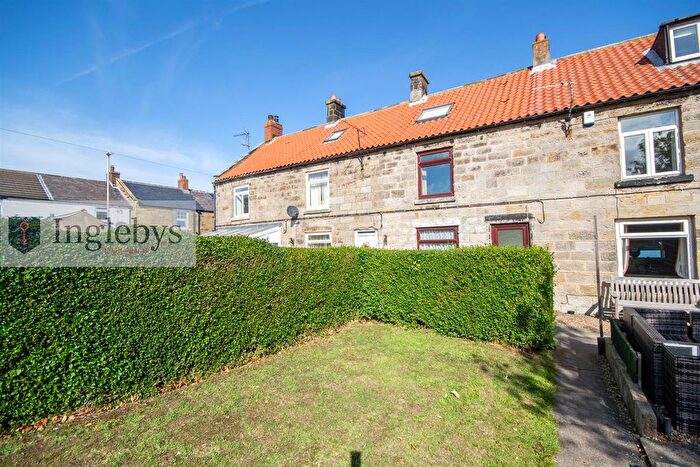
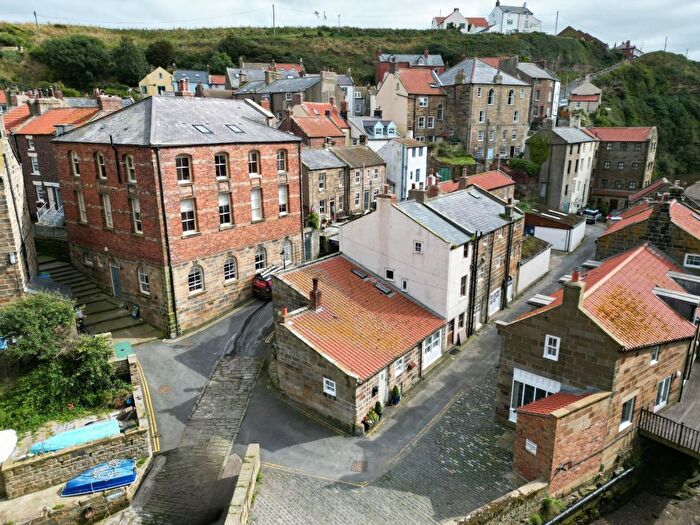
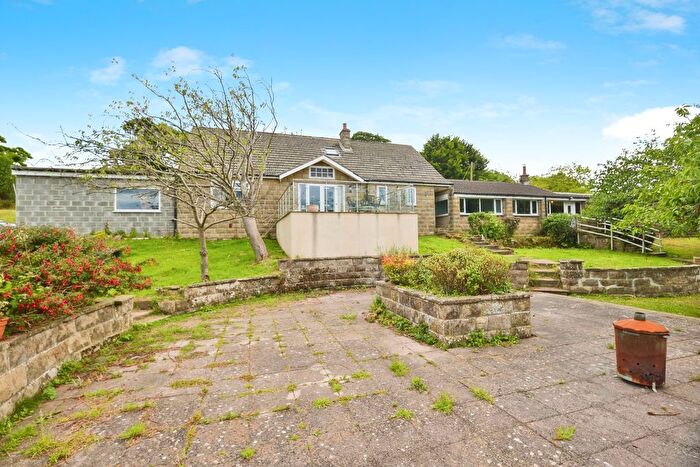
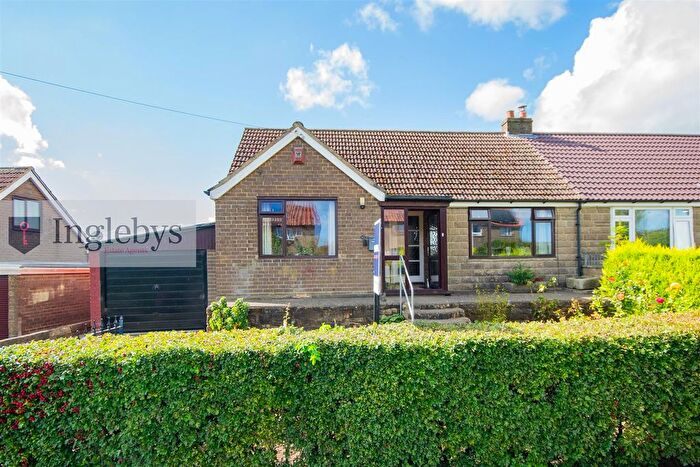
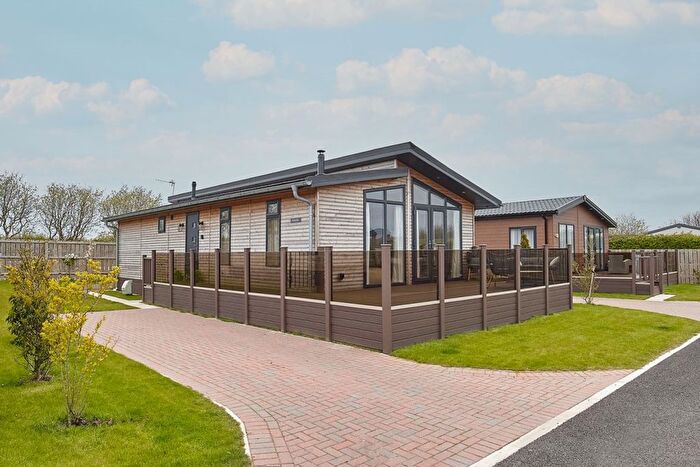
Houses for sale & to rent in Danby & Mulgrave, Saltburn-by-the-sea
House Prices in Danby & Mulgrave
Properties in Danby & Mulgrave have an average house price of £258,205.00 and had 3 Property Transactions within the last 3 years¹.
Danby & Mulgrave is an area in Saltburn-by-the-sea, North Yorkshire with 122 households², where the most expensive property was sold for £422,117.00.
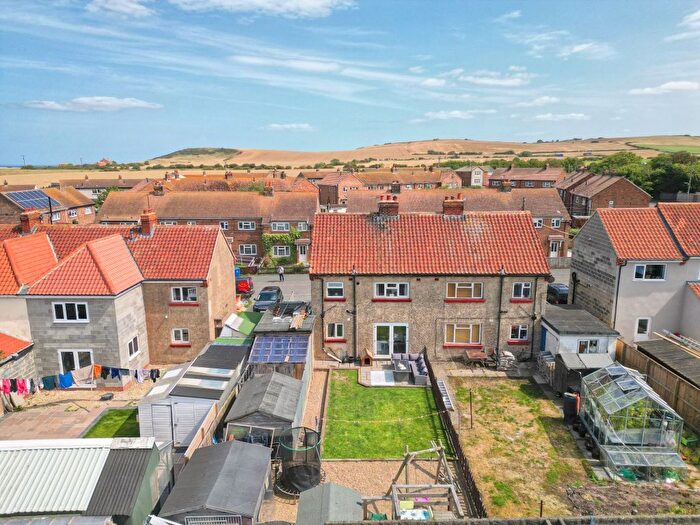
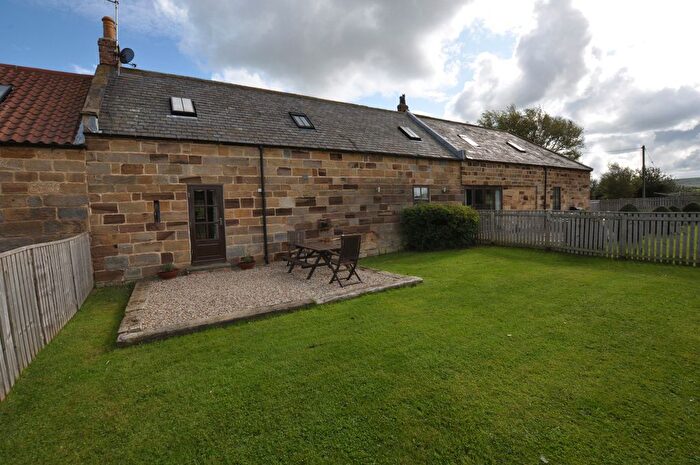
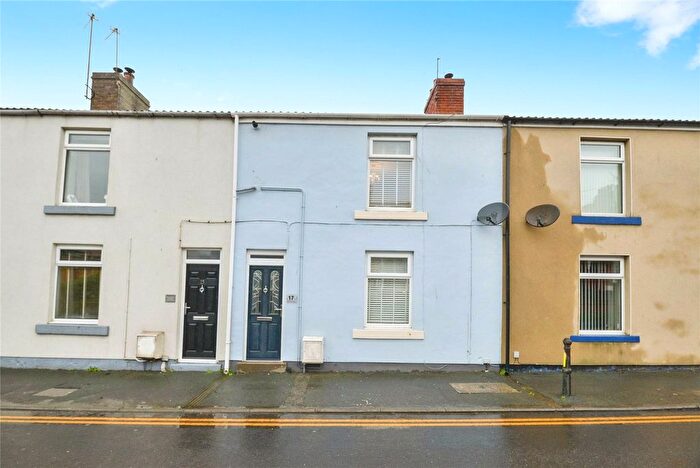
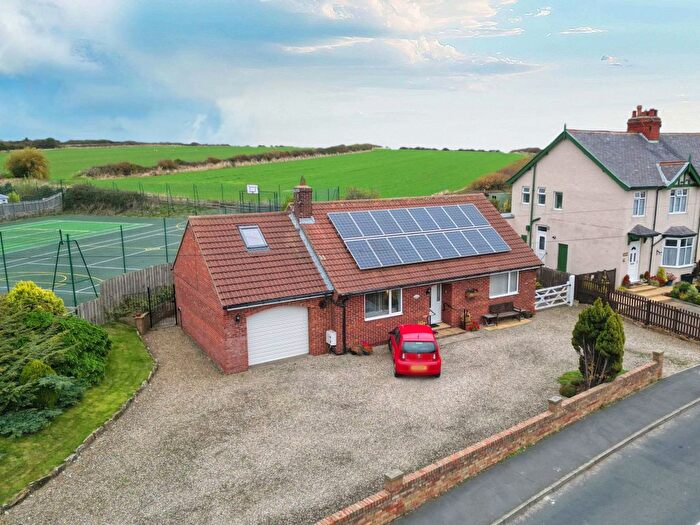
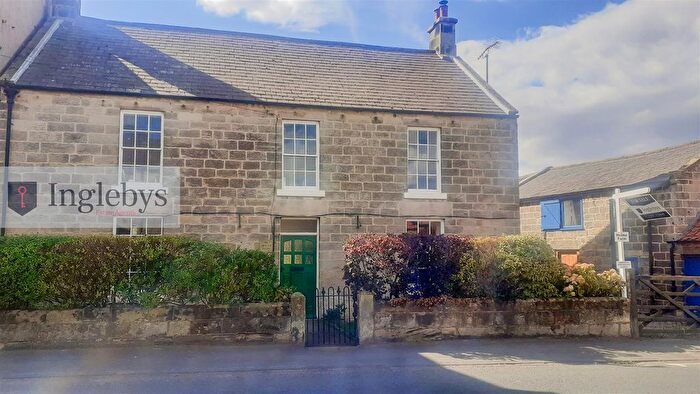
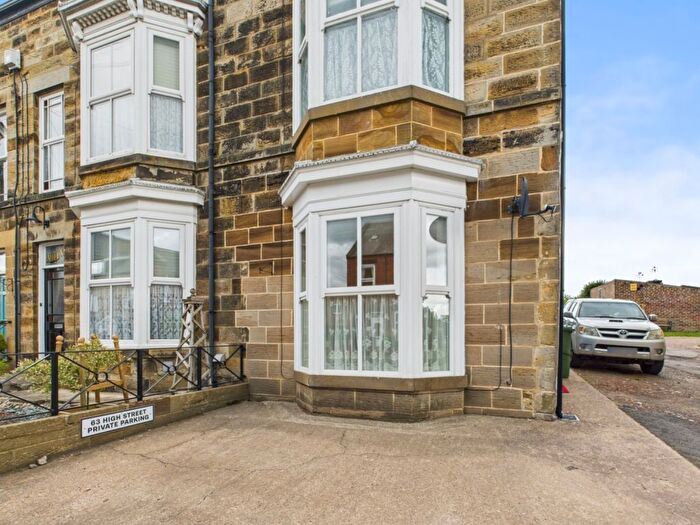
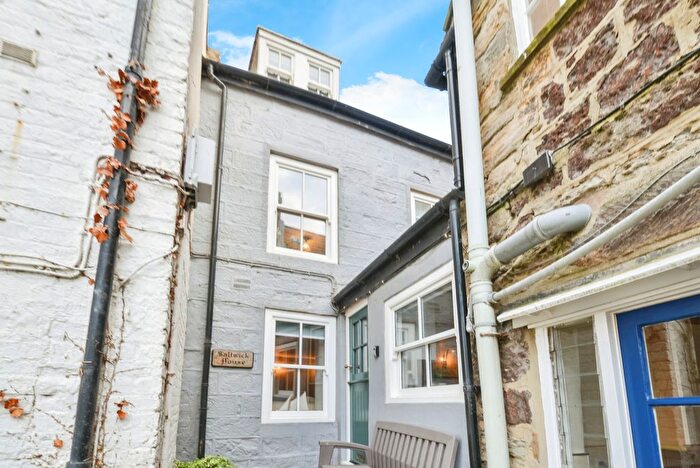
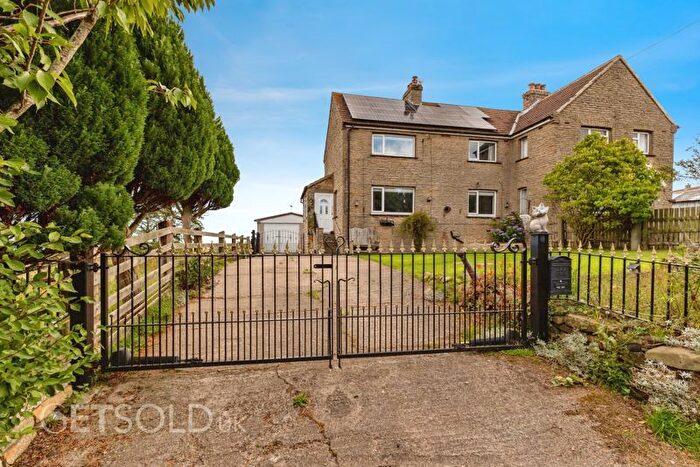
Properties for sale in Danby & Mulgrave
Previously listed properties in Danby & Mulgrave
Roads and Postcodes in Danby & Mulgrave
Navigate through our locations to find the location of your next house in Danby & Mulgrave, Saltburn-by-the-sea for sale or to rent.
| Streets | Postcodes |
|---|---|
| Back Lane | TS13 5JR |
| Borrowby Lane | TS13 5BD |
| Captain Cooks Close | TS13 5AW |
| Endeavour Close | TS13 5AS |
| Far Rosedale | TS13 5LH |
| Hildewell | TS13 5HD |
| Moor View Court | TS13 5HN |
| Palmers Close | TS13 5AQ |
| Station View Industrial Park | TS13 5ER |
| Sunny Row | TS13 5LA |
| Whitegate Close | TS13 5BB |
| TS13 4TT TS13 4TU TS13 4TX TS13 5AT TS13 5DU TS13 5DZ TS13 5EA TS13 5EB TS13 5ED TS13 5EE TS13 5EF TS13 5EH TS13 5EJ TS13 5EL TS13 5EQ TS13 5HF TS13 5HY TS13 5HZ TS13 5JA TS13 5JB TS13 5JD TS13 5LR TS13 5LS TS13 5LZ TS13 5NA TS13 5NB TS13 5ND TS13 5NE |
Transport near Danby & Mulgrave
-
Lealholm Station
-
Glaisdale Station
-
Danby Station
-
Egton Station
-
Grosmont Station
-
Sleights Station
-
Castleton Moor Station
-
Whitby Station
-
Ruswarp Station
-
Commondale Station
- FAQ
- Price Paid By Year
- Property Type Price
Frequently asked questions about Danby & Mulgrave
What is the average price for a property for sale in Danby & Mulgrave?
The average price for a property for sale in Danby & Mulgrave is £258,205. This amount is 15% lower than the average price in Saltburn-by-the-sea. There are 192 property listings for sale in Danby & Mulgrave.
Which train stations are available in or near Danby & Mulgrave?
Some of the train stations available in or near Danby & Mulgrave are Lealholm, Glaisdale and Danby.
Property Price Paid in Danby & Mulgrave by Year
The average sold property price by year was:
| Year | Average Sold Price | Price Change |
Sold Properties
|
|---|---|---|---|
| 2024 | £77,500 | -255% |
1 Property |
| 2023 | £275,000 | -53% |
1 Property |
| 2022 | £422,117 | 83% |
1 Property |
| 2021 | £70,000 | -79% |
1 Property |
| 2018 | £125,000 | -14% |
1 Property |
| 2016 | £142,833 | - |
3 Properties |
Property Price per Property Type in Danby & Mulgrave
Here you can find historic sold price data in order to help with your property search.
The average Property Paid Price for specific property types in the last three years are:
| Property Type | Average Sold Price | Sold Properties |
|---|---|---|
| Terraced House | £176,250.00 | 2 Terraced Houses |
| Detached House | £422,117.00 | 1 Detached House |

