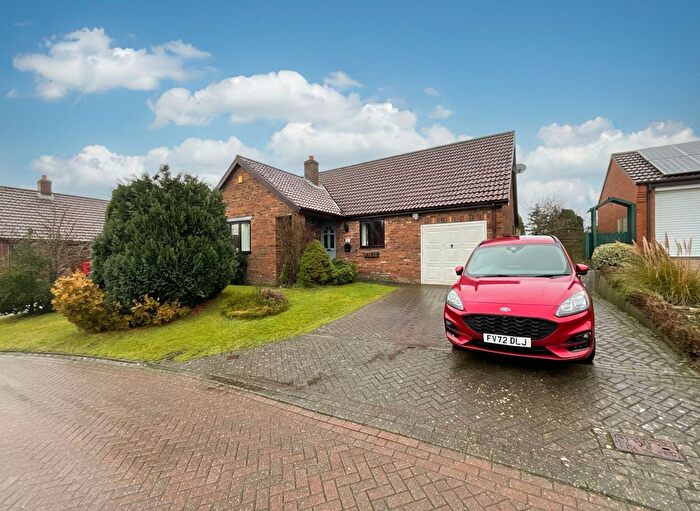
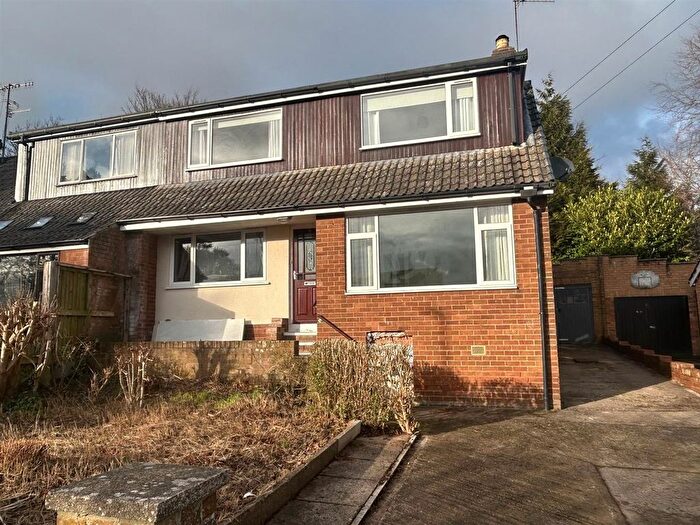
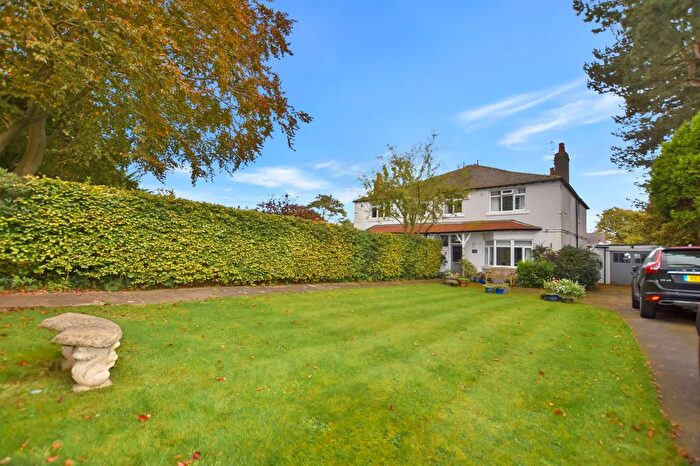
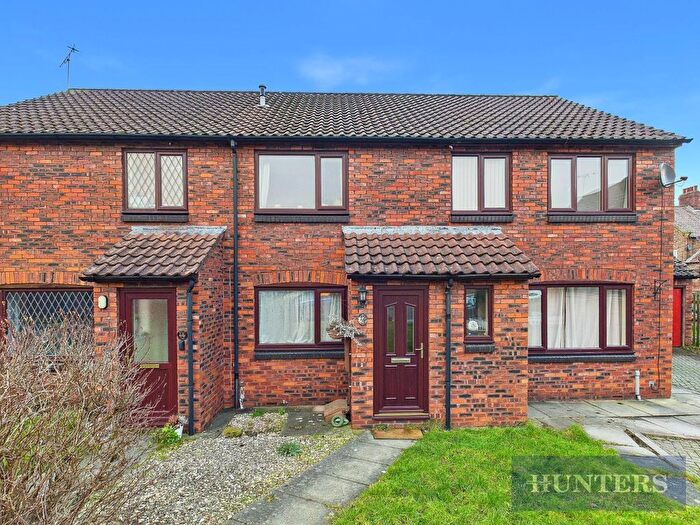
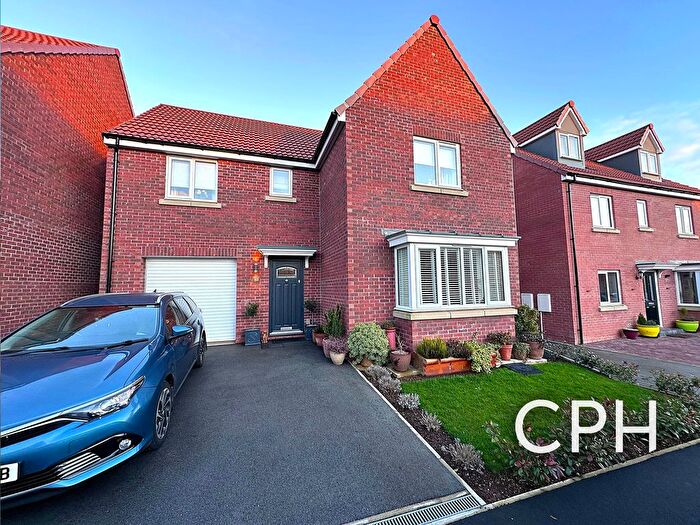
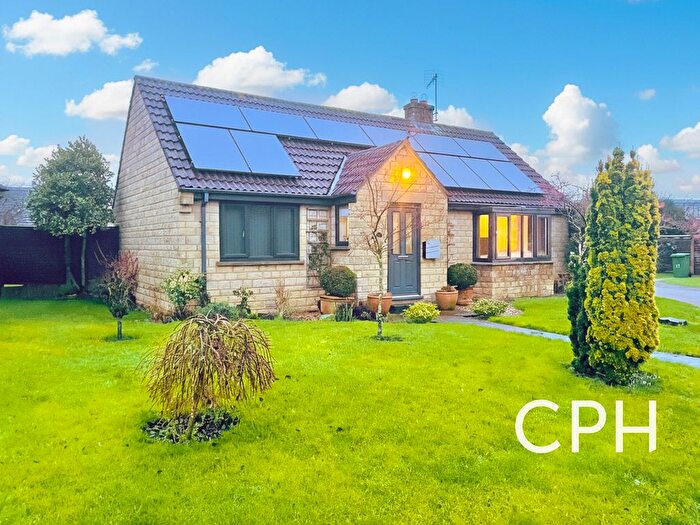
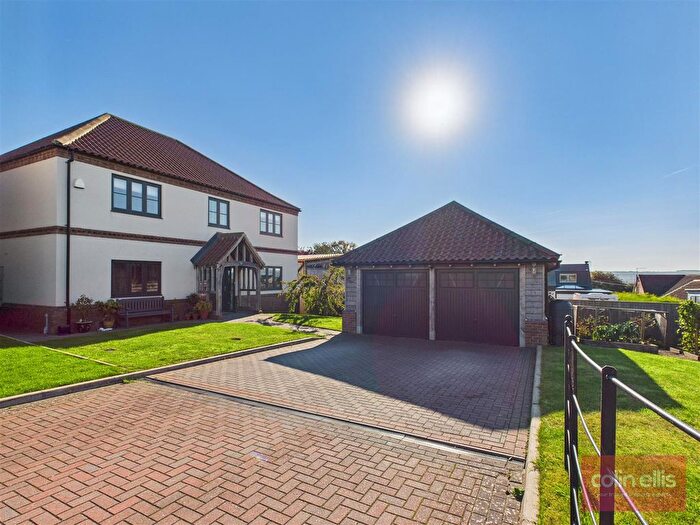
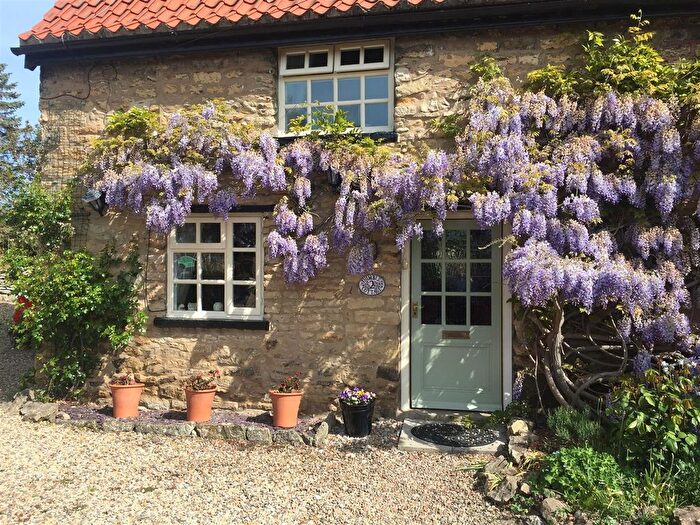
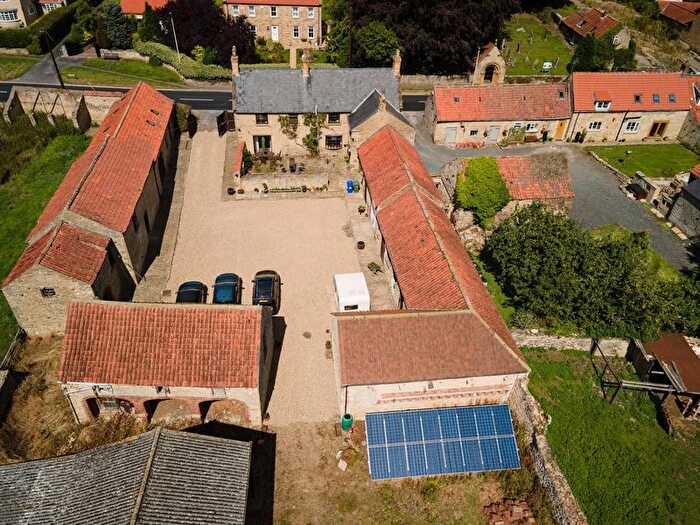
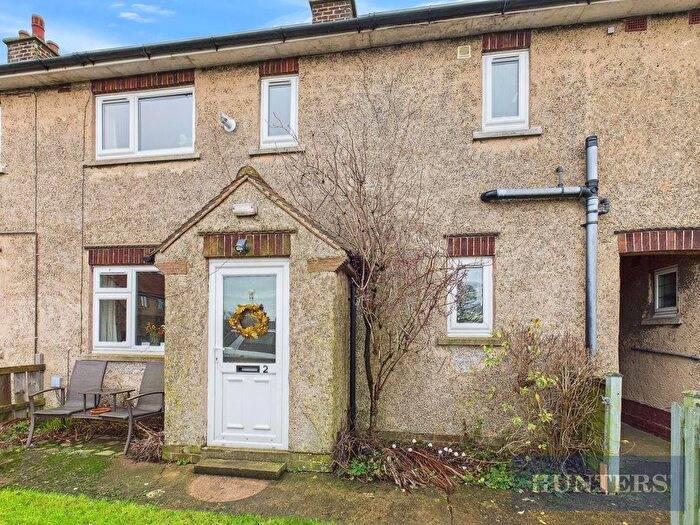
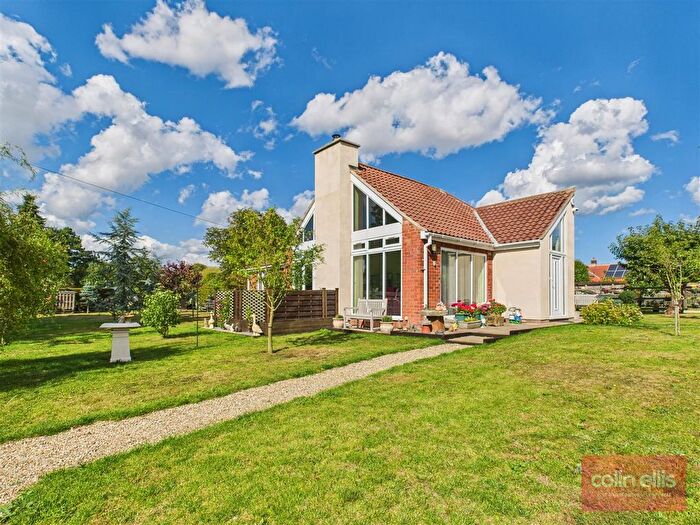
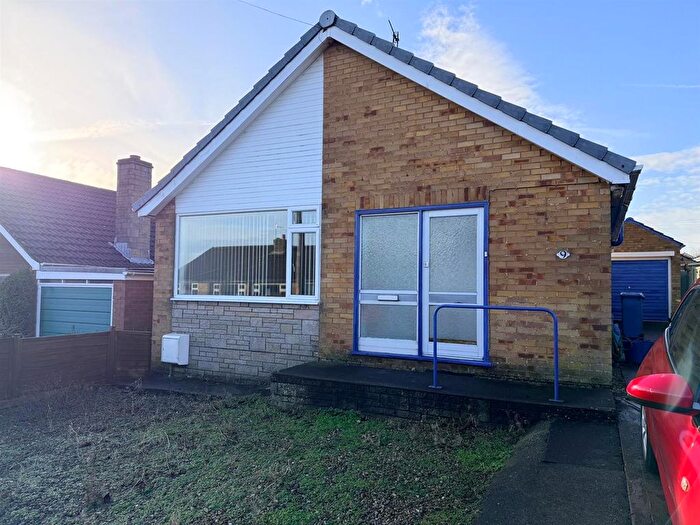
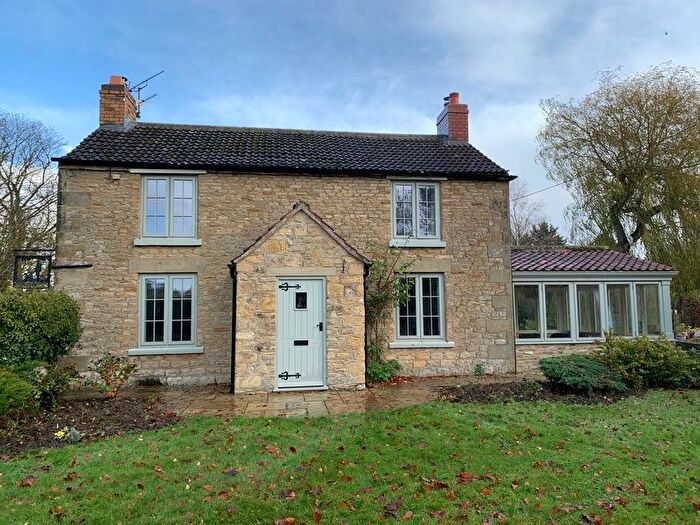
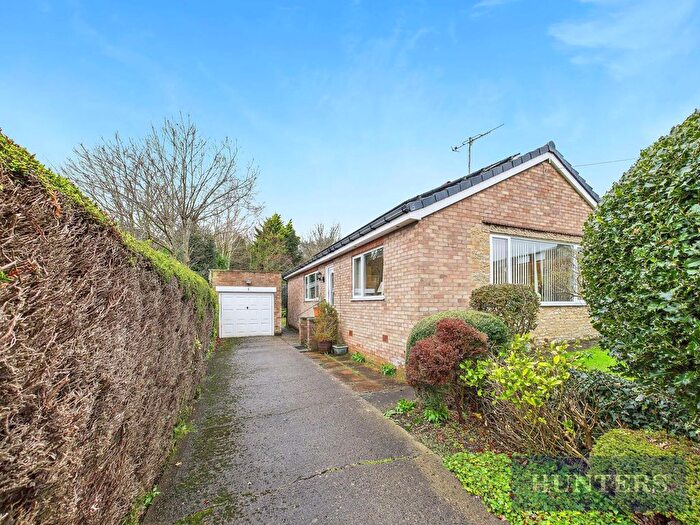
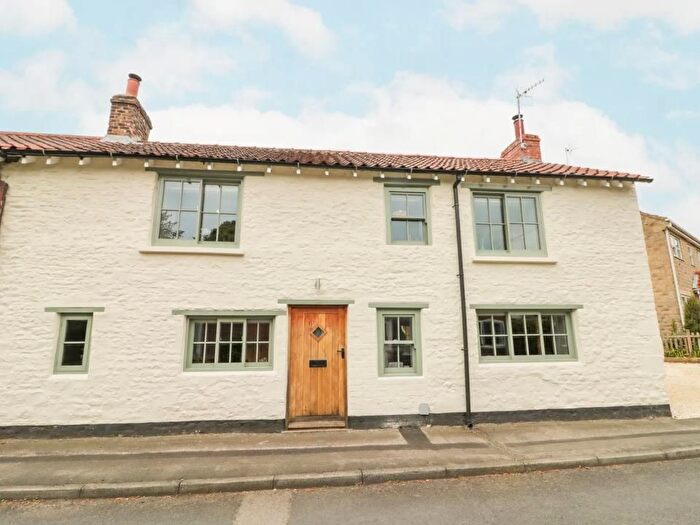
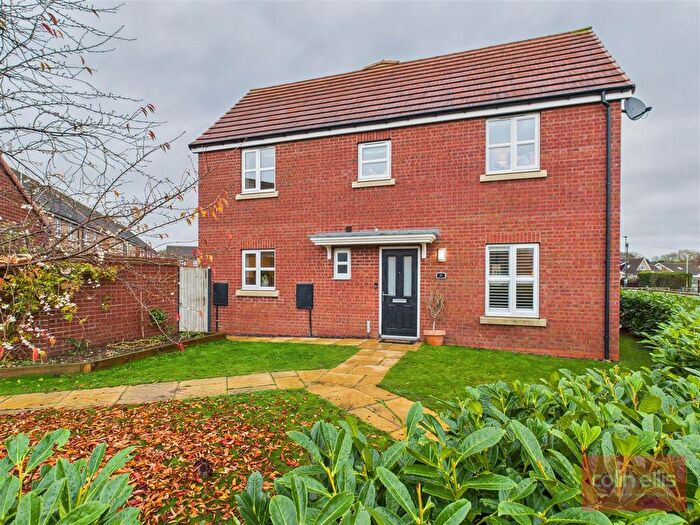
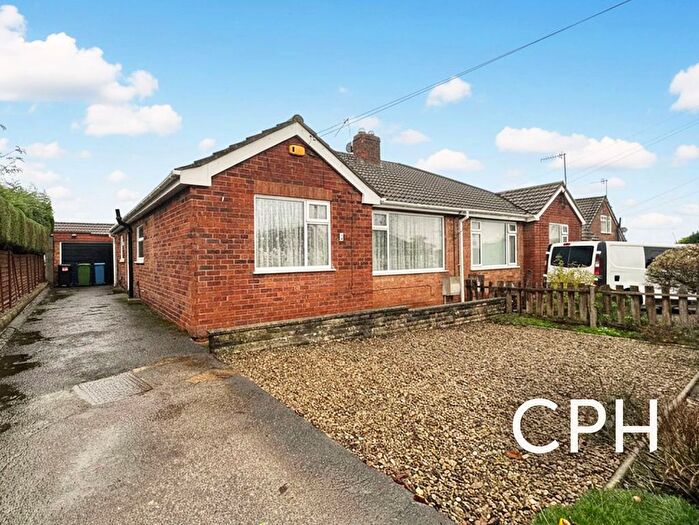
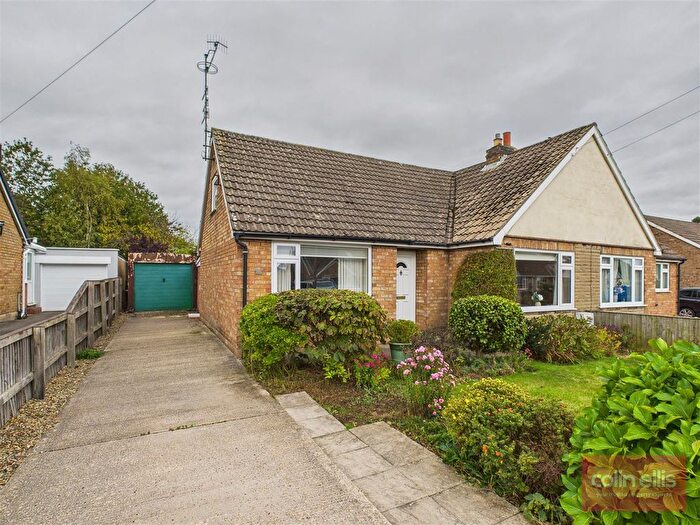
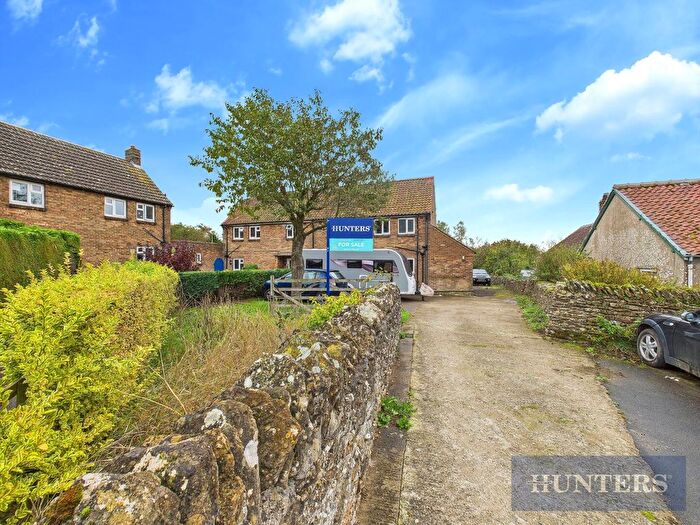
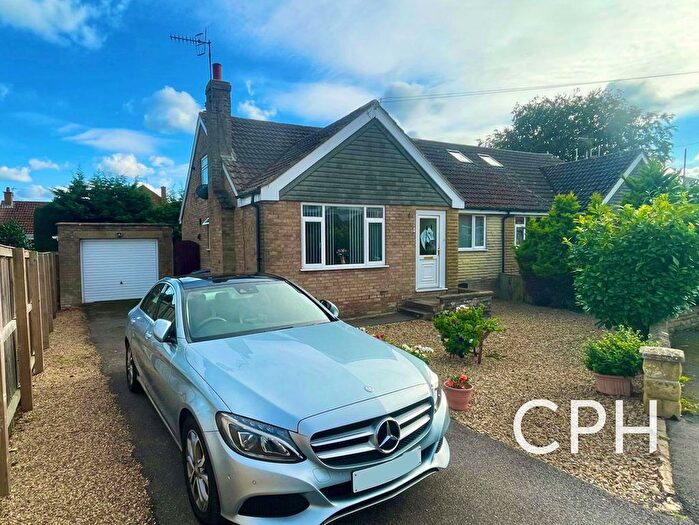
Houses for sale & to rent in Derwent Valley, Scarborough
House Prices in Derwent Valley
Properties in Derwent Valley have an average house price of £333,472.00 and had 168 Property Transactions within the last 3 years¹.
Derwent Valley is an area in Scarborough, North Yorkshire with 1,830 households², where the most expensive property was sold for £1,750,000.00.
Properties for sale in Derwent Valley
Previously listed properties in Derwent Valley
Roads and Postcodes in Derwent Valley
Navigate through our locations to find the location of your next house in Derwent Valley, Scarborough for sale or to rent.
| Streets | Postcodes |
|---|---|
| Alexander Avenue | YO13 9EX |
| Barkers Lane | YO13 9BG |
| Beech Lane | YO13 9JG |
| Beswicks Yard | YO13 9AT |
| Betton Rise | YO13 9HU |
| Broadlands Drive | YO13 9ET |
| Broughton Road | YO13 9JW |
| Byefield Grove | YO13 9ES |
| Candler Avenue | YO13 9JN |
| Carr Lane | YO13 9DH YO13 9HW |
| Castle Lane | YO13 9EN |
| Castle Rise | YO13 9JY |
| Castlegate | YO13 9EJ |
| Cayley Lane | YO13 9DL |
| Chantry Drive | YO13 9EY |
| Chantry Road | YO13 9EP YO13 9ER |
| Chapel Garth | YO13 9HH |
| Chapel Lane | YO13 9DZ |
| Church Lane | YO13 9DN |
| Cockrah Road | YO13 9JD |
| Conyers Ings | YO13 9LG |
| Croft Lane | YO13 9BH |
| Dale End | YO13 9LR |
| Dreaken Fold | YO13 9JR |
| Farside Road | YO13 9LE |
| Foulbridge Lane | YO13 9AY |
| Garage Yard | YO13 9DF |
| Garth Cottages | YO13 9EA |
| Garth End Road | YO13 9JH YO13 9JJ |
| Great Moor Lane | YO13 9LW |
| Green Lane | YO13 9BL |
| Hall Garth Lane | YO13 9JA YO13 9JB |
| Hewley Drive | YO13 9JL |
| High Street | YO13 9AE YO13 9AJ YO13 9AL YO13 9AN YO13 9DA |
| Hungate | YO13 9DW |
| Ings Lane | YO13 9DR YO13 9DS |
| Lairs Crescent | YO13 9BQ |
| Lairs Lane | YO13 9AH |
| Lonsdale Place | YO13 9HS |
| Low Lane | YO13 9DX |
| Main Road | YO13 9DP |
| Main Street | YO13 9DY YO13 9HJ YO13 9HL YO13 9LL YO13 9LN YO13 9LT |
| Meadow Dene | YO13 9EL |
| Meadow Drive | YO13 9EZ |
| Middle Lane | YO13 9AX YO13 9LP |
| Mill Lane | YO13 9JT |
| Moor Lane | YO13 9EW |
| Morley Drive | YO13 9LF |
| Nettledale Lane | YO13 9PW |
| Northmoor | YO13 9QH |
| Northmoor Cottages | YO13 9QQ |
| Pearson Garth | YO13 9LH |
| Pickering Road | YO13 9JE |
| Pickering Road East | YO13 9AF |
| Pickering Road West | YO13 9PL |
| Pudding Lane | YO13 9AS |
| Racecourse Road | YO13 9HP YO13 9HT |
| Sawdon Lane | YO13 9DT |
| Seamer Road | YO13 9HN |
| Seavegate | YO13 9HA |
| Shelton Avenue | YO13 9HB |
| Station Close | YO13 9JQ |
| Station Road | YO13 9AP |
| The Butts | YO13 9DJ |
| The Close | YO13 9HR |
| The Mount | YO13 9JS |
| The Nurseries | YO13 9HZ |
| The Orchard | YO13 9AU |
| Undercliffe | YO13 9PX |
| Uplands Avenue | YO13 9EU |
| West Acres Close | YO13 9LJ |
| West Brow | YO13 9DE |
| West End | YO13 9DQ |
| West Lane | YO13 9AR |
| Wilkinsons Close | YO13 9LQ |
| Wilsons Lane | YO13 9HY |
| Wydale | YO13 9DG |
| Wydale Rise | YO13 9AG YO13 9AQ |
| Wykeham Lane | YO13 9QG |
| Yedmandale Road | YO13 9JP |
| Yedmandale Terrace | YO13 9JU |
| YO13 9BA YO13 9DU YO13 9EB YO13 9PR YO13 9PS YO13 9QE |
Transport near Derwent Valley
- FAQ
- Price Paid By Year
- Property Type Price
Frequently asked questions about Derwent Valley
What is the average price for a property for sale in Derwent Valley?
The average price for a property for sale in Derwent Valley is £333,472. This amount is 62% higher than the average price in Scarborough. There are 390 property listings for sale in Derwent Valley.
What streets have the most expensive properties for sale in Derwent Valley?
The streets with the most expensive properties for sale in Derwent Valley are Wykeham Lane at an average of £715,000, Barkers Lane at an average of £710,000 and The Butts at an average of £685,000.
What streets have the most affordable properties for sale in Derwent Valley?
The streets with the most affordable properties for sale in Derwent Valley are Candler Avenue at an average of £185,500, Chantry Drive at an average of £193,500 and Wydale Rise at an average of £202,500.
Which train stations are available in or near Derwent Valley?
Some of the train stations available in or near Derwent Valley are Seamer, Scarborough and Filey.
Property Price Paid in Derwent Valley by Year
The average sold property price by year was:
| Year | Average Sold Price | Price Change |
Sold Properties
|
|---|---|---|---|
| 2025 | £357,453 | 2% |
48 Properties |
| 2024 | £350,989 | 14% |
56 Properties |
| 2023 | £300,159 | -1% |
64 Properties |
| 2022 | £303,856 | 13% |
69 Properties |
| 2021 | £264,175 | 11% |
77 Properties |
| 2020 | £236,260 | 5% |
73 Properties |
| 2019 | £225,160 | -11% |
64 Properties |
| 2018 | £249,492 | 7% |
75 Properties |
| 2017 | £232,016 | 7% |
77 Properties |
| 2016 | £216,507 | -3% |
85 Properties |
| 2015 | £222,373 | 5% |
59 Properties |
| 2014 | £210,615 | 3% |
56 Properties |
| 2013 | £204,988 | -2% |
63 Properties |
| 2012 | £208,757 | 2% |
62 Properties |
| 2011 | £205,394 | -0,5% |
55 Properties |
| 2010 | £206,381 | 6% |
59 Properties |
| 2009 | £193,033 | -13% |
43 Properties |
| 2008 | £217,431 | 0,2% |
46 Properties |
| 2007 | £216,936 | -4% |
83 Properties |
| 2006 | £226,074 | 19% |
90 Properties |
| 2005 | £183,983 | -15% |
64 Properties |
| 2004 | £212,206 | 26% |
75 Properties |
| 2003 | £157,008 | 25% |
84 Properties |
| 2002 | £117,942 | 13% |
106 Properties |
| 2001 | £102,367 | 7% |
110 Properties |
| 2000 | £94,874 | 15% |
80 Properties |
| 1999 | £80,447 | -4% |
116 Properties |
| 1998 | £83,729 | 7% |
80 Properties |
| 1997 | £77,480 | 12% |
82 Properties |
| 1996 | £67,871 | -16% |
98 Properties |
| 1995 | £78,959 | - |
66 Properties |
Property Price per Property Type in Derwent Valley
Here you can find historic sold price data in order to help with your property search.
The average Property Paid Price for specific property types in the last three years are:
| Property Type | Average Sold Price | Sold Properties |
|---|---|---|
| Semi Detached House | £228,533.00 | 59 Semi Detached Houses |
| Detached House | £445,106.00 | 79 Detached Houses |
| Terraced House | £245,883.00 | 30 Terraced Houses |

