
Houses for sale in Scarborough, North Yorkshire
House Prices in Scarborough
Properties in Scarborough have an average house price of £206k and had 3,971 Property Transactions within the last 3 years.¹
Scarborough is an area in North Yorkshire with 34,900 households², where the most expensive property was sold for £1.75M.
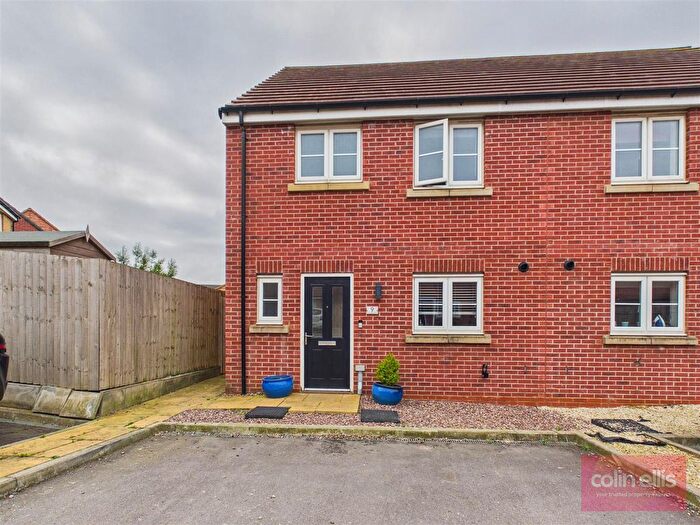
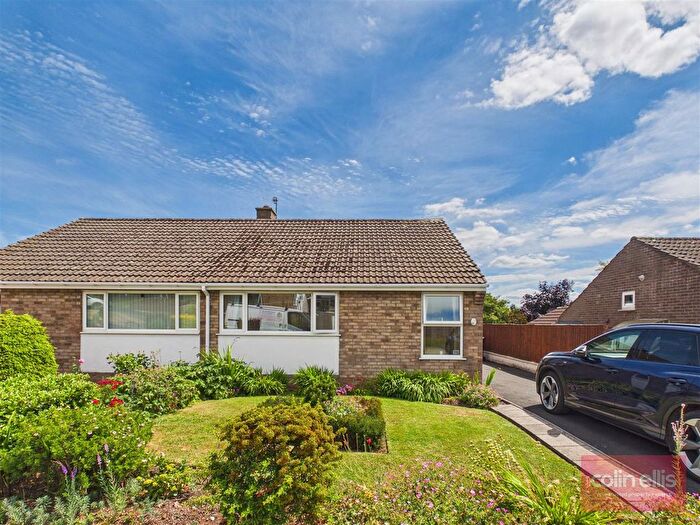
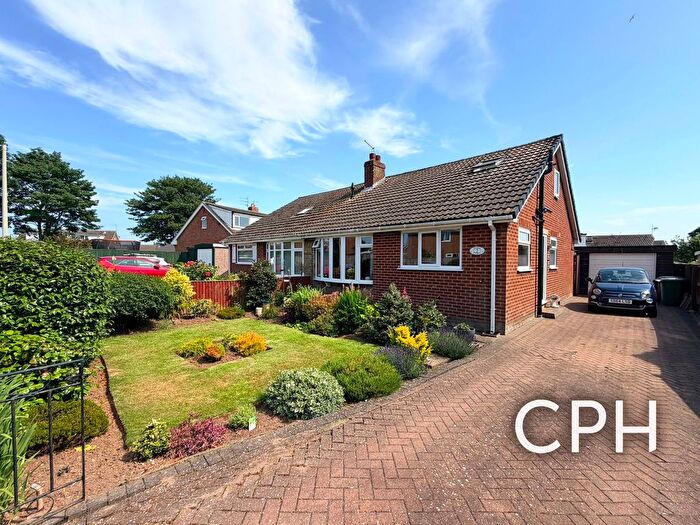
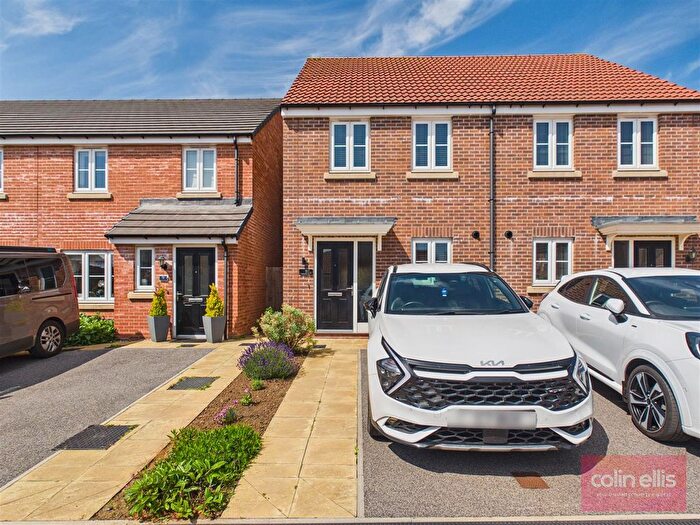
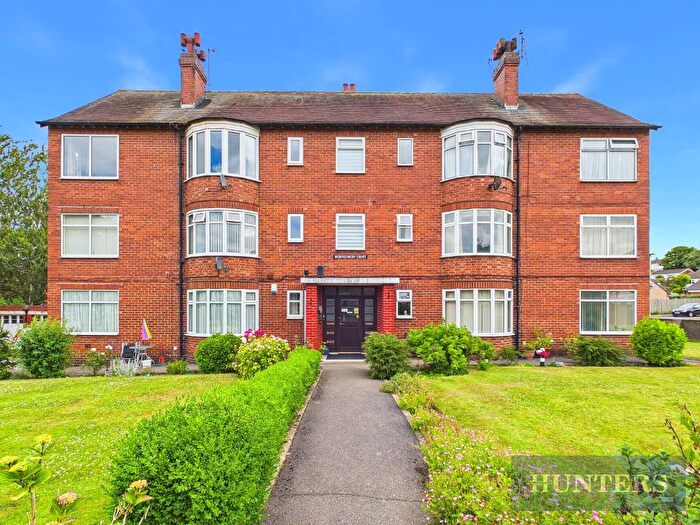
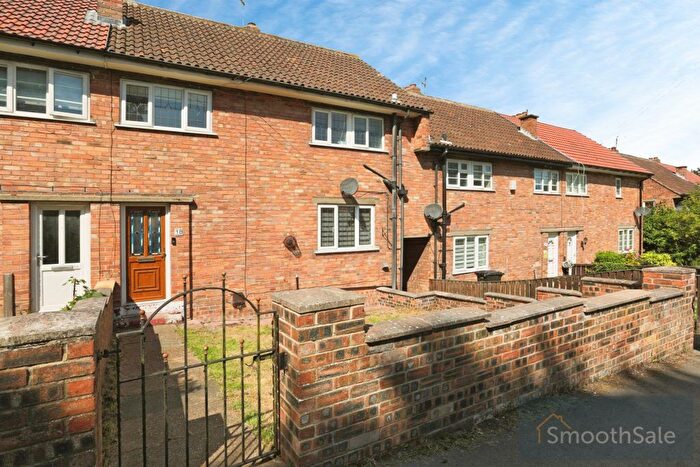
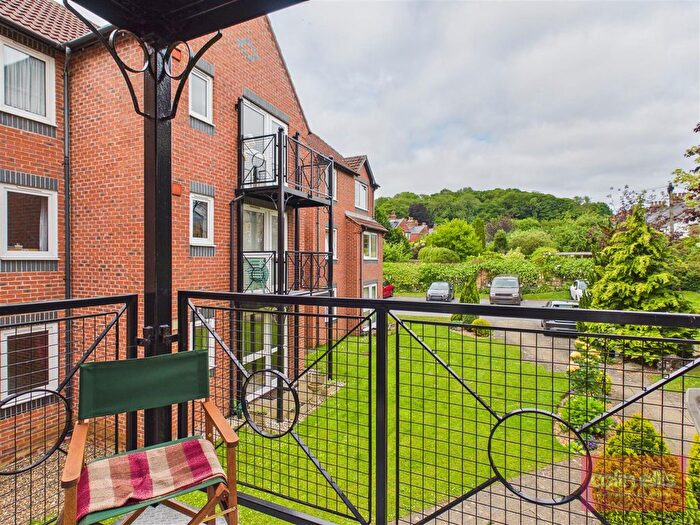
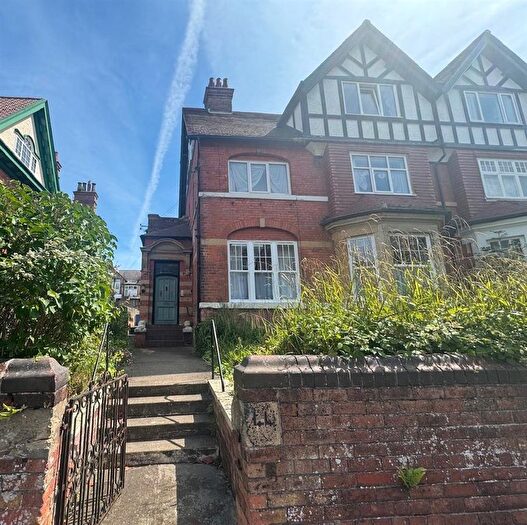
Properties for sale in Scarborough
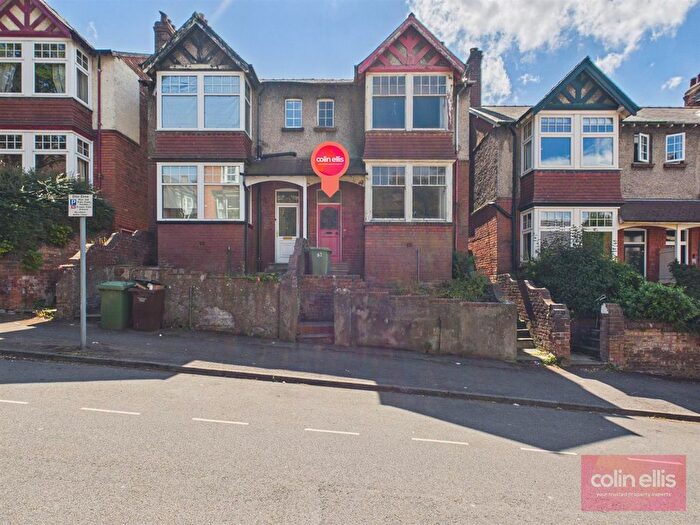
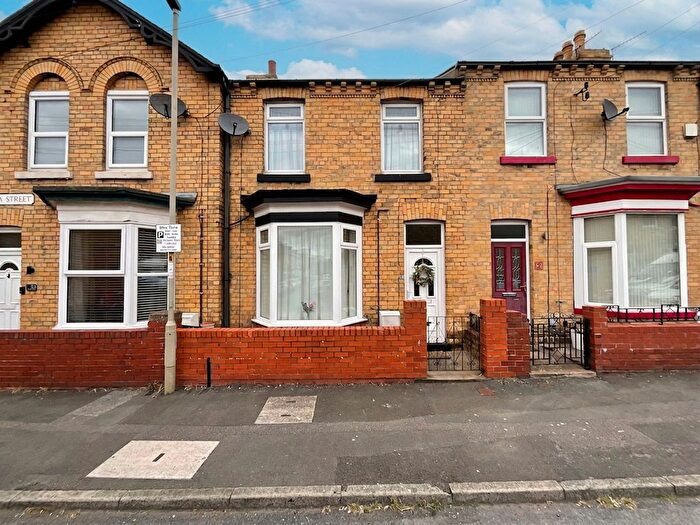
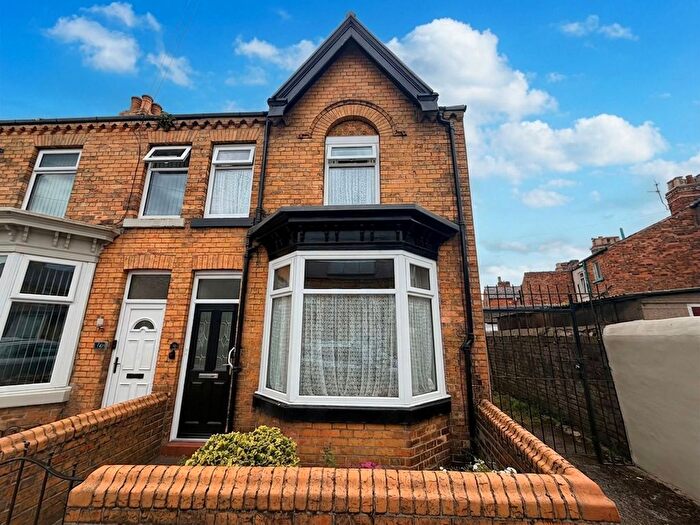
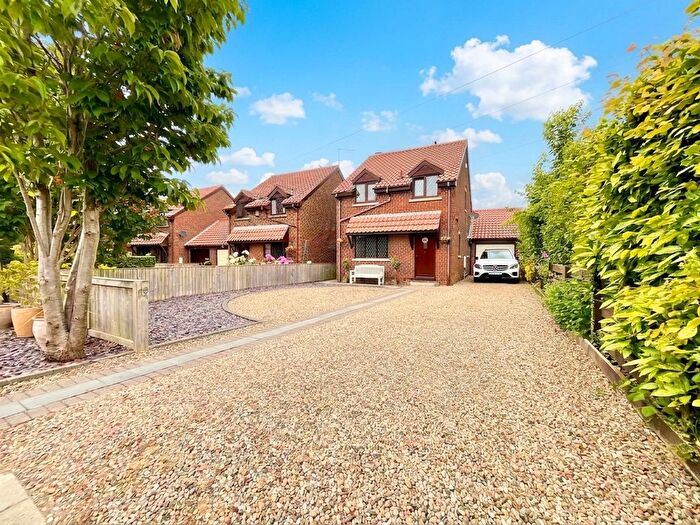
![]()
If you are looking to sell your house, let it out, or receive a property valuation, an expert can help you.
Click the button below to get started.
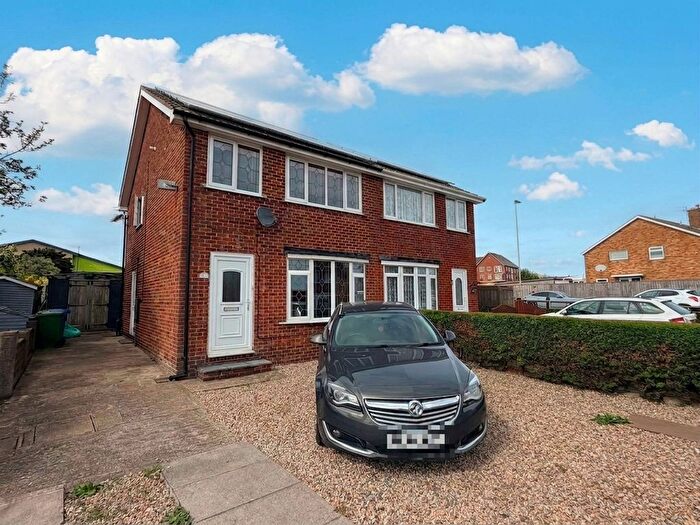
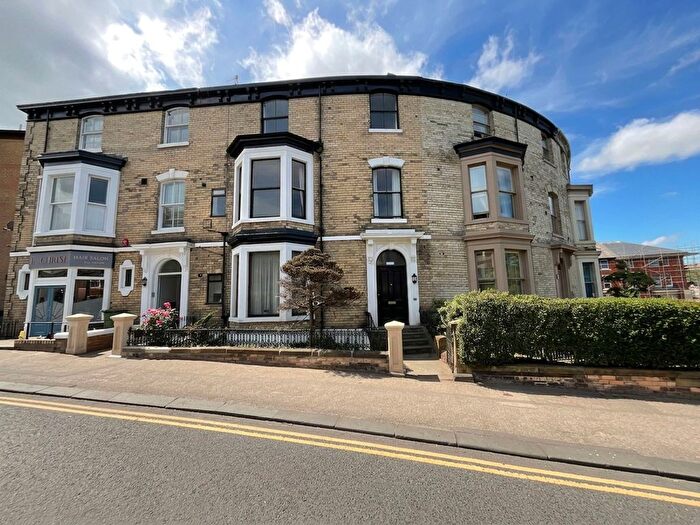
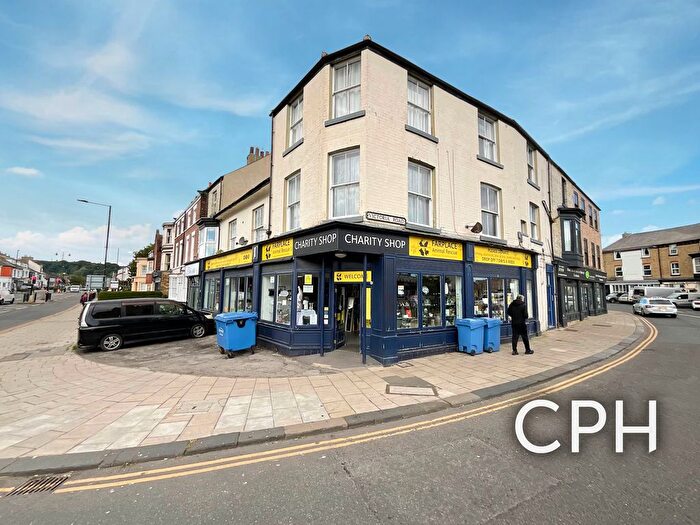
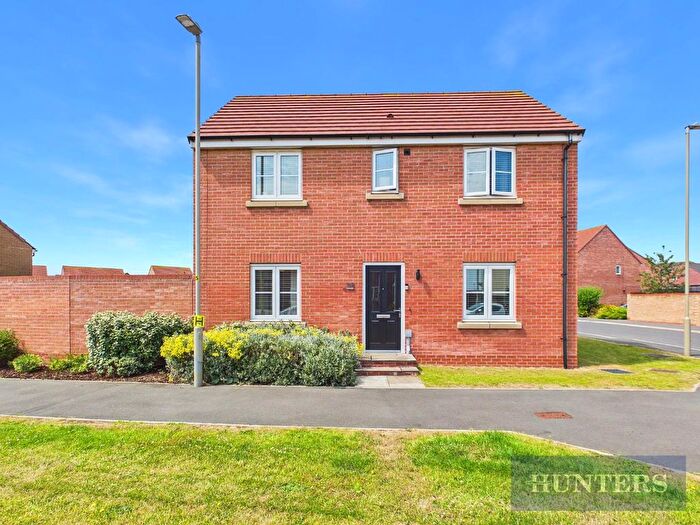
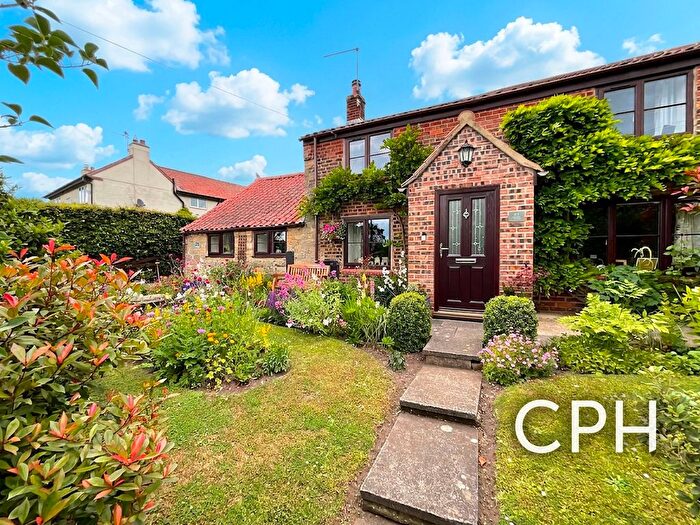
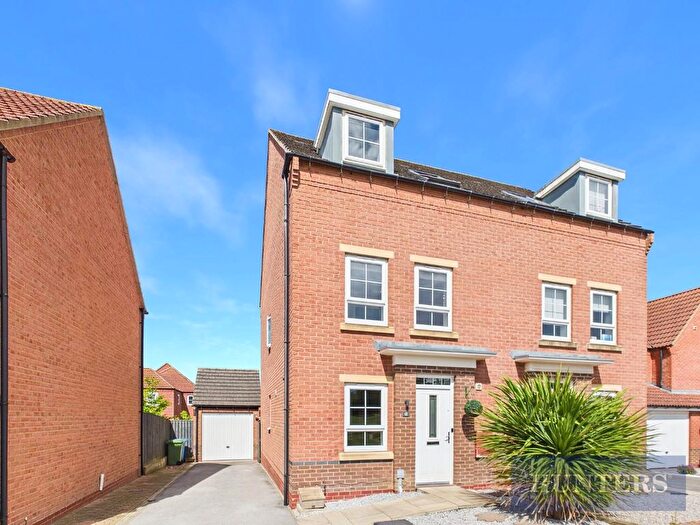
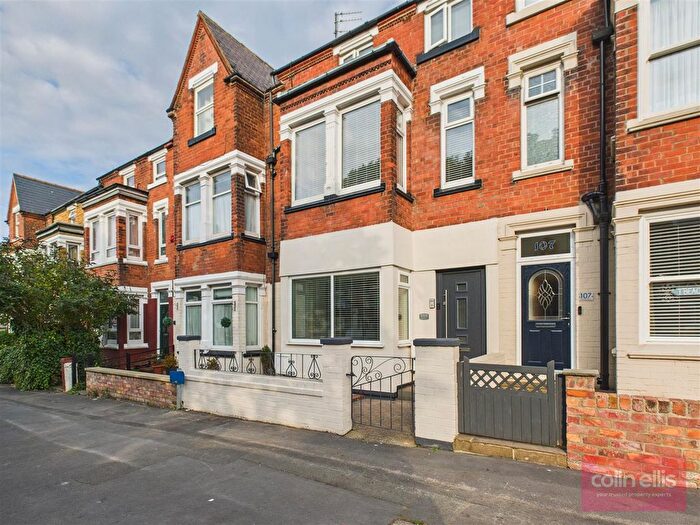
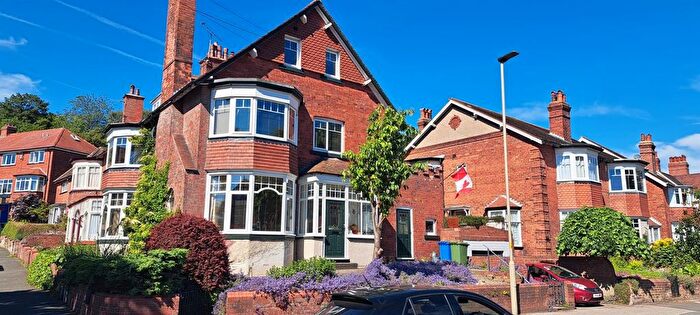
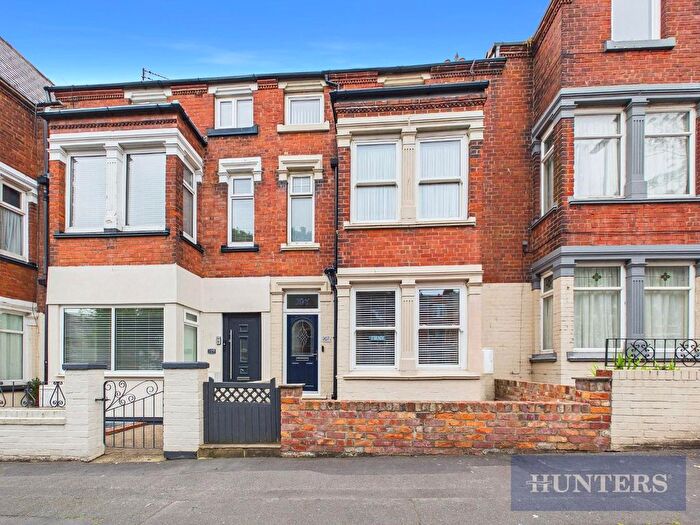
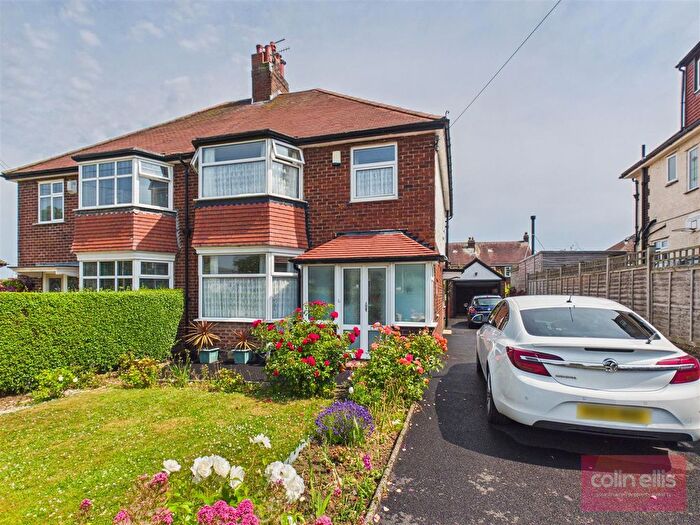
Previously listed properties in Scarborough
![]()
If you are looking to sell your house, let it out, or receive a property valuation, an expert can help you.
Click the button below to get started.
Neighbourhoods in Scarborough
Navigate through our locations to find the location of your next house in Scarborough, North Yorkshire for sale or to rent.
- Castle
- Cayton
- Central
- Derwent Valley
- Eastfield
- Falsgrave Park
- Fylingdales
- Hertford
- Lindhead
- Newby
- North Bay
- Northstead
- Ramshill
- Scalby, Hackness And Staintondale
- Seamer
- Sherburn
- Stepney
- Thornton Dale
- Weaponness
- Woodlands
- Weaponness & Ramshill
- Hunmanby
- Falsgrave & Stepney
- Derwent Valley & Moor
- Scalby
- Burniston & Cloughton
- Fylingdales & Ravenscar
- Esk Valley & Coast
- Scalby & The Coast
Property price trends in Scarborough
According to the latest Land Registry data, the average home in Scarborough sold for £213,074 in 2026. That figure comes from a substantial record of 46,851 sales logged over the past 31 years.
Prices have moved up over the last three years. Compared with 2023, when the typical sale came in around £204,009, that's a rise of roughly 4.4%.
Looking back five years, average prices are up about 13.4% since 2021, a gain of around £25,191 in cash terms.
Zoom out to the past decade for the fuller picture. Back in 2016, homes here averaged £150,430, so the typical sold price has climbed about 41.6% since then, roughly 3.5% a year. Stretch the view to fifteen years and that annual pace eases back to about 2.5%.
Frequently asked questions about Scarborough
What is the average price for a property for sale in Scarborough?
The average price for a property for sale in Scarborough is £205,690. This amount is 35% lower than the average price in North Yorkshire. There are 9,003 property listings for sale in Scarborough.
What locations have the most expensive properties for sale in Scarborough?
The locations with the most expensive properties for sale in Scarborough are Fylingdales & Ravenscar at an average of £585,000, Thornton Dale at an average of £422,198 and Scalby, Hackness And Staintondale at an average of £370,797.
What locations have the most affordable properties for sale in Scarborough?
The locations with the most affordable properties for sale in Scarborough are Central at an average of £136,032, Castle at an average of £142,599 and Ramshill at an average of £148,355.
Which train stations are available in or near Scarborough?
Some of the train stations available in or near Scarborough are Scarborough, Seamer and Filey.
Property Price Paid in Scarborough by Year
The average sold property price by year was:
| Year | Average Sold Price | Price Change |
Sold Properties
|
|---|---|---|---|
| 2026 | £213,074 | 4% |
89 Properties |
| 2025 | £203,951 | -2% |
1,188 Properties |
| 2024 | £208,381 | 2% |
1,358 Properties |
| 2023 | £204,009 | -1% |
1,336 Properties |
| 2022 | £206,402 | 9% |
1,555 Properties |
| 2021 | £187,883 | 6% |
1,740 Properties |
| 2020 | £177,078 | 5% |
1,392 Properties |
| 2019 | £168,108 | 2% |
1,573 Properties |
| 2018 | £163,986 | -1% |
1,557 Properties |
| 2017 | £165,140 | 9% |
1,635 Properties |
Property Price per Property Type in Scarborough
Here you can find historic sold price data in order to help with your property search.
The average Property Paid Price for specific property types in the last three years are:
| Property Type | Average Sold Price | Sold Properties |
|---|---|---|
| Semi Detached House | £213,882.00 | 1,173 Semi Detached Houses |
| Terraced House | £156,638.00 | 1,158 Terraced Houses |
| Detached House | £364,623.00 | 719 Detached Houses |
| Flat | £132,857.00 | 921 Flats |
Transport in Scarborough
Please see below transportation links in this area:
