
Houses for sale in Eggborough, Selby
House Prices in Eggborough
Properties in Eggborough have an average house price of £362k and had 28 Property Transactions within the last 3 years¹.
Eggborough is an area in Selby, North Yorkshire with 286 households², where the most expensive property was sold for £700k.
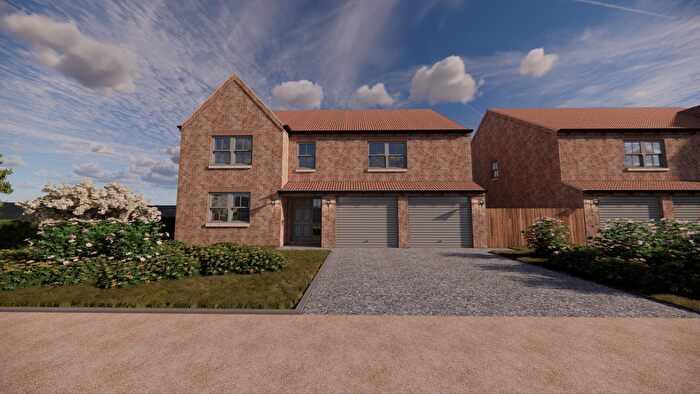
Properties for sale in Eggborough
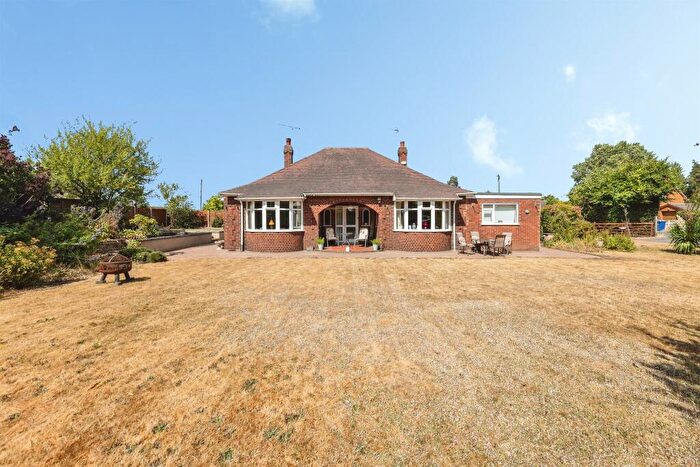
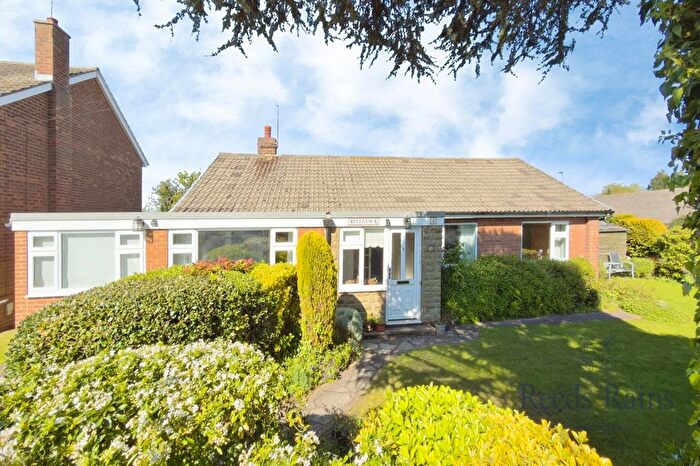
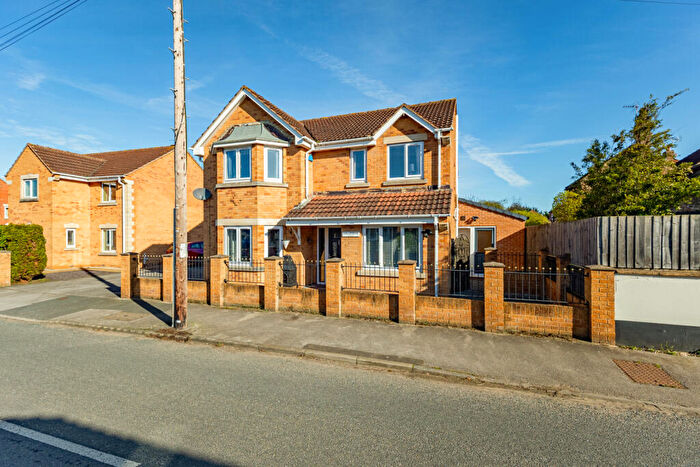
![]()
If you are looking to sell your house, let it out, or receive a property valuation, an expert can help you.
Click the button below to get started.
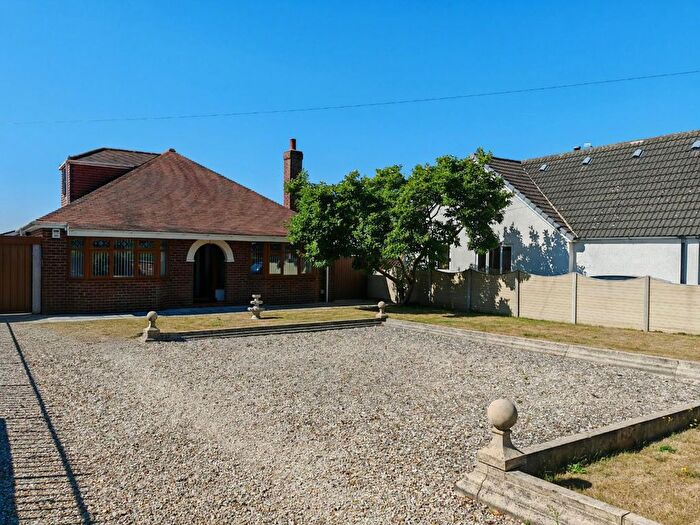
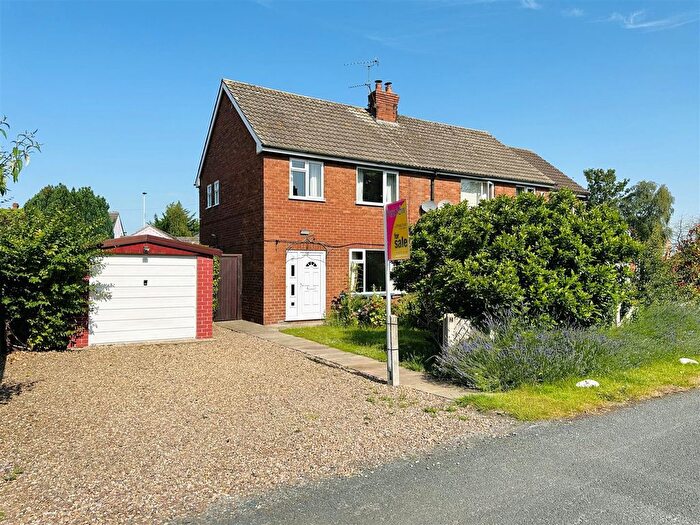
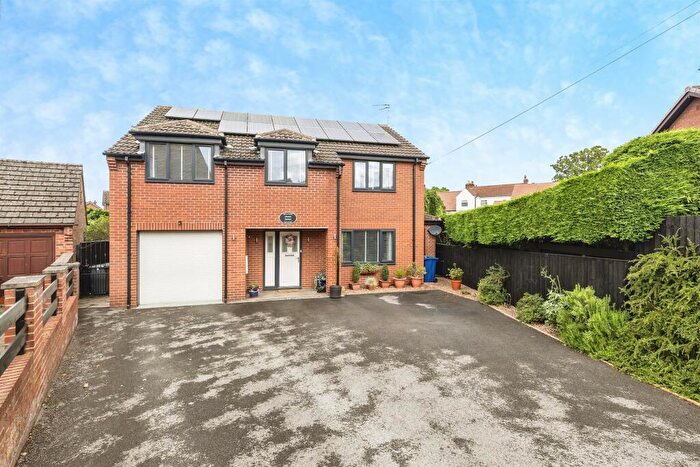
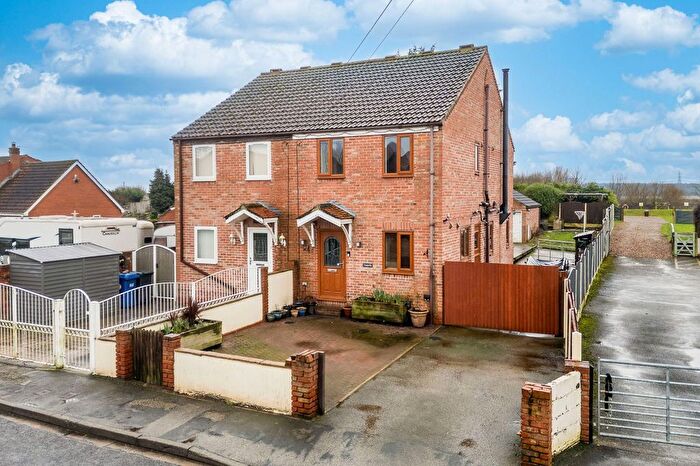
Previously listed properties in Eggborough
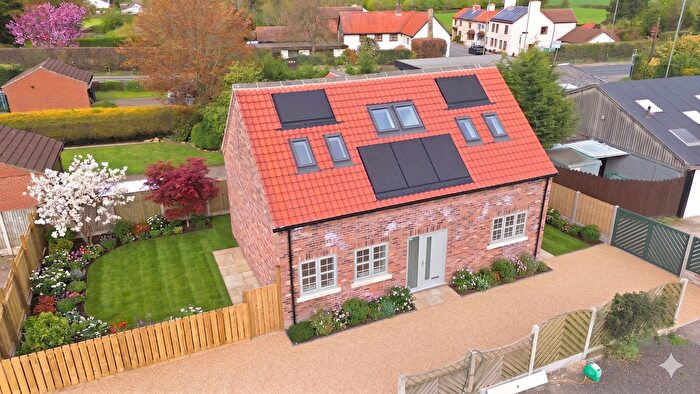
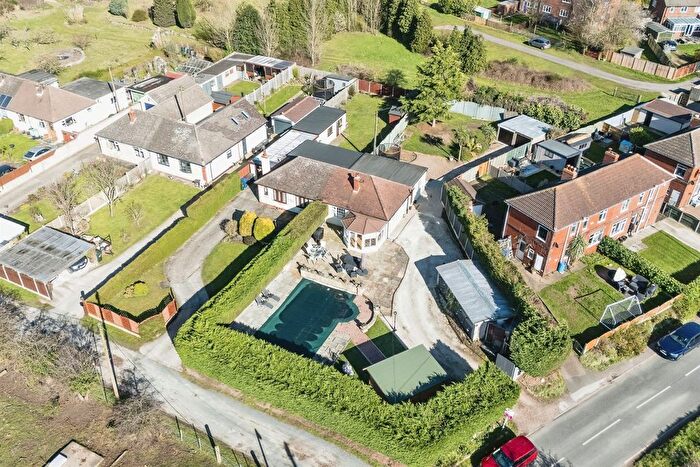
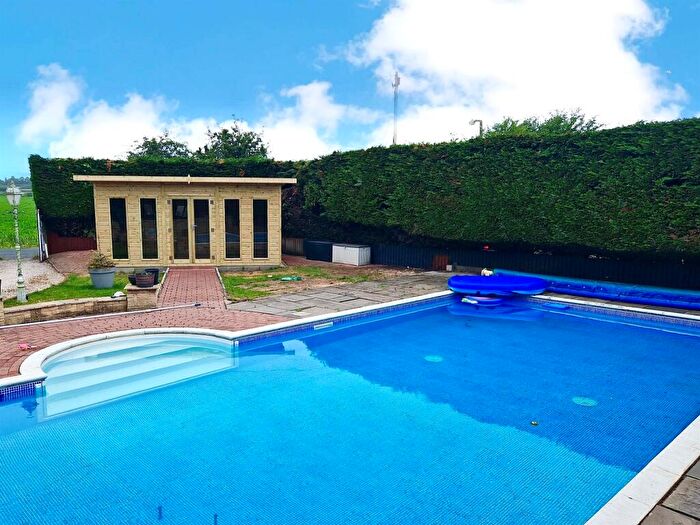
![]()
If you are looking to sell your house, let it out, or receive a property valuation, an expert can help you.
Click the button below to get started.
Roads and Postcodes in Eggborough
Navigate through our locations to find the location of your next house in Eggborough, Selby for sale or to rent.
| Streets | Postcodes |
|---|---|
| Aire View | YO8 8QD |
| Burn Lane | YO8 8QW |
| Gateforth Lane | YO8 8PZ |
| Hirst Road | YO8 8QQ |
| Laurel Terrace | YO8 8QR |
| Main Road | YO8 8QJ YO8 8QP |
| Main Street | YO8 8QA YO8 8QT |
| Manor Farm Court | YO8 8QY |
| Millfield Road | YO8 8QF |
| Old House Gardens | YO8 8RE |
| Pattersons Cottages | YO8 8QE |
| Princess Drive | YO8 8PY |
| Riverside Close | YO8 8QZ |
| Station Cottages | YO8 8QL |
| The Avenue | YO8 8QB |
| Wilde Cottages | YO8 8QH |
| YO8 8QG YO8 8QN |
Property price trends in Eggborough
According to the latest Land Registry data, the average home in Eggborough sold for £401,125 in 2025. That figure comes from 333 sales logged over the past 30 years.
Prices have continued to climb over the last three years. Compared with 2022, when the typical sale came in around £354,576, that's a rise of roughly 13.1%.
Looking back five years, average prices are up about 25.1% since 2020, a gain of around £80,488 in cash terms.
Zoom out to the past decade for the fuller picture. Back in 2015, homes here averaged £247,016, so the typical sold price has climbed about 62.4% since then, roughly 5% a year. Stretch the view to fifteen years and that annual pace edges up closer to 6.1%.
Frequently asked questions about Eggborough
What is the average price for a property for sale in Eggborough?
The average price for a property for sale in Eggborough is £361,946. This amount is 49% higher than the average price in Selby. There are 138 property listings for sale in Eggborough.
What streets have the most expensive properties for sale in Eggborough?
The streets with the most expensive properties for sale in Eggborough are Hirst Road at an average of £548,750, Main Street at an average of £419,888 and Station Cottages at an average of £231,250.
What streets have the most affordable properties for sale in Eggborough?
The streets with the most affordable properties for sale in Eggborough are Pattersons Cottages at an average of £165,000, Aire View at an average of £170,000 and Manor Farm Court at an average of £217,500.
Which train stations are available in or near Eggborough?
Some of the train stations available in or near Eggborough are Hensall, Whitley Bridge and Snaith.
Property Price Paid in Eggborough by Year
The average sold property price by year was:
| Year | Average Sold Price | Price Change |
Sold Properties
|
|---|---|---|---|
| 2025 | £401,125 | 26% |
12 Properties |
| 2024 | £297,500 | -24% |
8 Properties |
| 2023 | £367,625 | 4% |
8 Properties |
| 2022 | £354,576 | 8% |
13 Properties |
| 2021 | £325,722 | 2% |
9 Properties |
| 2020 | £320,637 | 4% |
8 Properties |
| 2019 | £307,562 | -2% |
8 Properties |
| 2018 | £313,750 | -3% |
10 Properties |
| 2017 | £324,500 | 34% |
10 Properties |
| 2016 | £213,863 | -16% |
11 Properties |
Property Price per Property Type in Eggborough
Here you can find historic sold price data in order to help with your property search.
The average Property Paid Price for specific property types in the last three years are:
| Property Type | Average Sold Price | Sold Properties |
|---|---|---|
| Semi Detached House | £286,571.00 | 7 Semi Detached Houses |
| Terraced House | £208,333.00 | 3 Terraced Houses |
| Detached House | £416,861.00 | 18 Detached Houses |
