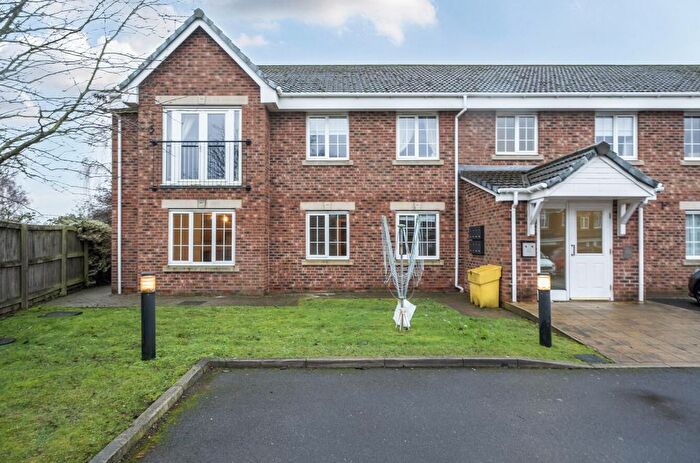
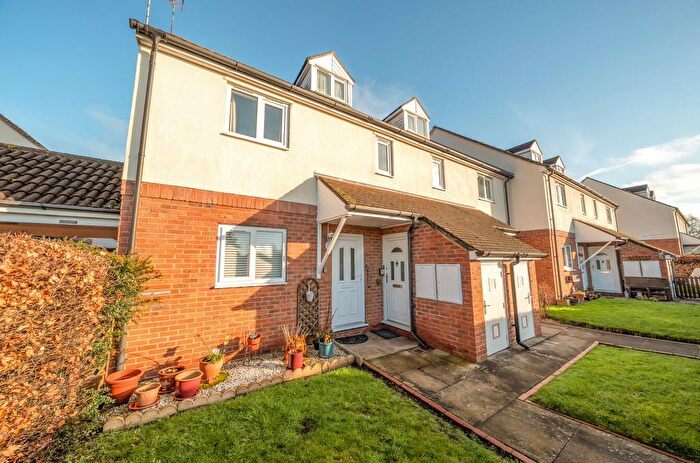
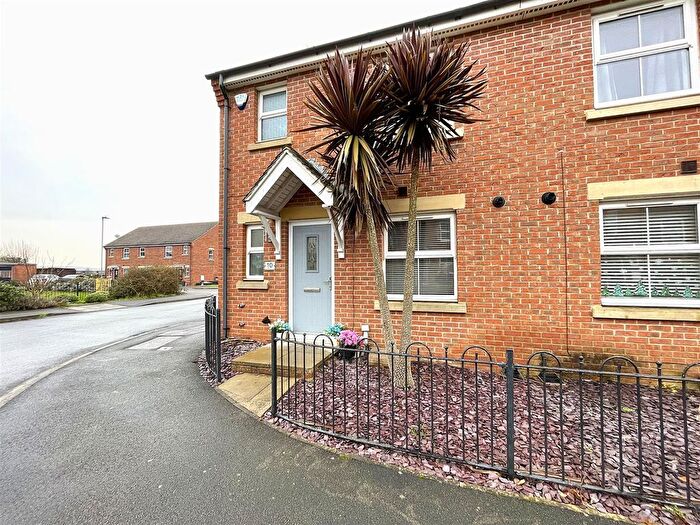
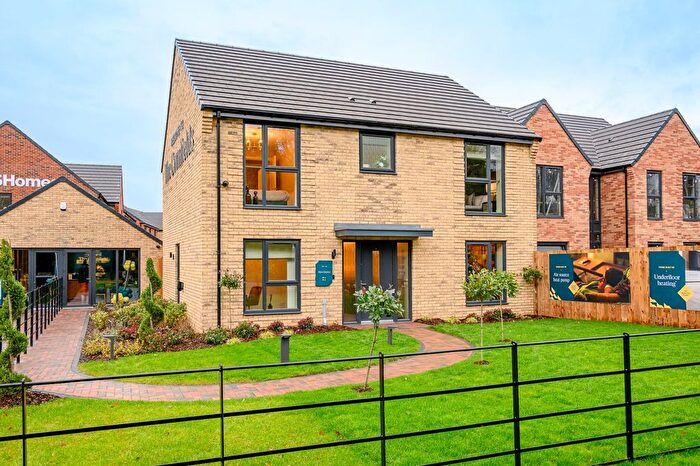
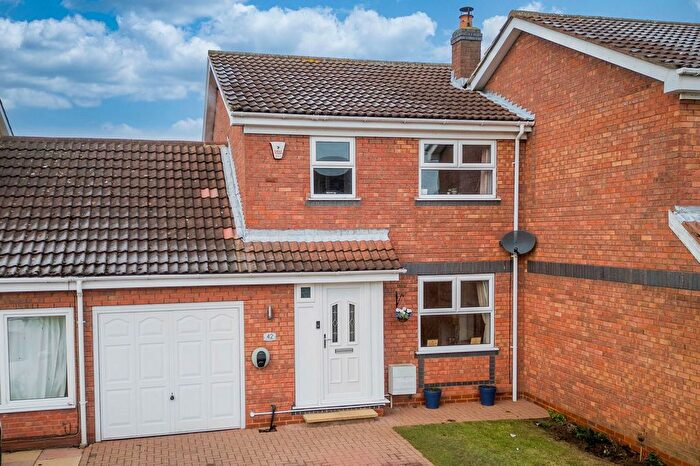
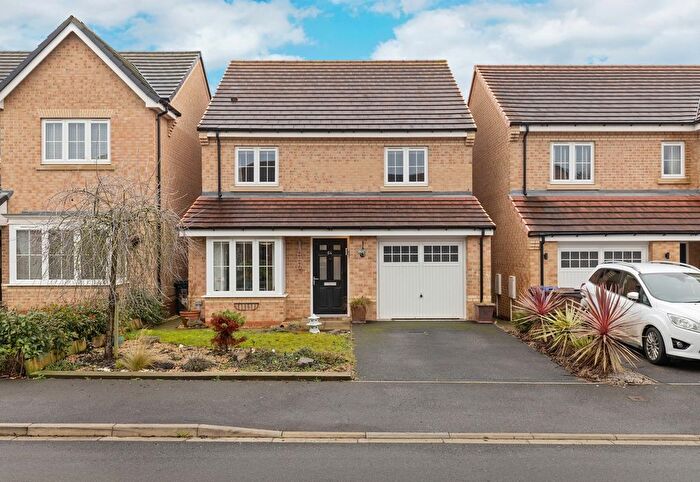
Houses for sale & to rent in Hambleton, Selby
House Prices in Hambleton
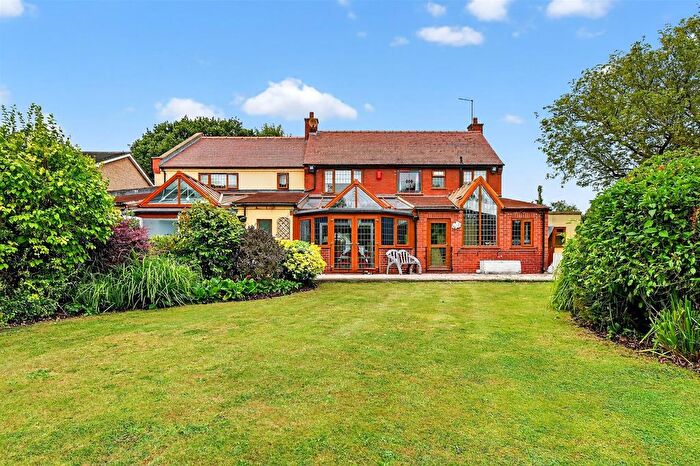
Properties in Hambleton have an average house price of £274,722.00 and had 233 Property Transactions within the last 3 years¹.
Hambleton is an area in Selby, North Yorkshire with 2,211 households², where the most expensive property was sold for £648,000.00.
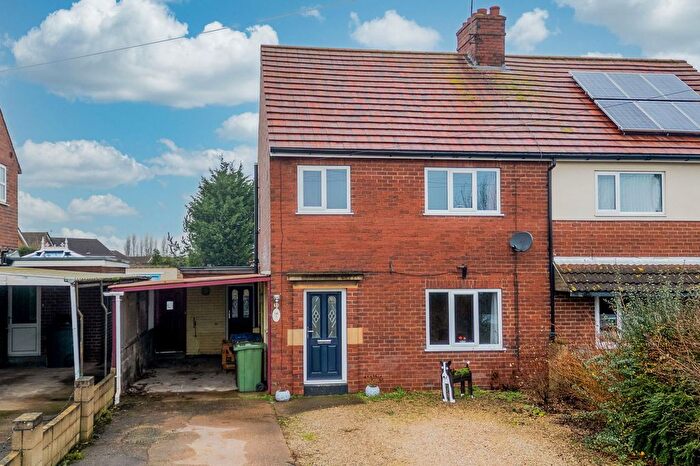
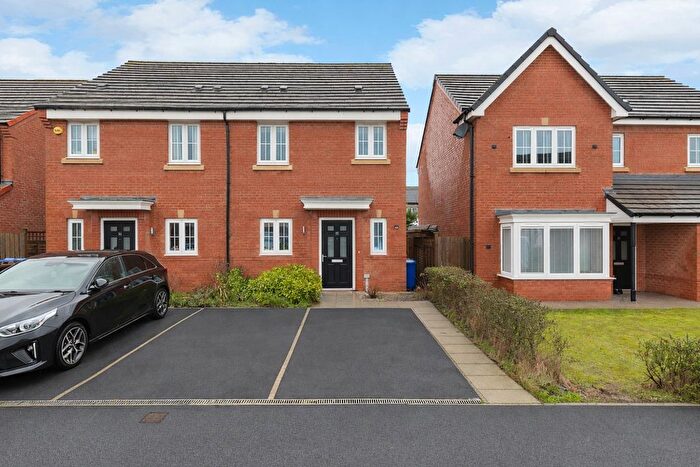
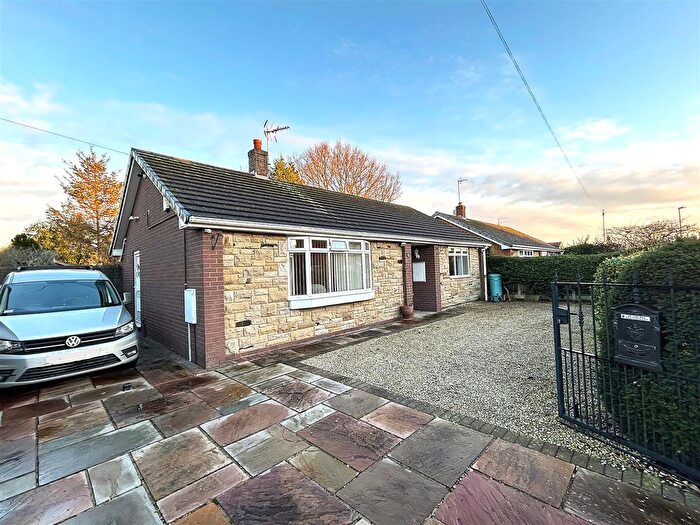
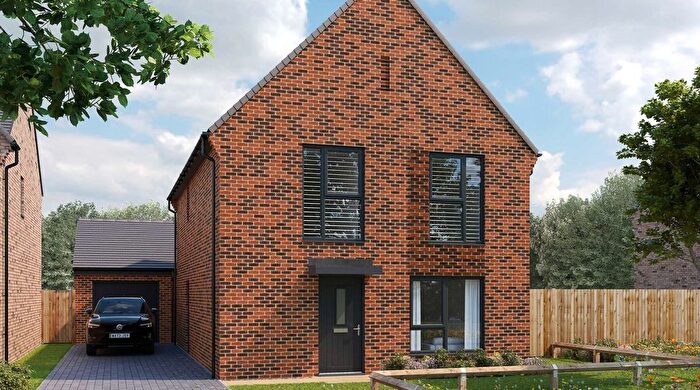
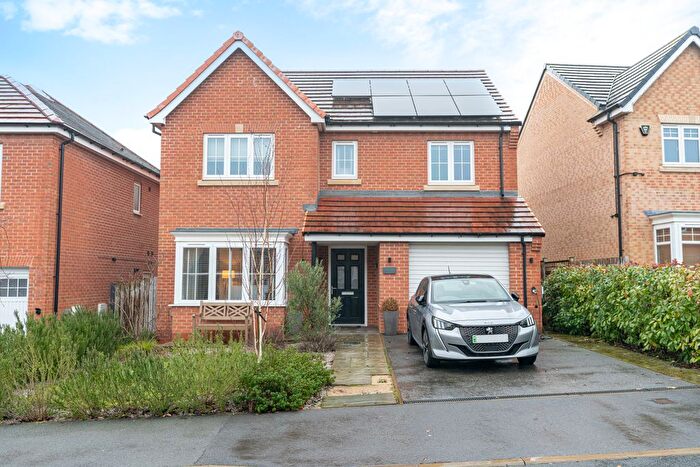
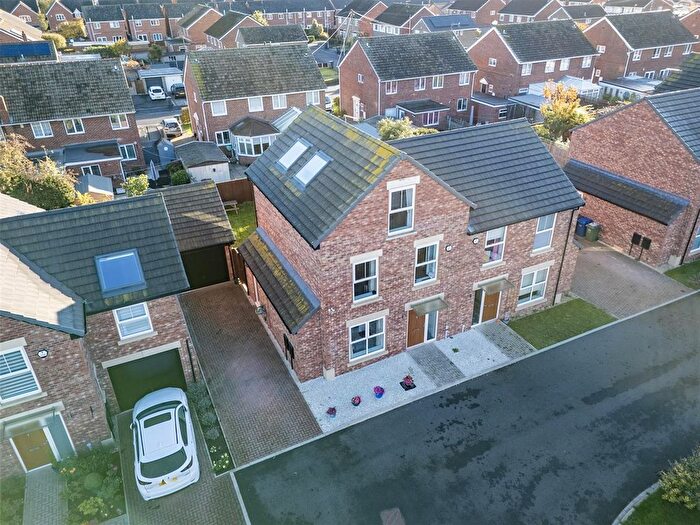
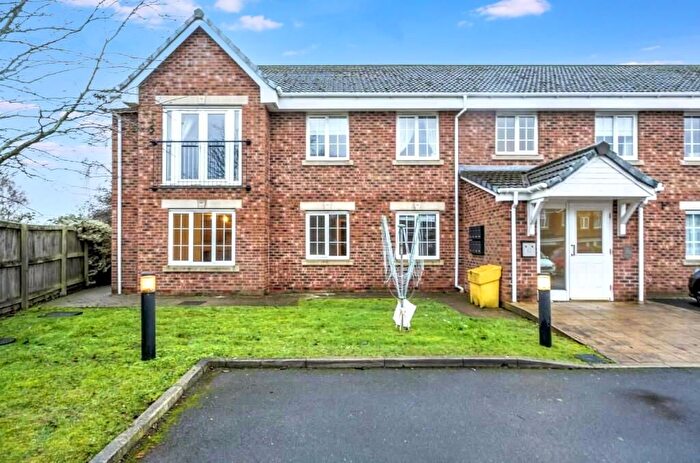
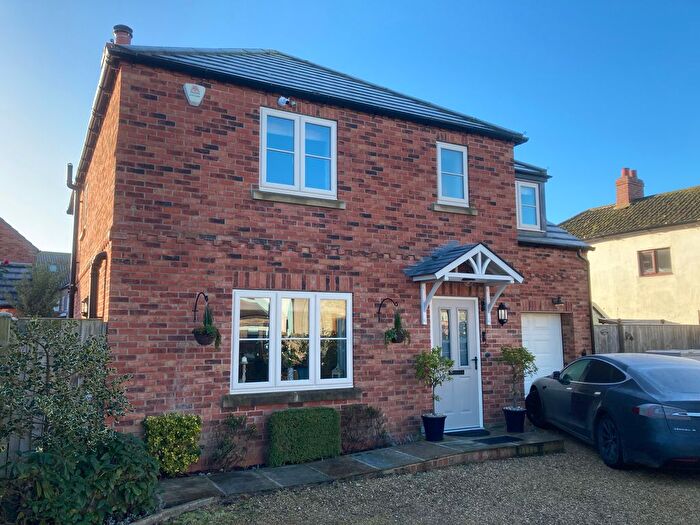
Properties for sale in Hambleton
Previously listed properties in Hambleton
Roads and Postcodes in Hambleton
Navigate through our locations to find the location of your next house in Hambleton, Selby for sale or to rent.
| Streets | Postcodes |
|---|---|
| Acorn Way | YO8 9FN |
| Almond Close | YO8 9FD |
| Anson Croft | YO8 9QW |
| Appletree Drive | YO8 9QG |
| Ash Close | YO8 9FF |
| Back Lane | YO8 9JB YO8 9JT |
| Bar Lane | YO8 9LN |
| Barff Grove | YO8 9LZ |
| Barff View | YO8 8LN |
| Beechfield Close | YO8 9QJ |
| Birch Close | YO8 9FB |
| Briarwood Close | YO8 9LW |
| Burn Hall Close | YO8 8LS |
| Burn Hall Crescent | YO8 8LT |
| Burn Lane | YO8 8LF |
| Cedar Close | YO8 9QL |
| Chancery Court | YO8 9FA |
| Chapel Close | YO8 9SA |
| Chapel Court | YO8 9YF |
| Chapel Street | YO8 9JF YO8 9JG |
| Cherwell Court | YO8 9QH |
| Cherwell Croft | YO8 9QQ |
| Church Close | YO8 9QE |
| Common Lane | YO8 9JN YO8 8LB YO8 9JW |
| Council Houses | YO8 8LL |
| Dam Lane | YO8 9LU |
| Dane Avenue | YO8 9NU |
| Doncaster Road | YO8 8LA |
| Dunnington Drive | YO8 9QN |
| East View | YO8 9HT |
| Field Avenue | YO8 9PS |
| Field Lane | YO8 9FL YO8 9NJ YO8 9NL |
| Fir Tree Close | YO8 9PF |
| Fir Tree Lane | YO8 9PG |
| Fir Tree Way | YO8 9PY |
| Fordlands | YO8 9PD |
| Fox Lane | YO8 9NA YO8 9NH YO8 9PA |
| Foxdale Avenue | YO8 9NN YO8 9NW |
| Foxglove Way | YO8 9UB |
| Francis Court | YO8 9RQ |
| Garth Close | YO8 9QF |
| Garth Drive | YO8 9QD |
| Garth Lane | YO8 9QA |
| Garth View | YO8 9QB |
| Gateforth Court | YO8 9GX |
| Gateforth Lane | YO8 9HP |
| Gateforth Mews | YO8 9LJ |
| Gateforth New Road | YO8 9BF |
| Gibson Close | YO8 9QP |
| Hawthorne Close | YO8 9NY |
| Hillam Road | YO8 9LH YO8 9LQ |
| Holly Grove | YO8 9LY |
| Holly Tree Court | YO8 9GS |
| Howard Close | YO8 9FX |
| Kingston Crescent | YO8 9JR |
| Kingston Drive | YO8 9JS |
| Laburnum Close | YO8 9FE |
| Landing Lane | YO8 9LG |
| Laurel Close | YO8 9FH |
| Leeds Road | YO8 9HJ YO8 9LS YO8 9LT YO8 9LX YO8 9SE |
| Lime Tree Close | YO8 9PH |
| Linden Way | YO8 9ND |
| Londesborough Grove | YO8 9NX |
| Main Road | YO8 8LH YO8 8LJ YO8 9HN YO8 9HW YO8 9JD YO8 9JH YO8 9JJ YO8 9JL |
| Maple Close | YO8 9PJ |
| Meadow Close | YO8 9PW |
| Meadow Drive | YO8 9PN |
| Meadow Garth | YO8 9PL |
| Mill Lane | YO8 9LD |
| Norman Close | YO8 9NS |
| North View | YO8 9PQ |
| Oak Drive | YO8 9FG |
| One Acre Garth | YO8 9YD |
| Orchard Drive | YO8 9JP |
| Orchard Way | YO8 9NB YO8 9NE |
| Paddock View | YO8 9SP |
| Pale Lane | YO8 9LP |
| Park Lane | YO8 8LW |
| Park Meadows | YO8 9RG |
| Philip Lane | YO8 9GB |
| Pine Tree Close | YO8 9FP |
| Privet Drive | YO8 9GD |
| Richardson Court | YO8 9GY |
| Rosewood Vale | YO8 9GJ |
| Rowan Close | YO8 9FJ |
| Sandway Avenue | YO8 9NG |
| Sandway Close | YO8 9NQ |
| Sandway Drive | YO8 9NF |
| Saxon Close | YO8 9NT |
| Scalm Lane | YO8 9HZ |
| St Marys Approach | YO8 9GZ |
| St Marys Court | YO8 9GN |
| St Marys Walk | YO8 9GH |
| Station Close | YO8 9GT |
| Station Road | YO8 9HS YO8 9HY YO8 9HX |
| Station View | YO8 9GL |
| Stocking Lane | YO8 9GF |
| Stuart Grove | YO8 9NR |
| The Brambles | YO8 9LL |
| The Causeway | YO8 9PE |
| The Coppice | YO8 9PX |
| The Cottages | YO8 9JE |
| The Fir Trees | YO8 9PR |
| The Green | YO8 9LF |
| The Meadows | YO8 9HR |
| The Willows | YO8 9GU |
| Toll Bar Close | YO8 9YE |
| Tudor Close | YO8 9NP |
| Wells Drive | YO8 9GP |
| West Lane | YO8 8LR |
| West Lane End | YO8 8LP |
| West View | YO8 9HU |
| Westcroft Lane | YO8 9JQ |
| Wheatsheaf Court | YO8 9GG |
| Whitings Lane | YO8 8LG |
| Willow Rise | YO8 9FW YO8 9PP |
| Wood Close | YO8 9PU |
| Wood Lane | YO8 9PT |
| Yorkdale Court | YO8 9YA |
| Yorkdale Drive | YO8 9YB |
| YO8 8LD YO8 9LE YO8 9PB YO8 8LE YO8 8LQ YO8 8QX YO8 9UF |
Transport near Hambleton
-
Selby Station
-
Sherburn-In-Elmet Station
-
South Milford Station
-
Whitley Bridge Station
-
Hensall Station
- FAQ
- Price Paid By Year
- Property Type Price
Frequently asked questions about Hambleton
What is the average price for a property for sale in Hambleton?
The average price for a property for sale in Hambleton is £274,722. This amount is 13% higher than the average price in Selby. There are 875 property listings for sale in Hambleton.
What streets have the most expensive properties for sale in Hambleton?
The streets with the most expensive properties for sale in Hambleton are Park Meadows at an average of £640,000, The Green at an average of £545,000 and Gateforth Court at an average of £477,500.
What streets have the most affordable properties for sale in Hambleton?
The streets with the most affordable properties for sale in Hambleton are Francis Court at an average of £58,500, Leeds Road at an average of £158,000 and Cedar Close at an average of £167,990.
Which train stations are available in or near Hambleton?
Some of the train stations available in or near Hambleton are Selby, Sherburn-In-Elmet and South Milford.
Property Price Paid in Hambleton by Year
The average sold property price by year was:
| Year | Average Sold Price | Price Change |
Sold Properties
|
|---|---|---|---|
| 2025 | £282,668 | 10% |
67 Properties |
| 2024 | £255,744 | -14% |
92 Properties |
| 2023 | £291,121 | 11% |
74 Properties |
| 2022 | £259,126 | 3% |
92 Properties |
| 2021 | £250,208 | 9% |
155 Properties |
| 2020 | £227,226 | -6% |
130 Properties |
| 2019 | £240,581 | 13% |
122 Properties |
| 2018 | £209,394 | - |
109 Properties |
| 2017 | £209,415 | 1% |
113 Properties |
| 2016 | £207,654 | -6% |
126 Properties |
| 2015 | £219,142 | 10% |
135 Properties |
| 2014 | £197,105 | 12% |
115 Properties |
| 2013 | £173,936 | 8% |
73 Properties |
| 2012 | £159,239 | -12% |
85 Properties |
| 2011 | £177,950 | -4% |
88 Properties |
| 2010 | £185,142 | 11% |
68 Properties |
| 2009 | £164,929 | -2% |
86 Properties |
| 2008 | £167,619 | -15% |
66 Properties |
| 2007 | £192,887 | 7% |
110 Properties |
| 2006 | £178,846 | 5% |
125 Properties |
| 2005 | £169,263 | 2% |
102 Properties |
| 2004 | £165,705 | 17% |
144 Properties |
| 2003 | £137,702 | 20% |
116 Properties |
| 2002 | £110,839 | 22% |
123 Properties |
| 2001 | £86,682 | 21% |
107 Properties |
| 2000 | £68,466 | 4% |
113 Properties |
| 1999 | £65,473 | 6% |
127 Properties |
| 1998 | £61,560 | -2% |
107 Properties |
| 1997 | £62,520 | 5% |
115 Properties |
| 1996 | £59,378 | -1% |
100 Properties |
| 1995 | £60,133 | - |
105 Properties |
Property Price per Property Type in Hambleton
Here you can find historic sold price data in order to help with your property search.
The average Property Paid Price for specific property types in the last three years are:
| Property Type | Average Sold Price | Sold Properties |
|---|---|---|
| Semi Detached House | £217,033.00 | 84 Semi Detached Houses |
| Detached House | £335,990.00 | 119 Detached Houses |
| Terraced House | £197,867.00 | 29 Terraced Houses |
| Flat | £58,500.00 | 1 Flat |

