
Houses for sale & to rent in YO8 9HT, East View, Hambleton, Selby
House Prices in YO8 9HT, East View, Hambleton
Properties in YO8 9HT have no sales history available within the last 3 years. YO8 9HT is a postcode in East View located in Hambleton, an area in Selby, North Yorkshire, with 4 households².
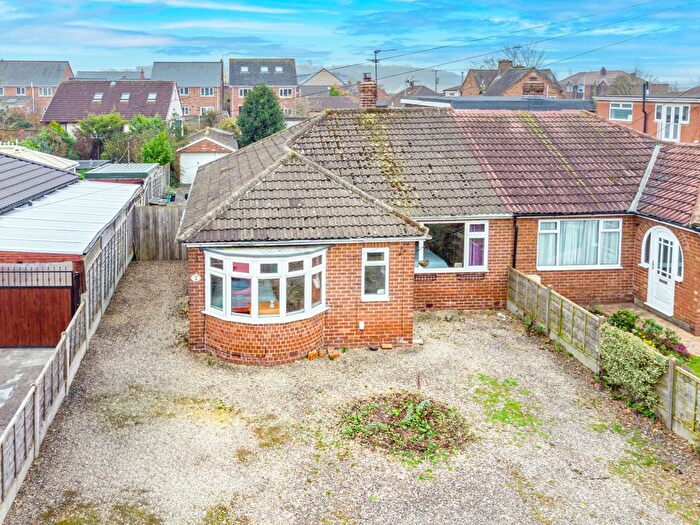
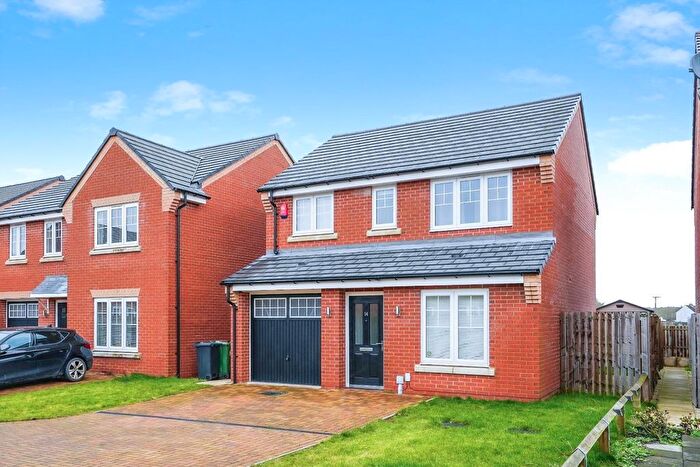
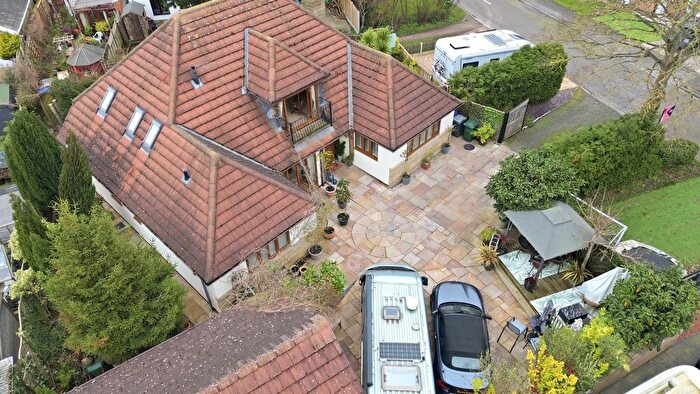
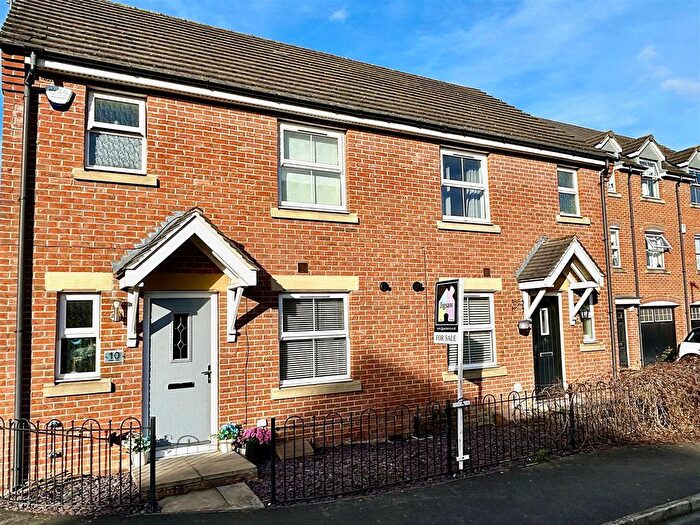
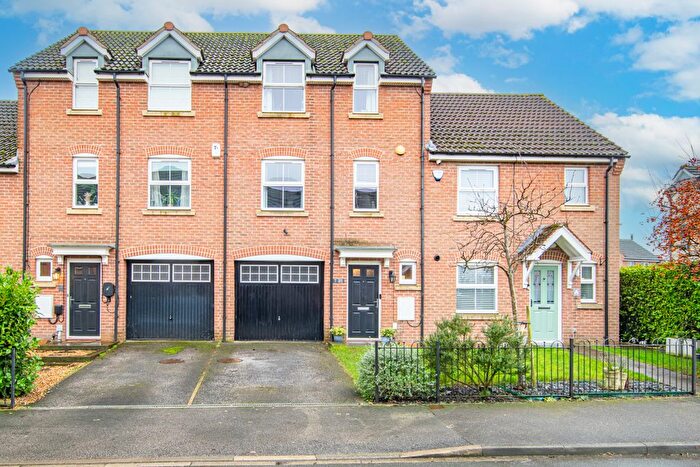
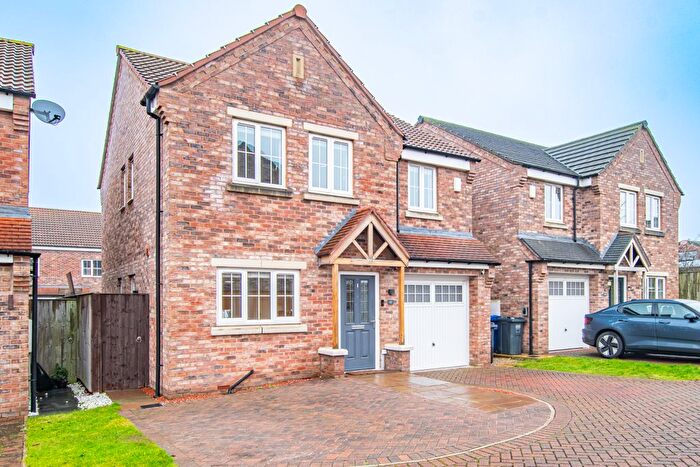
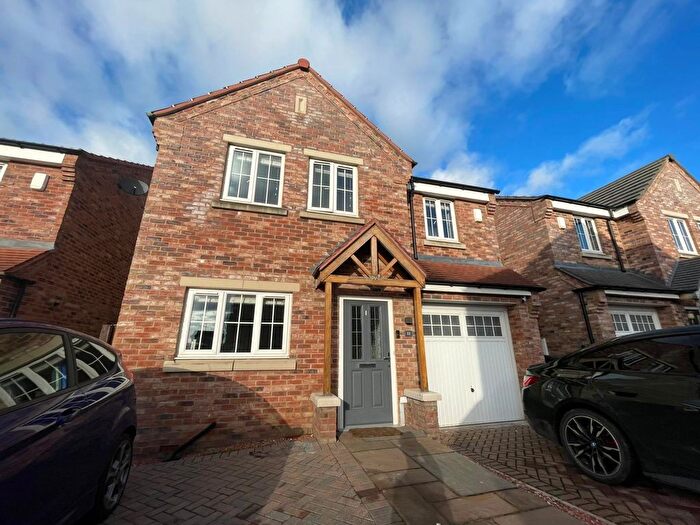
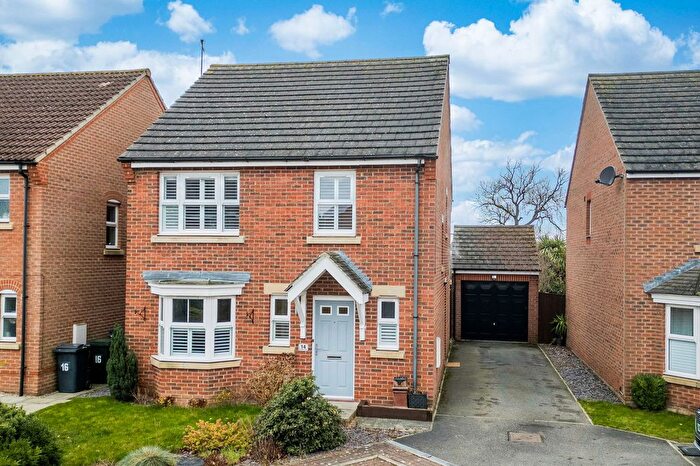
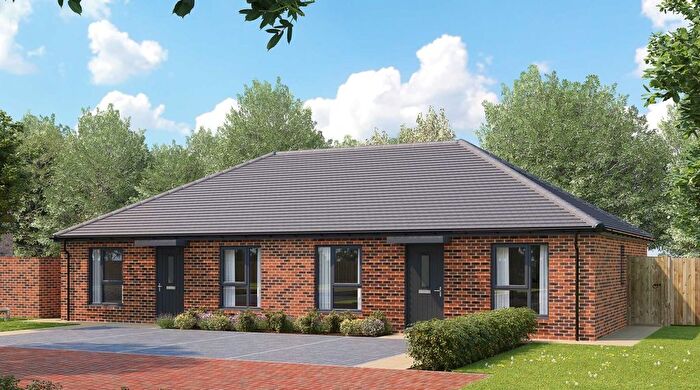
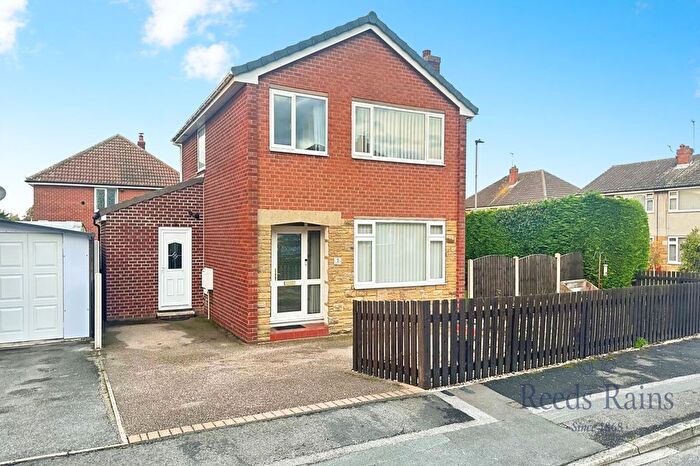
Properties for sale near YO8 9HT, East View
![]()
If you are looking to sell your house, let it out, or receive a property valuation, an expert can help you.
Click the button below to get started.
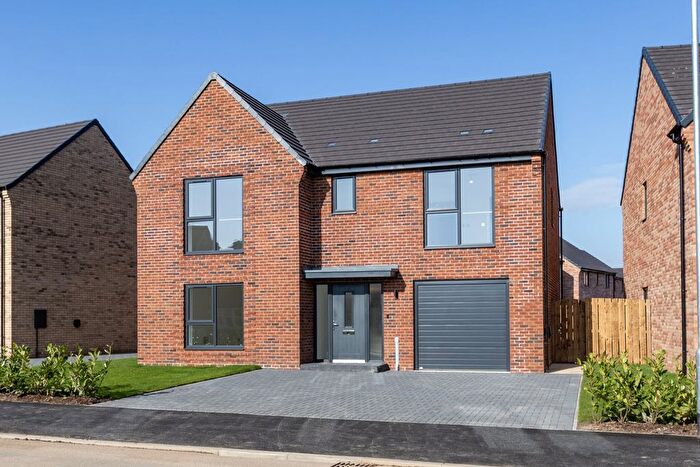
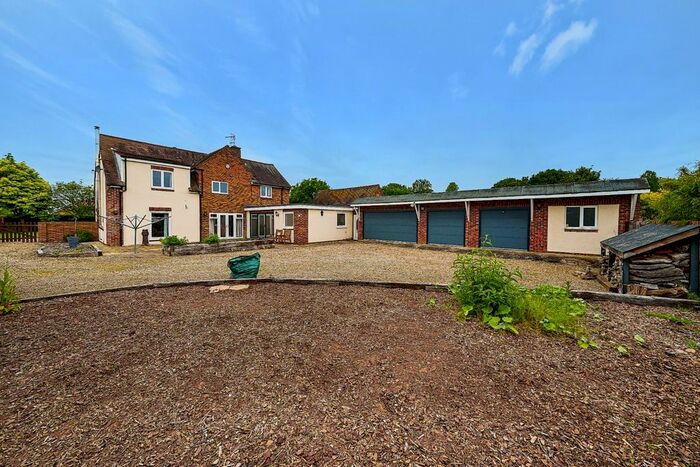
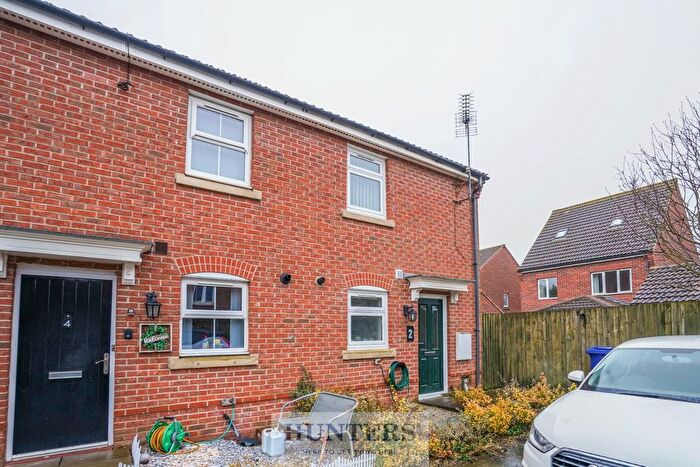
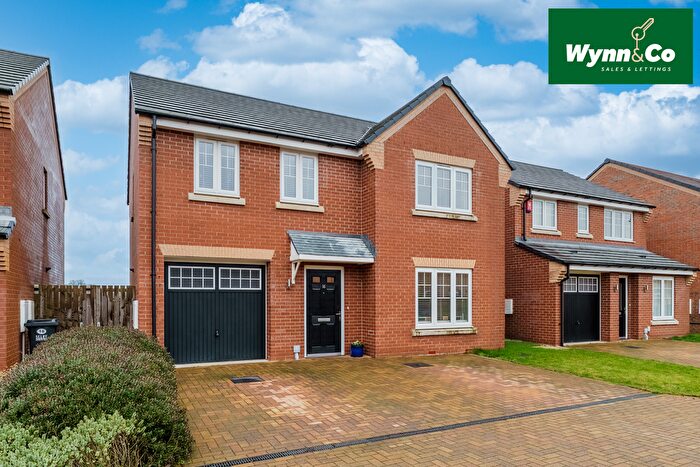
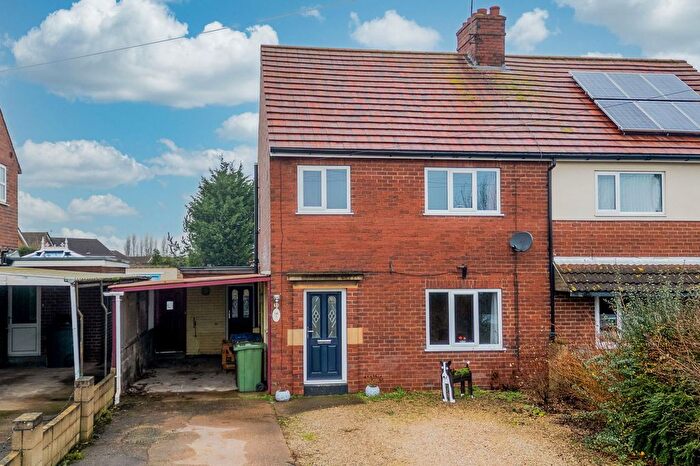
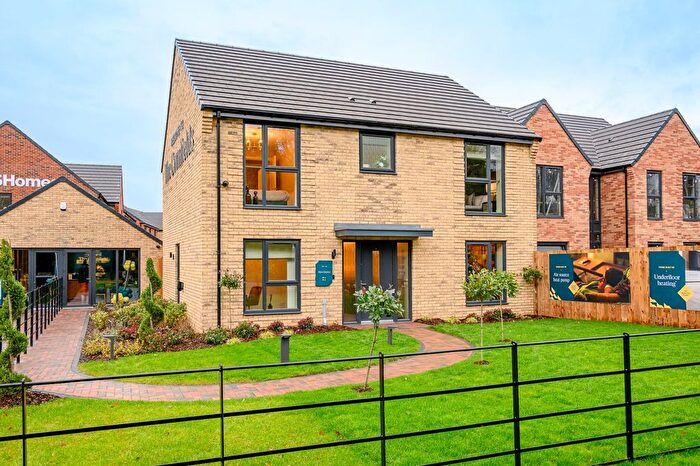
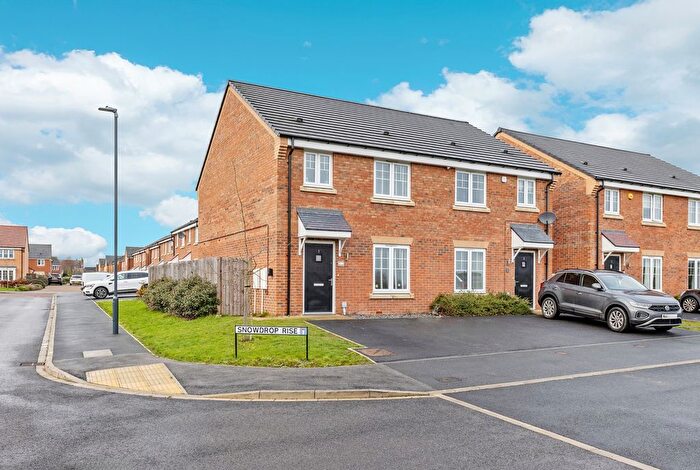
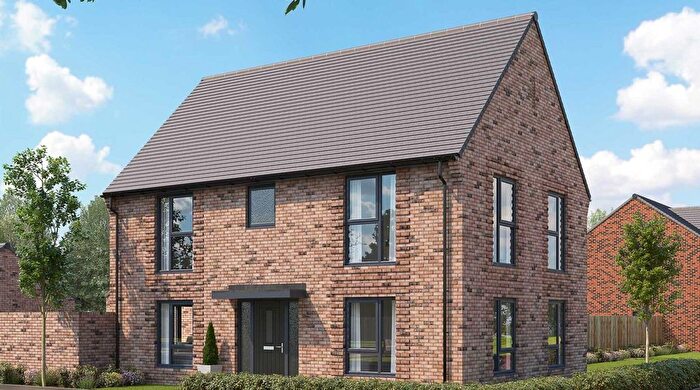
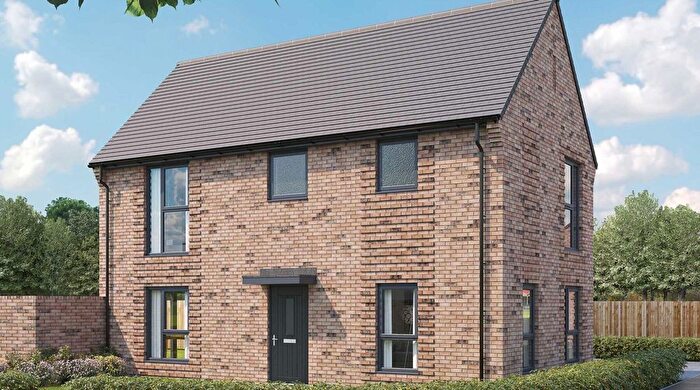
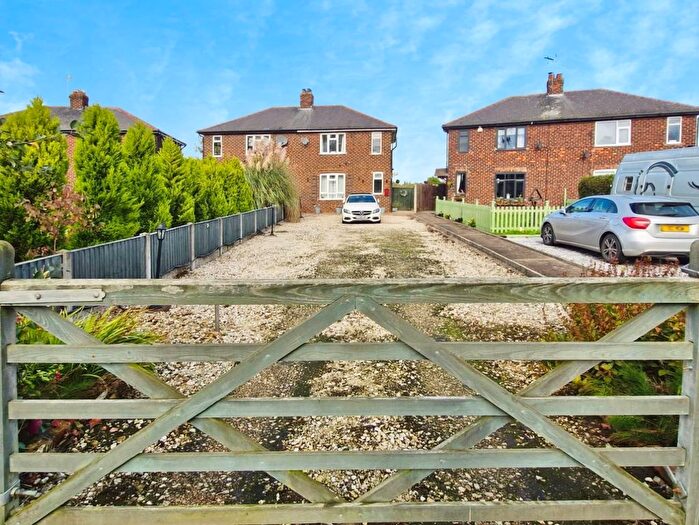
Previously listed properties near YO8 9HT, East View
![]()
If you are looking to sell your house, let it out, or receive a property valuation, an expert can help you.
Click the button below to get started.
Price Paid in East View, YO8 9HT, Hambleton
41 East View, YO8 9HT, Hambleton Selby
Property 41 has been sold 1 time. The last time it was sold was in 10/08/2022 and the sold price was £160,000.00.
This terraced house, sold as a freehold on 10/08/2022, is a 133 sqm end-terrace house with an EPC rating of D.
| Date | Price | Property Type | Tenure | Classification |
|---|---|---|---|---|
| 10/08/2022 | £160,000.00 | Terraced House | freehold | Established Building |
47 East View, YO8 9HT, Hambleton Selby
Property 47 has been sold 2 times. The last time it was sold was in 03/04/2009 and the sold price was £142,000.00.
This is a Terraced House which was sold as a freehold in 03/04/2009
| Date | Price | Property Type | Tenure | Classification |
|---|---|---|---|---|
| 03/04/2009 | £142,000.00 | Terraced House | freehold | Established Building |
| 09/11/2007 | £120,000.00 | Terraced House | freehold | Established Building |
45 East View, YO8 9HT, Hambleton Selby
Property 45 has been sold 2 times. The last time it was sold was in 28/06/1999 and the sold price was £59,950.00.
This is a Terraced House which was sold as a freehold in 28/06/1999
| Date | Price | Property Type | Tenure | Classification |
|---|---|---|---|---|
| 28/06/1999 | £59,950.00 | Terraced House | freehold | Established Building |
| 26/07/1996 | £55,500.00 | Terraced House | freehold | Established Building |
Transport near YO8 9HT, East View

House price paid reports for YO8 9HT, East View
Click on the buttons below to see price paid reports by year or property price:
- Price Paid By Year
Property Price Paid in YO8 9HT, East View by Year
The average sold property price by year was:
| Year | Average Sold Price | Price Change |
Sold Properties
|
|---|---|---|---|
| 2022 | £160,000 | 11% |
1 Property |
| 2009 | £142,000 | 15% |
1 Property |
| 2007 | £120,000 | 50% |
1 Property |
| 1999 | £59,950 | 7% |
1 Property |
| 1996 | £55,500 | - |
1 Property |