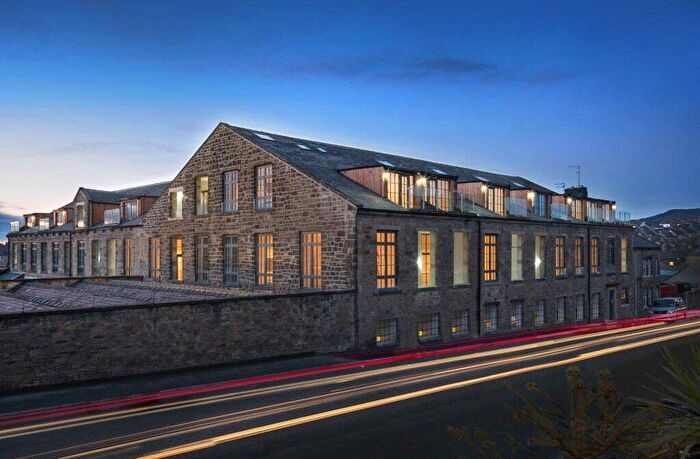
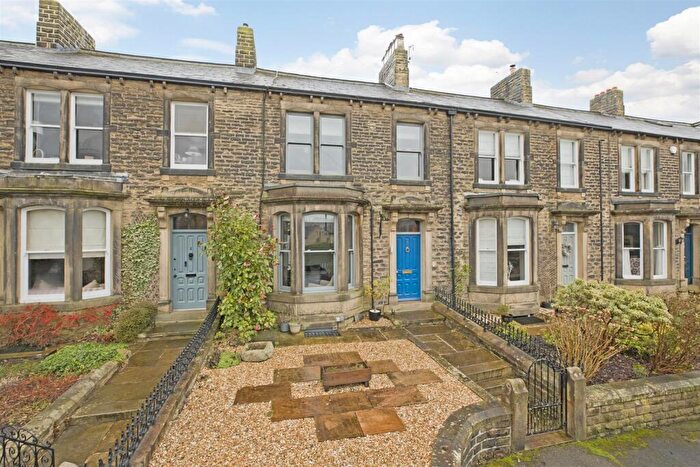
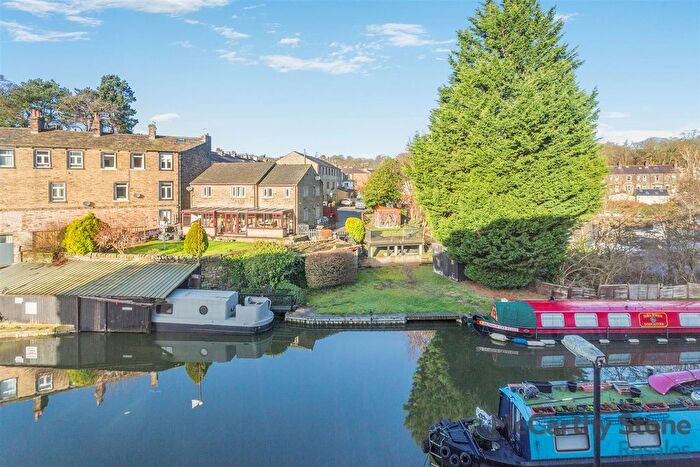
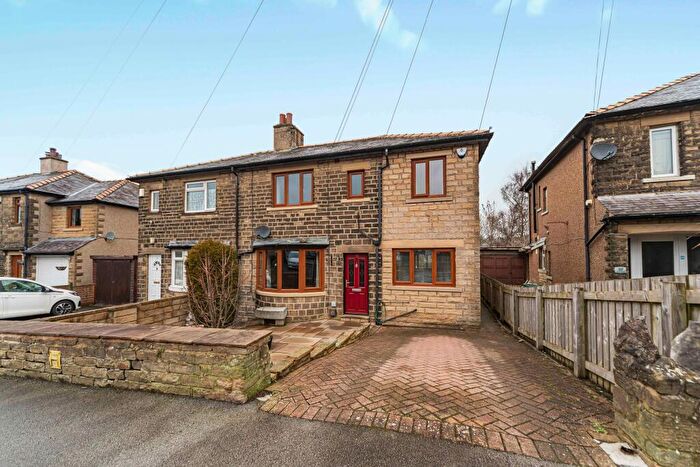
Houses for sale & to rent in Skipton South, Skipton
House Prices in Skipton South
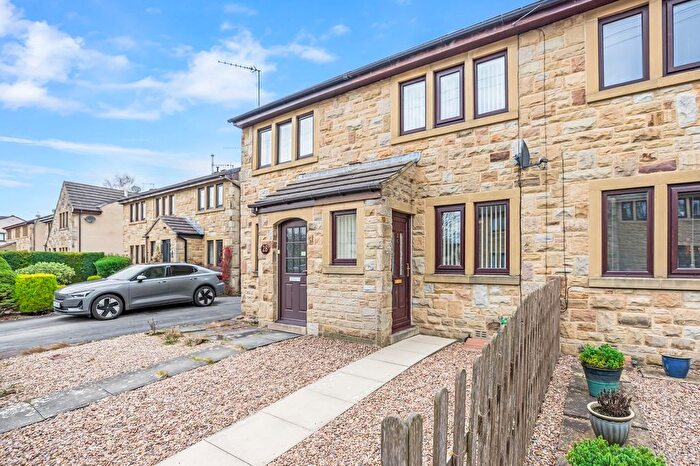
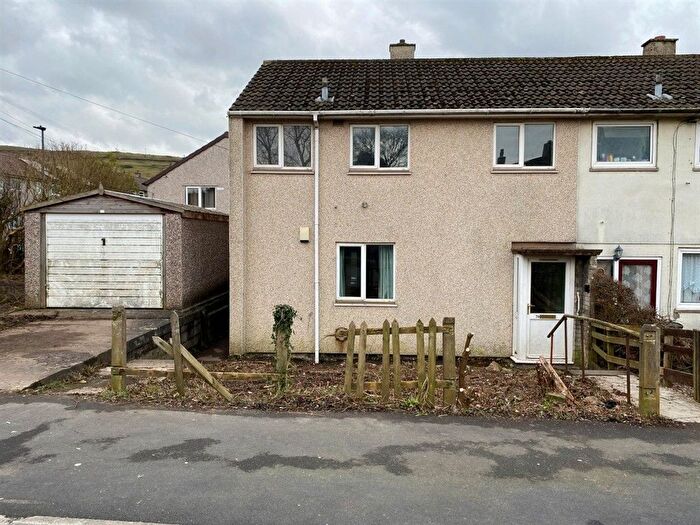
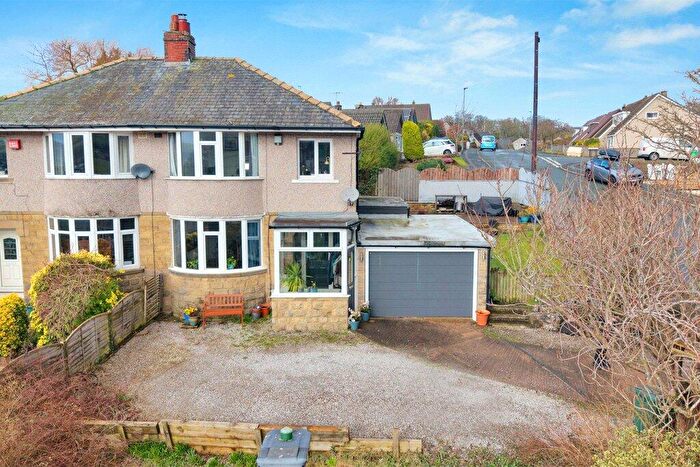
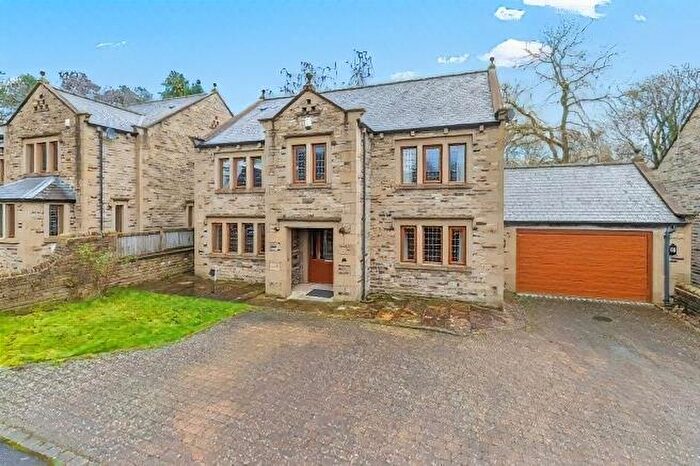
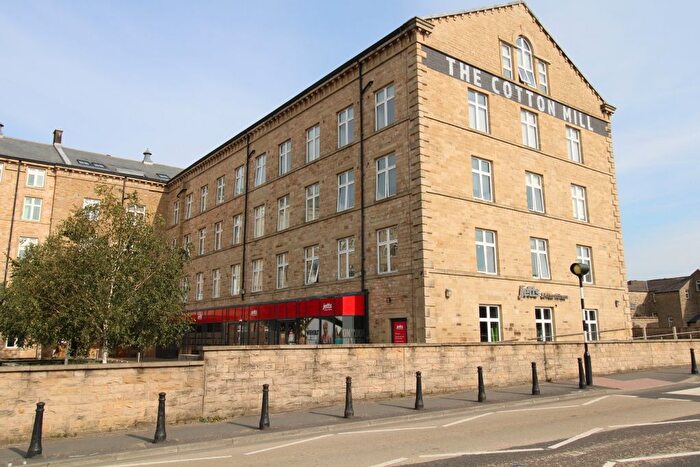
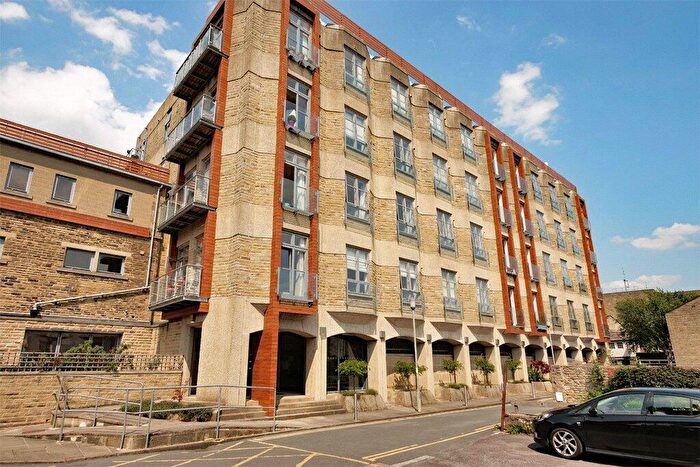
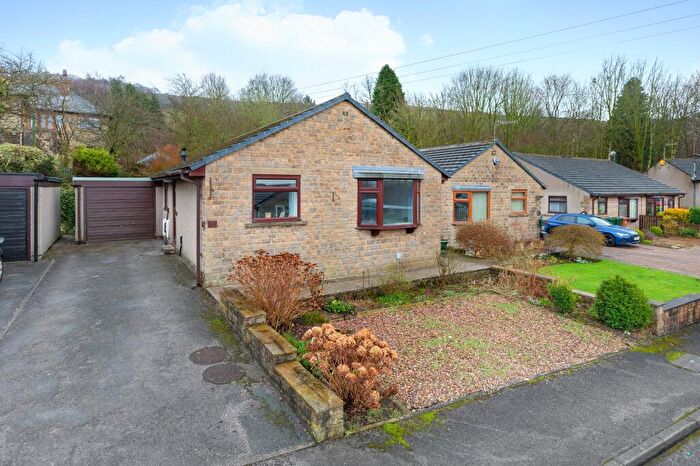
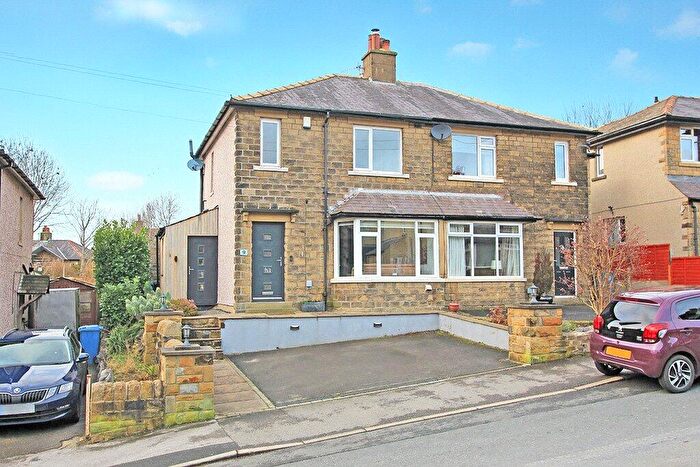
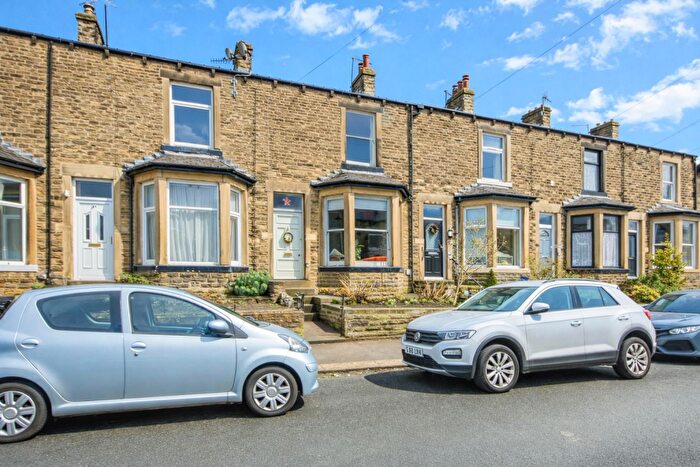
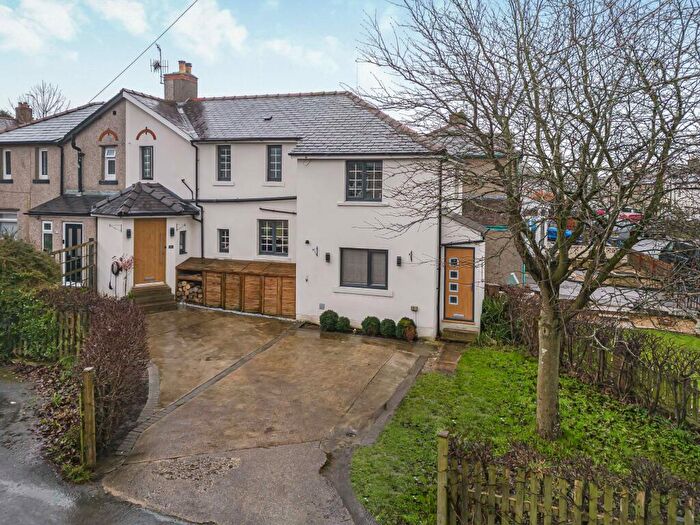
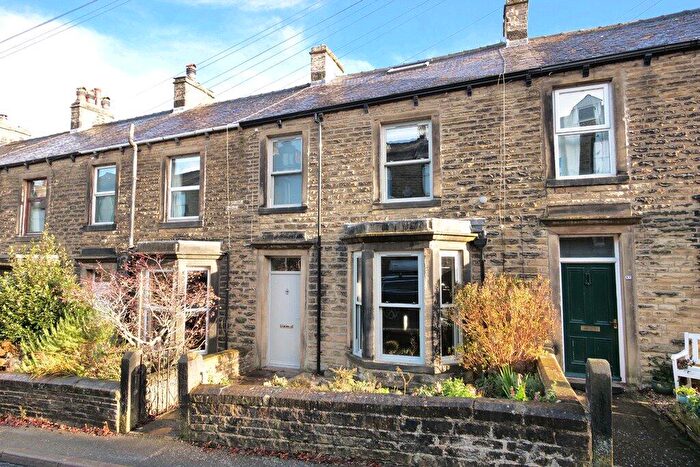
Properties in Skipton South have an average house price of £184,933.00 and had 178 Property Transactions within the last 3 years¹.
Skipton South is an area in Skipton, North Yorkshire with 1,743 households², where the most expensive property was sold for £860,000.00.
Properties for sale in Skipton South
Roads and Postcodes in Skipton South
Navigate through our locations to find the location of your next house in Skipton South, Skipton for sale or to rent.
| Streets | Postcodes |
|---|---|
| Beamsley Court | BD23 2SU |
| Bowers Wharf | BD23 2PD |
| Brougham Street | BD23 2EN BD23 2ES |
| Byron Street | BD23 2EQ |
| Castle Court | BD23 2DW |
| Castle Street | BD23 2DH BD23 2DJ |
| Cawder Ghyll | BD23 2QG |
| Cawder Green | BD23 2QB |
| Cawder Lane | BD23 2TD |
| Cawder Mews | BD23 2QQ |
| Cawder Road | BD23 2QE |
| Cowper Street | BD23 2EE |
| Crag View Road | BD23 2SA |
| Cromwell Street | BD23 2DN |
| Crookrise View | BD23 2RN |
| Dawson Street | BD23 2PL |
| Devonshire Place | BD23 2LR |
| Devonshire Street | BD23 2ET |
| Dorset Street | BD23 2EP |
| Duckett Street | BD23 2EJ |
| East Castle Street | BD23 2EL |
| Fairfax Street | BD23 2DP |
| Firth Street | BD23 2PT BD23 2FB BD23 2PX |
| George Street | BD23 2PN |
| Goschen Street | BD23 2DL |
| Greatwood Avenue | BD23 2RT BD23 2RX BD23 2RY BD23 2SE BD23 2SQ BD23 2SX |
| Heather View | BD23 2SD |
| Hollingworth Close | BD23 2SF |
| Jenny Gill Crescent | BD23 2RR |
| Keighley Road | BD23 2LU BD23 2TB BD23 2LT |
| Lambert Street | BD23 2DR |
| Mill Lane | BD23 2PQ |
| Milton Street | BD23 2ED |
| Montgomery Street | BD23 2ER |
| Moorview Road | BD23 2SB |
| Nelson Street | BD23 2DT |
| Neville Street | BD23 2EU |
| North Parade | BD23 2SR BD23 2SS BD23 2SH |
| Pinhaw Road | BD23 2SJ BD23 2SL BD23 2SN |
| Ramshaw Drive | BD23 2QN |
| Roman Court | BD23 2LW |
| Rombalds Drive | BD23 2SP BD23 2SW |
| Rombalds Way | BD23 2SG |
| Romille Street | BD23 2PJ |
| Roughaw Close | BD23 2PZ |
| Roughaw Road | BD23 2PY BD23 2QA |
| Rowland Street | BD23 2DU |
| Russell Street | BD23 2DX |
| Sackville Street | BD23 2PB BD23 2PH BD23 2PS BD23 2PR |
| Sharphaw Avenue | BD23 2QJ BD23 2QL |
| Shortbank Road | BD23 2JZ |
| Sidgwick Court | BD23 2PW |
| Simbach Close | BD23 2ST |
| South Parade | BD23 2QD |
| Southey Street | BD23 2EH |
| Trinity Row | BD23 2DF |
| Upper Sackville Street | BD23 2EB |
| Waterside | BD23 2PF |
| Wellington Street | BD23 2DS |
| Western Road | BD23 2RU |
| Westmoreland Street | BD23 2DY BD23 2EA |
| Whinny Gill Road | BD23 2RP BD23 2RS BD23 2SZ |
| BD23 2HT |
Transport near Skipton South
- FAQ
- Price Paid By Year
- Property Type Price
Frequently asked questions about Skipton South
What is the average price for a property for sale in Skipton South?
The average price for a property for sale in Skipton South is £184,933. This amount is 39% lower than the average price in Skipton. There are 469 property listings for sale in Skipton South.
What streets have the most expensive properties for sale in Skipton South?
The streets with the most expensive properties for sale in Skipton South are Cawder Lane at an average of £860,000, Hollingworth Close at an average of £320,000 and Devonshire Place at an average of £283,333.
What streets have the most affordable properties for sale in Skipton South?
The streets with the most affordable properties for sale in Skipton South are Whinny Gill Road at an average of £127,666, George Street at an average of £145,833 and Greatwood Avenue at an average of £146,777.
Which train stations are available in or near Skipton South?
Some of the train stations available in or near Skipton South are Skipton, Cononley and Gargrave.
Property Price Paid in Skipton South by Year
The average sold property price by year was:
| Year | Average Sold Price | Price Change |
Sold Properties
|
|---|---|---|---|
| 2025 | £191,415 | 5% |
48 Properties |
| 2024 | £182,024 | -1% |
75 Properties |
| 2023 | £183,245 | -3% |
55 Properties |
| 2022 | £189,543 | 12% |
59 Properties |
| 2021 | £167,125 | 8% |
78 Properties |
| 2020 | £154,419 | 3% |
54 Properties |
| 2019 | £150,450 | -3% |
66 Properties |
| 2018 | £154,918 | 7% |
73 Properties |
| 2017 | £144,192 | 3% |
99 Properties |
| 2016 | £140,370 | 5% |
85 Properties |
| 2015 | £132,941 | 4% |
61 Properties |
| 2014 | £127,931 | 8% |
73 Properties |
| 2013 | £118,252 | -9% |
66 Properties |
| 2012 | £129,036 | 10% |
41 Properties |
| 2011 | £116,216 | 3% |
49 Properties |
| 2010 | £112,550 | -1% |
40 Properties |
| 2009 | £113,665 | -16% |
58 Properties |
| 2008 | £132,298 | -2% |
52 Properties |
| 2007 | £135,038 | 9% |
80 Properties |
| 2006 | £122,549 | 8% |
93 Properties |
| 2005 | £112,535 | 7% |
108 Properties |
| 2004 | £104,929 | 28% |
105 Properties |
| 2003 | £75,301 | 4% |
94 Properties |
| 2002 | £72,643 | 29% |
97 Properties |
| 2001 | £51,389 | 8% |
96 Properties |
| 2000 | £47,367 | 5% |
91 Properties |
| 1999 | £44,949 | -7% |
87 Properties |
| 1998 | £48,198 | 3% |
57 Properties |
| 1997 | £46,854 | 11% |
71 Properties |
| 1996 | £41,902 | 4% |
61 Properties |
| 1995 | £40,020 | - |
49 Properties |
Property Price per Property Type in Skipton South
Here you can find historic sold price data in order to help with your property search.
The average Property Paid Price for specific property types in the last three years are:
| Property Type | Average Sold Price | Sold Properties |
|---|---|---|
| Semi Detached House | £203,525.00 | 16 Semi Detached Houses |
| Detached House | £510,000.00 | 2 Detached Houses |
| Terraced House | £180,015.00 | 150 Terraced Houses |
| Flat | £163,945.00 | 10 Flats |

