
Houses for sale in Marston Moor, Wetherby
House Prices in Marston Moor
Properties in Marston Moor have an average house price of £525k and had 16 Property Transactions within the last 3 years¹.
Marston Moor is an area in Wetherby, North Yorkshire with 163 households², where the most expensive property was sold for £1.28M.
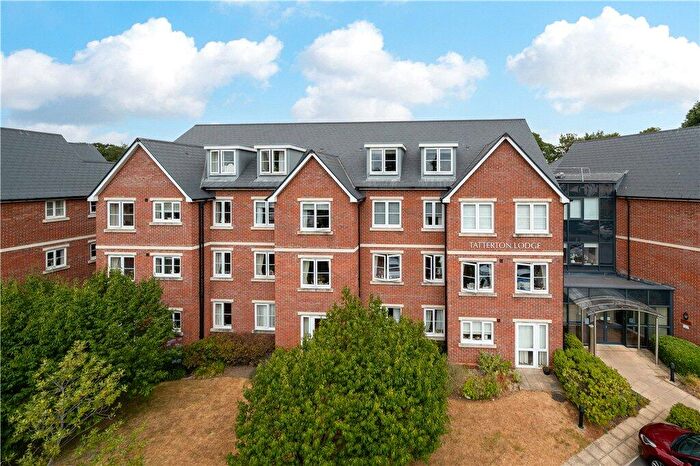
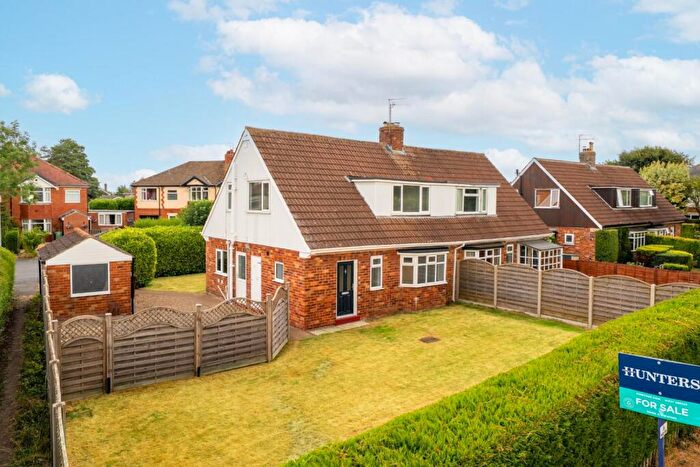
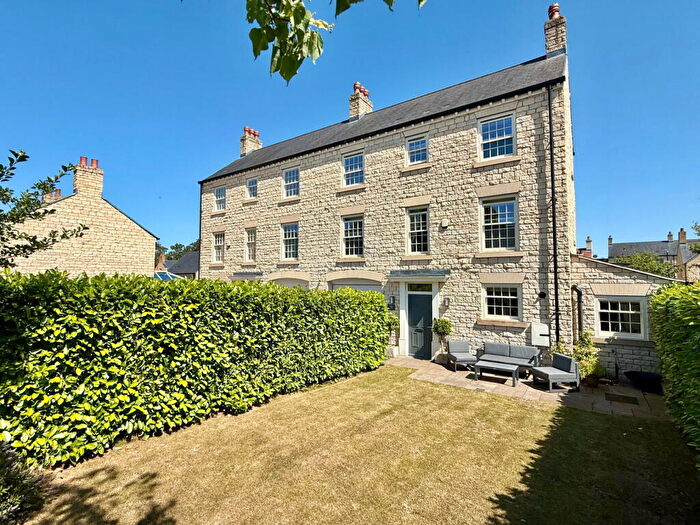
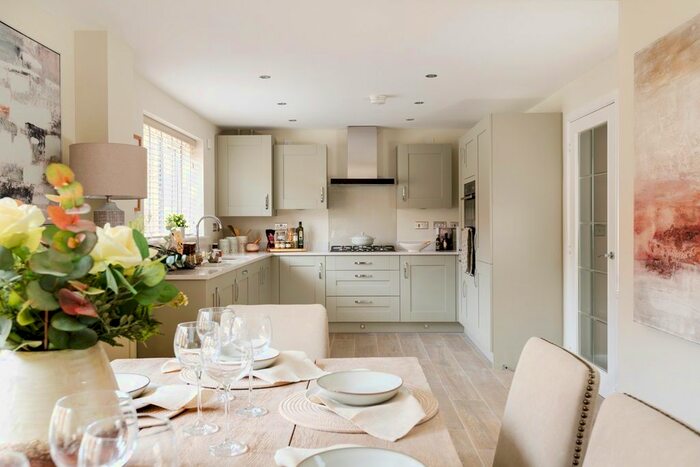
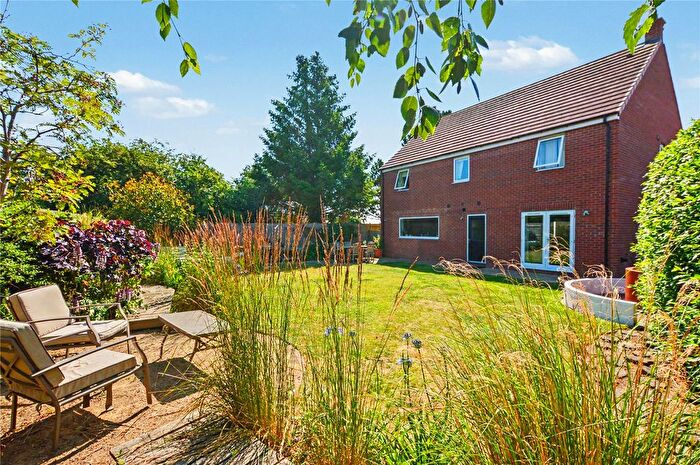
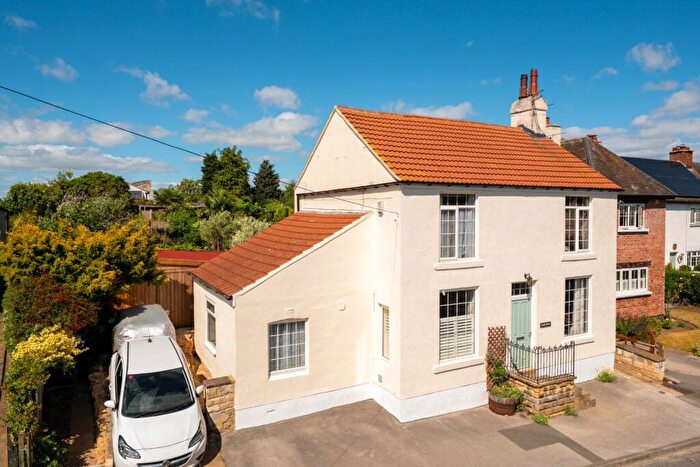
Properties for sale in Marston Moor
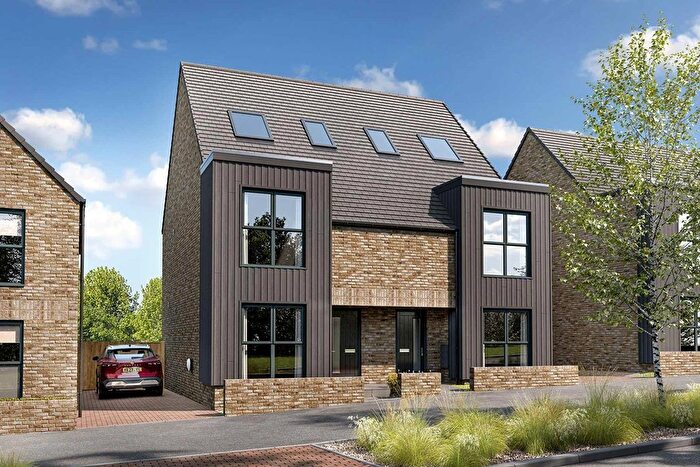
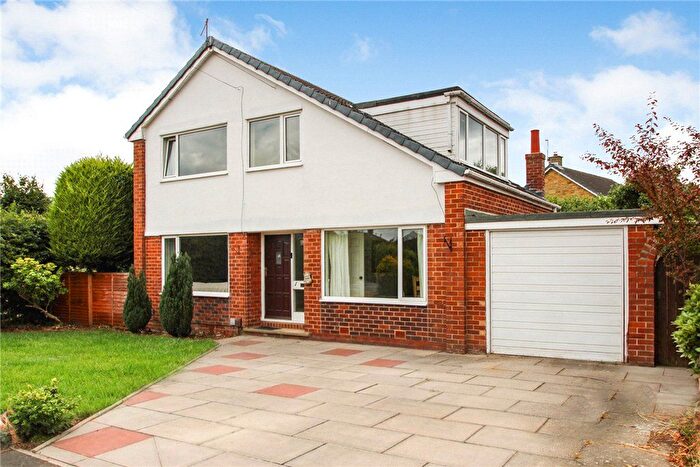
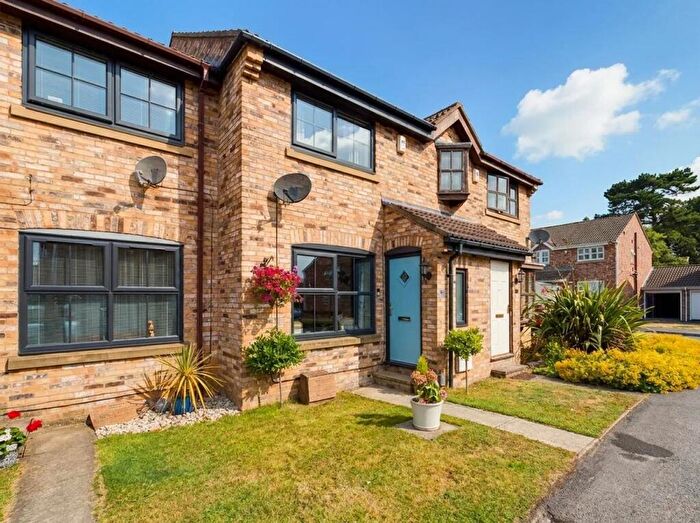
![]()
If you are looking to sell your house, let it out, or receive a property valuation, an expert can help you.
Click the button below to get started.
Roads and Postcodes in Marston Moor
Navigate through our locations to find the location of your next house in Marston Moor, Wetherby for sale or to rent.
| Streets | Postcodes |
|---|---|
| Chapel Close | LS22 5NA |
| Hawthorn Grove | LS22 5FA |
| Main Street | LS22 5ER |
| North Fields | LS22 5NF |
| Oak Road | LS22 5EY |
| Pinfold Close | LS22 5JW |
| Ribston Park | LS22 4EZ |
| Springs Lane | LS22 5ND |
| Tockwith Lane | LS22 5EZ |
| Tom Cat Lane | LS22 5ES |
| Turnpike Lane | LS22 5EP |
| Warfield Lane | LS22 5EU |
| York Road | LS22 5EW LS22 5EN |
| LS22 5HS LS22 5JF LS22 5ET LS22 5HX LS22 5JH LS22 5JJ LS22 5JQ |
Property price trends in Marston Moor
According to the latest Land Registry data, the average home in Marston Moor sold for £702,000 in 2025. That figure comes from 178 sales logged over the past 30 years.
Prices have continued to climb over the last three years. Compared with 2022, when the typical sale came in around £521,642, that's a rise of roughly 34.6%.
Looking back five years, average prices are up about 2.1% since 2020, a gain of around £14,334 in cash terms.
Zoom out to the past decade for the fuller picture. Back in 2015, homes here averaged £338,487, so the typical sold price has climbed about 107.4% since then, roughly 7.6% a year. Stretch the view to fifteen years and that annual pace eases back to about 6.4%.
Frequently asked questions about Marston Moor
What is the average price for a property for sale in Marston Moor?
The average price for a property for sale in Marston Moor is £525,031. This amount is 12% lower than the average price in Wetherby. There are 1,110 property listings for sale in Marston Moor.
What streets have the most expensive properties for sale in Marston Moor?
The streets with the most expensive properties for sale in Marston Moor are Main Street at an average of £742,500, Turnpike Lane at an average of £494,250 and Oak Road at an average of £487,800.
What streets have the most affordable properties for sale in Marston Moor?
The streets with the most affordable properties for sale in Marston Moor are Tom Cat Lane at an average of £200,000, Warfield Lane at an average of £225,000 and Pinfold Close at an average of £427,500.
Which train stations are available in or near Marston Moor?
Some of the train stations available in or near Marston Moor are Cattal, Hammerton and Knaresborough.
Property Price Paid in Marston Moor by Year
The average sold property price by year was:
| Year | Average Sold Price | Price Change |
Sold Properties
|
|---|---|---|---|
| 2025 | £702,000 | 39% |
4 Properties |
| 2024 | £430,437 | -25% |
8 Properties |
| 2023 | £537,250 | 3% |
4 Properties |
| 2022 | £521,642 | -17% |
7 Properties |
| 2021 | £610,555 | -13% |
9 Properties |
| 2020 | £687,666 | 48% |
3 Properties |
| 2019 | £358,363 | -26% |
13 Properties |
| 2018 | £451,527 | 27% |
11 Properties |
| 2017 | £330,450 | -113% |
10 Properties |
| 2016 | £705,000 | 52% |
1 Property |
Property Price per Property Type in Marston Moor
Here you can find historic sold price data in order to help with your property search.
The average Property Paid Price for specific property types in the last three years are:
| Property Type | Average Sold Price | Sold Properties |
|---|---|---|
| Semi Detached House | £411,250.00 | 4 Semi Detached Houses |
| Terraced House | £272,000.00 | 2 Terraced Houses |
| Detached House | £621,150.00 | 10 Detached Houses |
