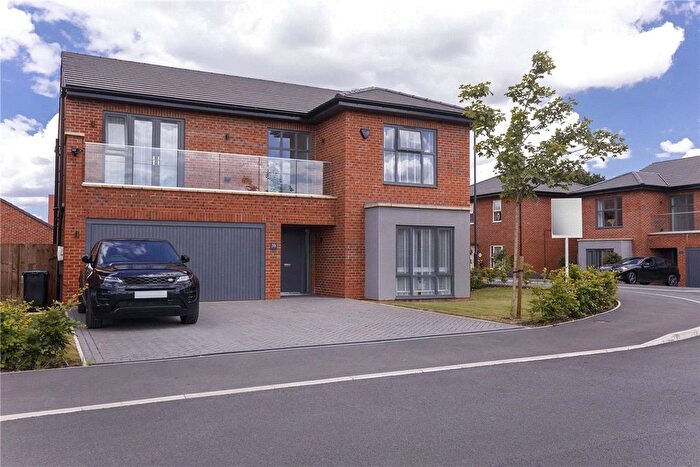
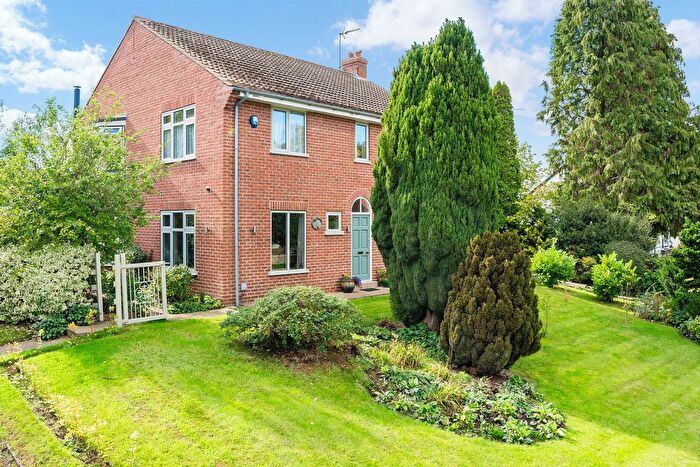
Houses for sale & to rent in Marston Moor, York
House Prices in Marston Moor
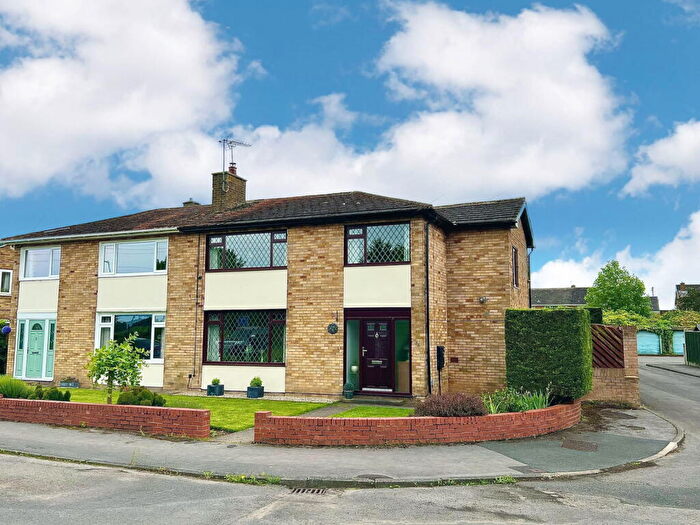
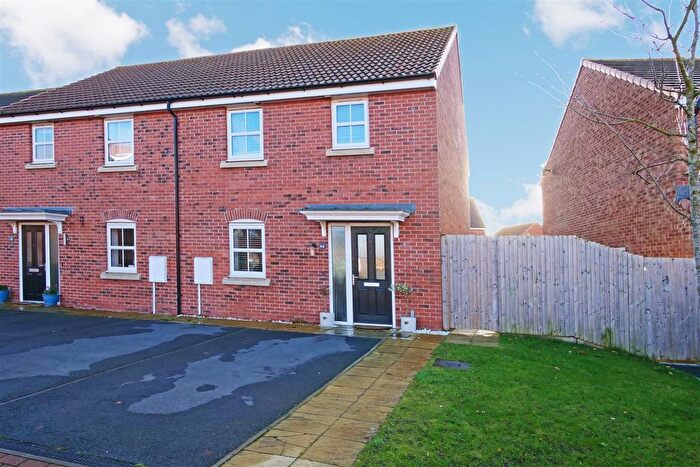
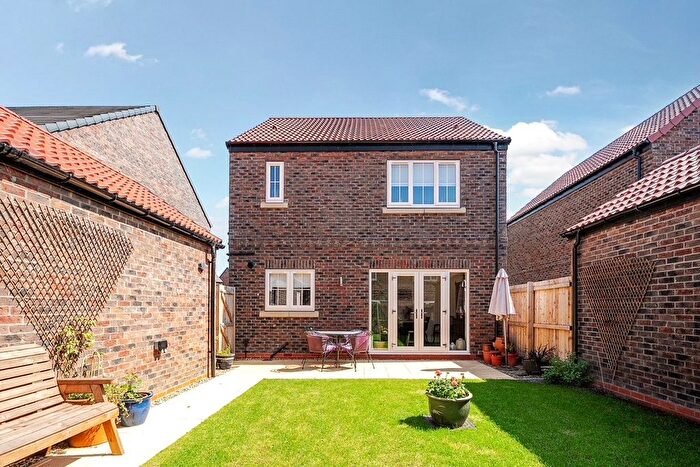
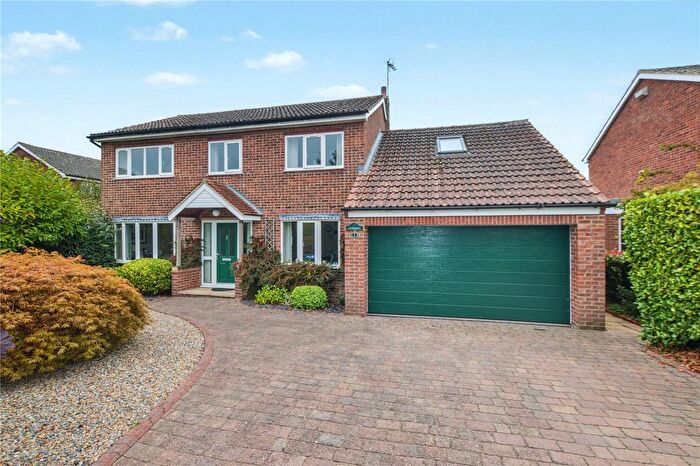
Properties in Marston Moor have an average house price of £415,616.00 and had 97 Property Transactions within the last 3 years¹.
Marston Moor is an area in York, North Yorkshire with 951 households², where the most expensive property was sold for £1,050,000.00.
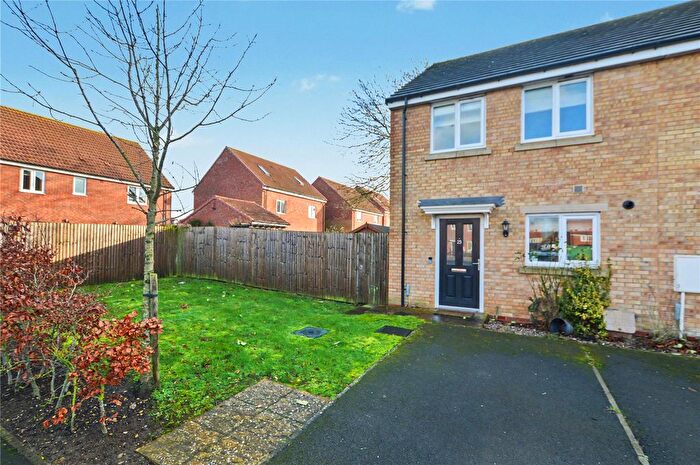
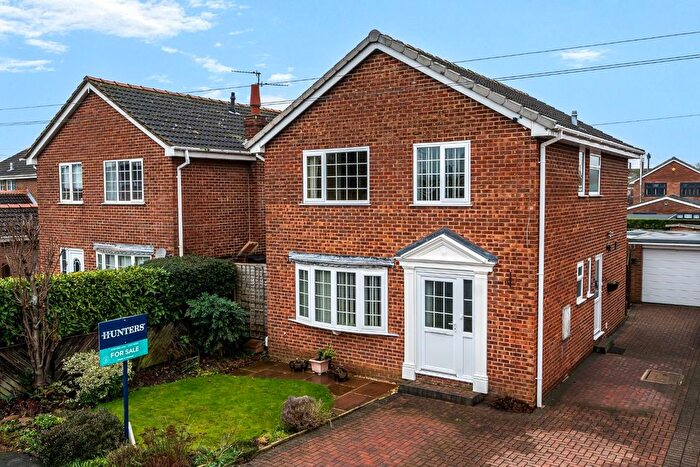
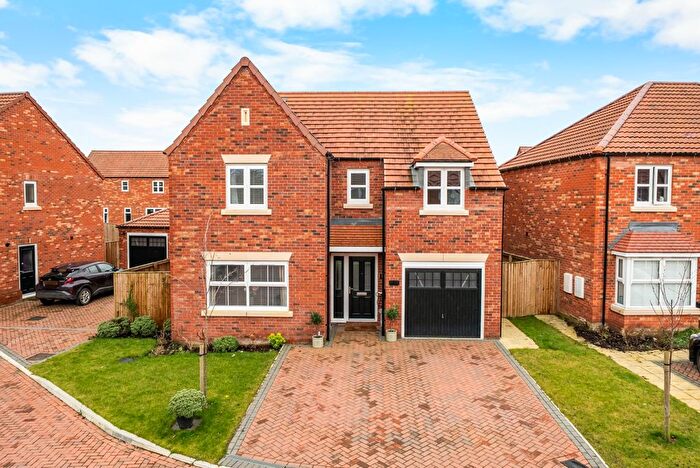
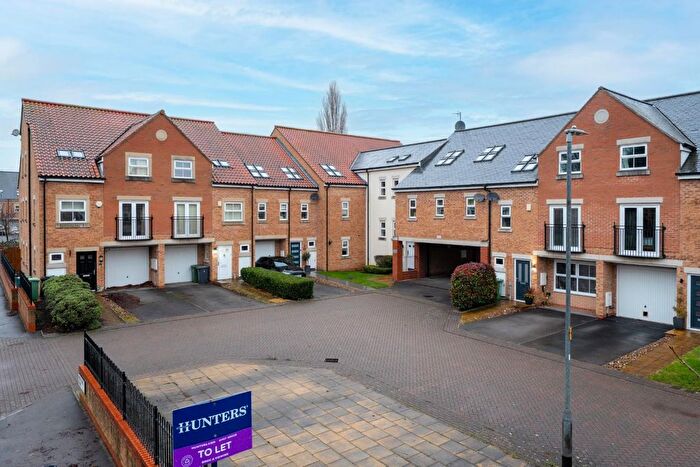
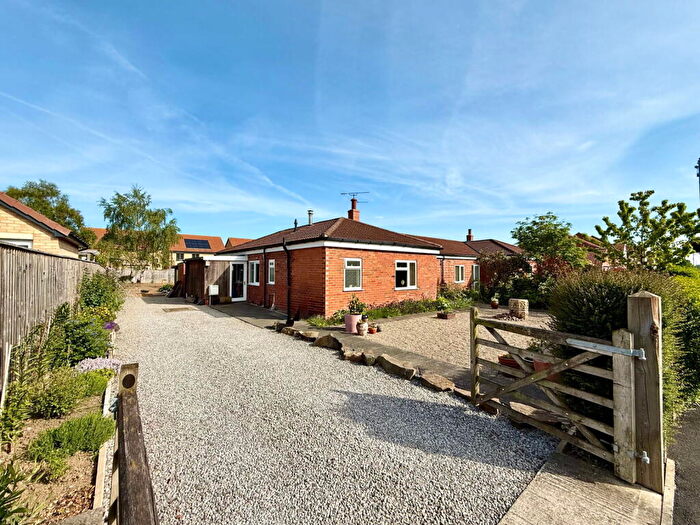
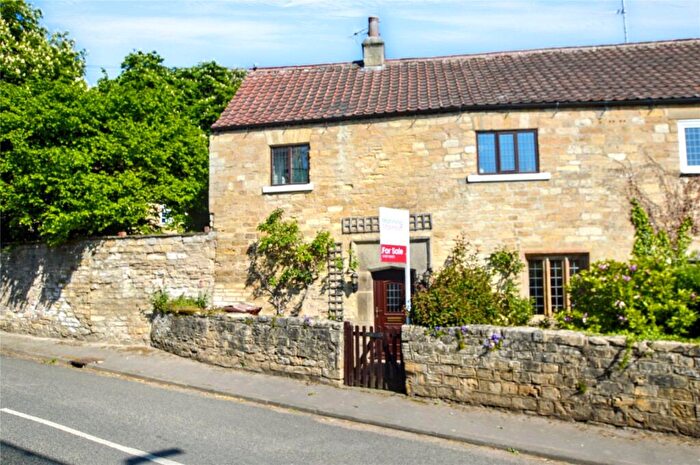
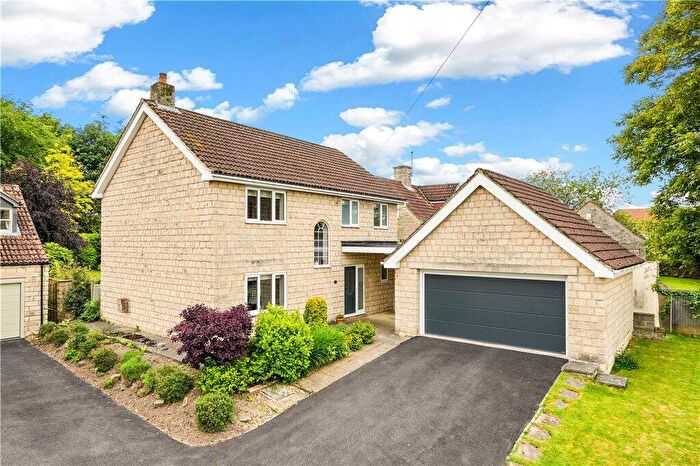
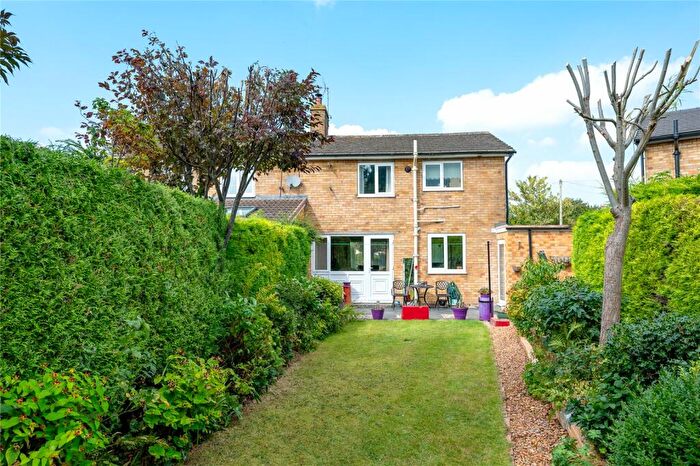
Properties for sale in Marston Moor
Previously listed properties in Marston Moor
Roads and Postcodes in Marston Moor
Navigate through our locations to find the location of your next house in Marston Moor, York for sale or to rent.
| Streets | Postcodes |
|---|---|
| Angram Road | YO26 7LP YO26 7LR YO26 7LQ |
| Atterwith Lane | YO26 7PZ |
| Bramblegate Road | YO26 7SA |
| Broad Oaks Cottages | YO26 7QQ |
| Bunting Drive | YO26 7SB |
| Butt Hedge | YO26 7LW |
| Church Street | YO26 7LG |
| Cowstail Lane | YO26 7SD |
| Crawford Close | YO26 7QT |
| Cromwell Terrace | YO26 7LT YO26 7LU |
| Fairfax Crescent | YO26 7QX |
| Fleet Lane | YO26 7QD YO26 7QE |
| Hall Farm Court | YO26 7PE |
| Helaugh Lane | YO26 7NQ |
| Hutton Drive | YO26 7LY |
| Hutton Hall Farm Cottages | YO26 7LZ |
| Hutton Street | YO26 7NB YO26 7ND |
| Kendal Gardens | YO26 7QR |
| Kendal Lane | YO26 7QN |
| Kirk Lane | YO26 7PX |
| Lucas Grove North | YO26 7QZ |
| Lucas Grove South | YO26 7QA |
| Lucas Road | YO26 7QY |
| Manor Chase | YO26 7RB |
| Marston Moor Business Park | YO26 7QF |
| Marston Road | YO26 7PR |
| Moor Lane | YO26 7NJ YO26 7RF |
| Moorside | YO26 7QG |
| Ness Lane Cottages | YO26 7QL |
| Norfolk Gardens | YO26 7QW |
| North End | YO26 7PH |
| Old Lane | YO26 7LF YO26 7NF |
| Parker Lane | YO26 8BT |
| Post Office Row | YO26 7NW |
| Prince Rupert Drive | YO26 7PT YO26 7PU YO26 7QS |
| Ralph Garth | YO26 7PP |
| Rudgate | YO26 7DW YO26 7NT YO26 7QU |
| Rudgate Business Park | YO26 7RD |
| Saddlers Way | YO26 7LJ |
| Southfield Lane | YO26 7PD YO26 7QP YO26 7RP |
| Spring Lane | YO26 7LX |
| Springfield Lane | YO26 7PN |
| Springfield Terrace | YO26 7QB |
| Station Close | YO26 8FH |
| Station Road | YO26 8DN YO26 8EB |
| The Green | YO26 7RA |
| Tockwith Lane | YO26 7NX YO26 7NY YO26 7NZ YO26 7PA YO26 7RG |
| Tockwith Road | YO26 7PJ YO26 7PQ YO26 7PL |
| Well House Close | YO26 7PF |
| Westfield Green | YO26 7RE |
| Westfield Lane | YO26 7PW |
| Westfield Road | YO26 7PY |
| Westlands | YO26 7LH |
| Wetherby Road | YO26 7NE YO26 7NG YO26 7NH YO26 7NS YO26 7NU |
| Wilstrop | YO26 8HA YO26 8HB |
| York Road | YO26 7NL YO26 7PB YO26 7PG YO26 8EQ |
| YO23 3PA YO26 7LN YO26 7NN YO26 7QJ YO26 7LL YO26 7NA YO26 7NP YO26 7RJ YO26 7RQ YO26 8BD YO26 8DB YO26 8JW |
Transport near Marston Moor
-
Hammerton Station
-
Cattal Station
-
Poppleton Station
-
York Station
-
Ulleskelf Station
-
Knaresborough Station
-
Church Fenton Station
-
Starbeck Station
- FAQ
- Price Paid By Year
- Property Type Price
Frequently asked questions about Marston Moor
What is the average price for a property for sale in Marston Moor?
The average price for a property for sale in Marston Moor is £415,616. This amount is 1% lower than the average price in York. There are 431 property listings for sale in Marston Moor.
What streets have the most expensive properties for sale in Marston Moor?
The streets with the most expensive properties for sale in Marston Moor are Well House Close at an average of £785,000, Church Street at an average of £695,000 and Angram Road at an average of £606,000.
What streets have the most affordable properties for sale in Marston Moor?
The streets with the most affordable properties for sale in Marston Moor are Bramblegate Road at an average of £242,355, Moor Lane at an average of £245,000 and Bunting Drive at an average of £250,833.
Which train stations are available in or near Marston Moor?
Some of the train stations available in or near Marston Moor are Hammerton, Cattal and Poppleton.
Property Price Paid in Marston Moor by Year
The average sold property price by year was:
| Year | Average Sold Price | Price Change |
Sold Properties
|
|---|---|---|---|
| 2025 | £482,385 | 29% |
34 Properties |
| 2024 | £344,448 | -22% |
34 Properties |
| 2023 | £420,774 | -0,4% |
29 Properties |
| 2022 | £422,327 | -2% |
43 Properties |
| 2021 | £429,167 | 24% |
62 Properties |
| 2020 | £324,446 | -15% |
56 Properties |
| 2019 | £372,247 | 3% |
61 Properties |
| 2018 | £361,469 | -1% |
66 Properties |
| 2017 | £365,779 | -1% |
42 Properties |
| 2016 | £368,167 | 7% |
34 Properties |
| 2015 | £342,634 | 10% |
37 Properties |
| 2014 | £308,146 | 8% |
43 Properties |
| 2013 | £282,728 | -13% |
30 Properties |
| 2012 | £320,201 | 9% |
32 Properties |
| 2011 | £290,025 | -1% |
20 Properties |
| 2010 | £292,707 | 5% |
30 Properties |
| 2009 | £277,218 | -9% |
32 Properties |
| 2008 | £303,486 | -18% |
18 Properties |
| 2007 | £358,925 | 17% |
48 Properties |
| 2006 | £297,864 | 5% |
46 Properties |
| 2005 | £283,482 | 16% |
32 Properties |
| 2004 | £237,261 | -1% |
34 Properties |
| 2003 | £240,598 | 22% |
44 Properties |
| 2002 | £187,467 | 31% |
46 Properties |
| 2001 | £129,698 | -11% |
35 Properties |
| 2000 | £143,865 | 23% |
39 Properties |
| 1999 | £110,381 | -0,4% |
44 Properties |
| 1998 | £110,848 | -6% |
27 Properties |
| 1997 | £117,569 | 20% |
63 Properties |
| 1996 | £93,652 | 14% |
61 Properties |
| 1995 | £80,448 | - |
30 Properties |
Property Price per Property Type in Marston Moor
Here you can find historic sold price data in order to help with your property search.
The average Property Paid Price for specific property types in the last three years are:
| Property Type | Average Sold Price | Sold Properties |
|---|---|---|
| Semi Detached House | £327,149.00 | 26 Semi Detached Houses |
| Detached House | £473,493.00 | 62 Detached Houses |
| Terraced House | £272,477.00 | 9 Terraced Houses |

