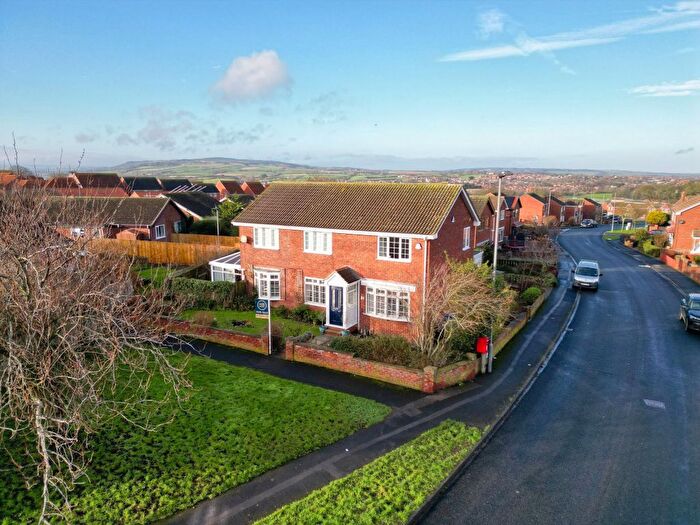
Houses for sale & to rent in Fylingdales, Whitby
House Prices in Fylingdales
Properties in Fylingdales have an average house price of £351,101.00 and had 75 Property Transactions within the last 3 years¹.
Fylingdales is an area in Whitby, North Yorkshire with 827 households², where the most expensive property was sold for £810,000.00.
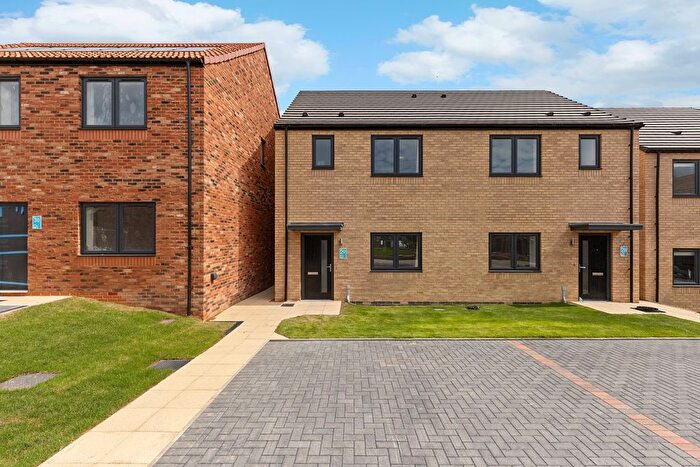
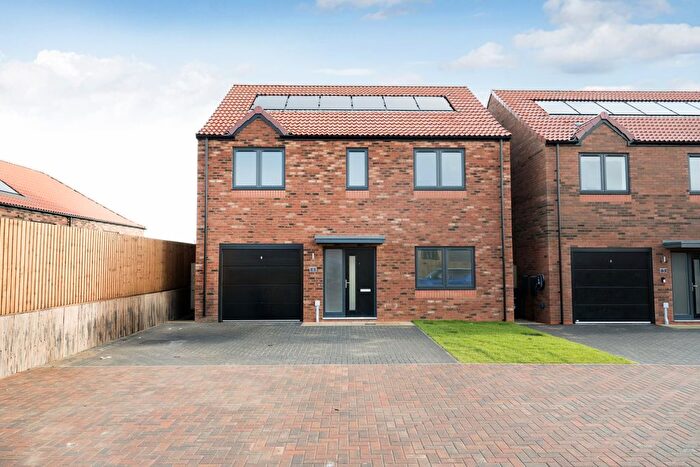
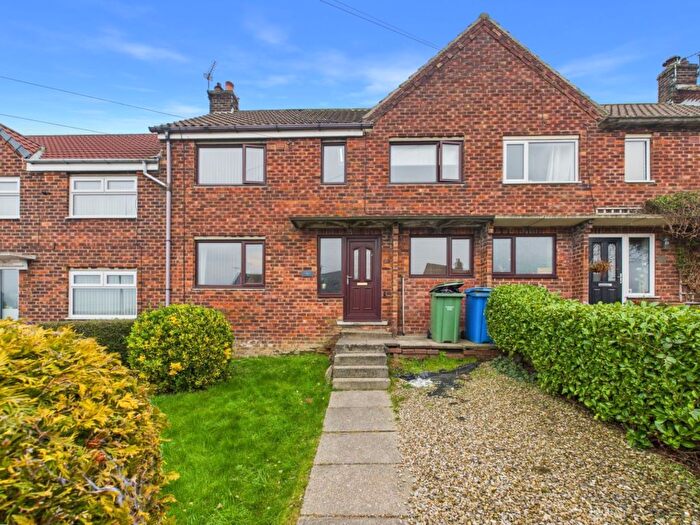
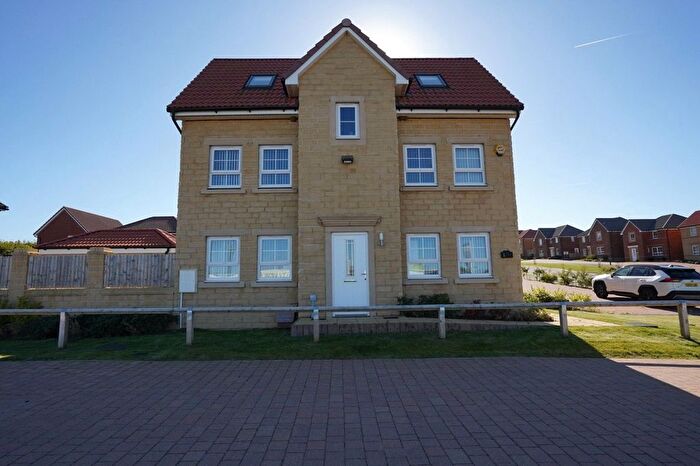
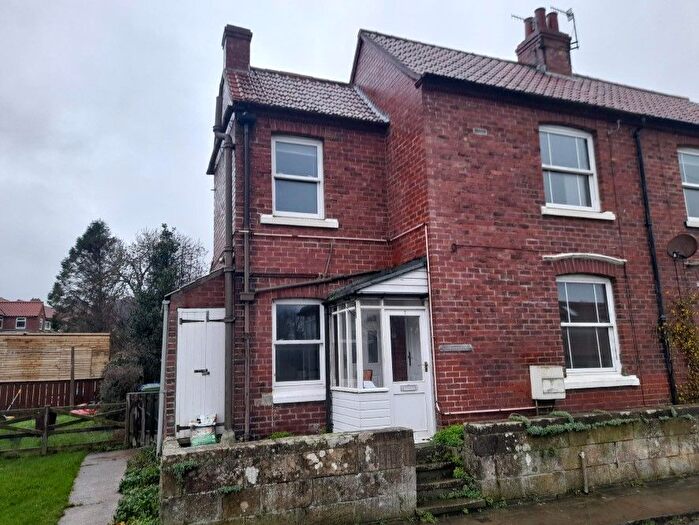
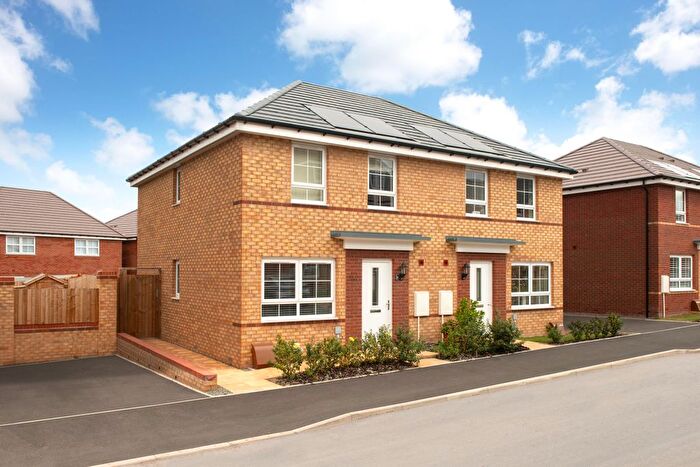
Properties for sale in Fylingdales
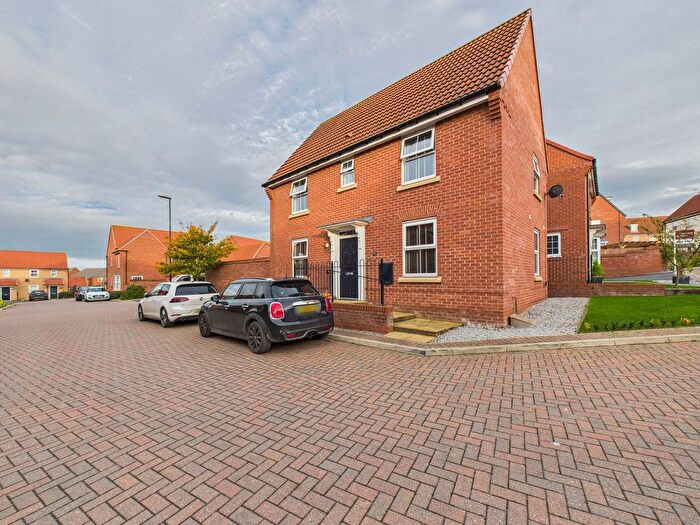
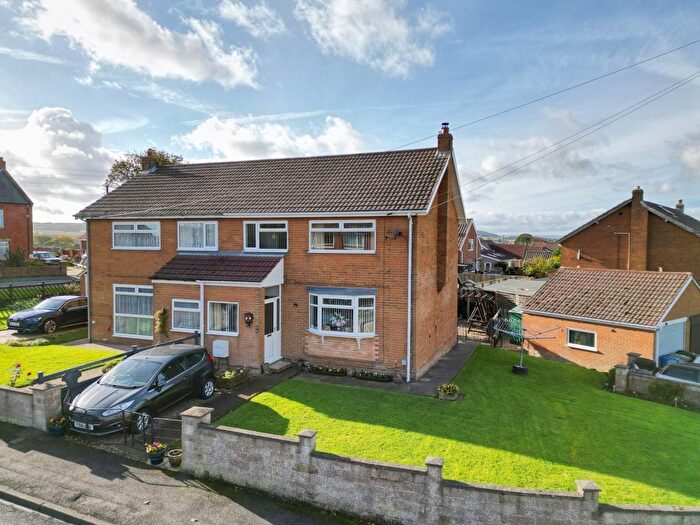
Previously listed properties in Fylingdales
Roads and Postcodes in Fylingdales
Navigate through our locations to find the location of your next house in Fylingdales, Whitby for sale or to rent.
| Streets | Postcodes |
|---|---|
| Albion Road | YO22 4SW |
| Back Lane | YO22 4LU |
| Bay Bank | YO22 4SE |
| Beechfield | YO22 4LQ |
| Belmont Place | YO22 4RU |
| Bloomswell | YO22 4RT |
| Brig Garth | YO22 4SS |
| Chapel Street | YO22 4SQ |
| Church Lane | YO22 4PN YO22 4PW |
| Cliff Street | YO22 4RY |
| Coastguard Cottages | YO22 4SY |
| Covet Hill | YO22 4SN |
| Dale View | YO22 4NS |
| Elm Grove | YO22 4RB |
| Fisherhead | YO22 4ST |
| Golden Grove | YO22 5HH |
| Hall Farm Road | YO22 4LS |
| King Street | YO22 4SH |
| Kingston Garth | YO22 4UN |
| Laburnum Avenue | YO22 4RR |
| Littlewood Terrace | YO22 4SU |
| Lowcroft | YO22 4TS |
| Manor Road | YO22 4RP |
| Martins Row | YO22 4SD |
| Maypole Green | YO22 4TX |
| Middlewood Close | YO22 4UD |
| Middlewood Crescent | YO22 4UE |
| Middlewood Lane | YO22 4TT YO22 4UB |
| Middlewood Meadow | YO22 4UP |
| Mill Beck | YO22 4UQ |
| Mill Lane | YO22 4LT |
| Mill View | YO22 4LD |
| Moorland Terrace | YO22 4TW |
| Mount Pleasant East | YO22 4RF |
| Mount Pleasant North | YO22 4RE |
| Mount Pleasant South | YO22 4RQ |
| Mulgrave View | YO22 4NX |
| New Road | YO22 4SF |
| Nookfield Close | YO22 4PY |
| North Terrace | YO22 4TL |
| Old Church Lane | YO22 4TR |
| Plane Tree Street | YO22 4SX |
| Prospect Field | YO22 4LG YO22 4RH |
| Raw Pasture | YO22 4PQ |
| Rigg View | YO22 4NR |
| Robin Hoods Bay | YO22 4PD YO22 4PJ YO22 4RD |
| Saltwick Bay | YO22 4JX |
| Shell Hill | YO22 4SL |
| Silver Street | YO22 4SB |
| Sledgates | YO22 4TZ |
| Station Road | YO22 4LB YO22 4RA YO22 4RL |
| Summerfield Lane | YO22 4NU |
| Sunny Place | YO22 4SA |
| Sunnyside | YO22 4SR |
| The Bolts | YO22 4SG |
| The Close | YO22 4RG |
| The Dock | YO22 4SJ |
| The Esplanade | YO22 4RS |
| The Square | YO22 4RX |
| The Terrace | YO22 4TP |
| Thorpe Bank | YO22 4UA |
| Thorpe Green | YO22 4TY |
| Thorpe Green Bank | YO22 4TU |
| Thorpe Lane | YO22 4RN YO22 4TH YO22 4TN YO22 4TQ |
| Tommy Baxter Street | YO22 4RZ |
| Tysons Row | YO22 4SP |
| Victoria Terrace | YO22 4RJ |
| Wesley Road | YO22 4RW |
| Whitby Road | YO22 4PB YO22 4PE |
| YO22 4JU YO22 4JY YO22 4LE YO22 4LH YO22 4LJ YO22 4LN YO22 4LP YO22 4LR YO22 4NT YO22 4PA YO22 4PP YO22 4PR YO22 4PS YO22 4QE YO22 4QF YO22 4QG YO22 4QH YO22 4QJ YO22 4QL YO22 4QN |
Transport near Fylingdales
- FAQ
- Price Paid By Year
- Property Type Price
Frequently asked questions about Fylingdales
What is the average price for a property for sale in Fylingdales?
The average price for a property for sale in Fylingdales is £351,101. This amount is 18% higher than the average price in Whitby. There are 504 property listings for sale in Fylingdales.
What streets have the most expensive properties for sale in Fylingdales?
The streets with the most expensive properties for sale in Fylingdales are Station Road at an average of £570,000, Church Lane at an average of £539,000 and The Square at an average of £520,000.
What streets have the most affordable properties for sale in Fylingdales?
The streets with the most affordable properties for sale in Fylingdales are Sledgates at an average of £225,000, Rigg View at an average of £234,975 and Prospect Field at an average of £258,818.
Which train stations are available in or near Fylingdales?
Some of the train stations available in or near Fylingdales are Ruswarp, Whitby and Sleights.
Property Price Paid in Fylingdales by Year
The average sold property price by year was:
| Year | Average Sold Price | Price Change |
Sold Properties
|
|---|---|---|---|
| 2025 | £348,366 | -1% |
15 Properties |
| 2024 | £352,384 | 0,3% |
29 Properties |
| 2023 | £351,224 | -1% |
31 Properties |
| 2022 | £355,875 | 7% |
30 Properties |
| 2021 | £331,794 | -2% |
46 Properties |
| 2020 | £338,100 | 27% |
41 Properties |
| 2019 | £245,697 | -14% |
30 Properties |
| 2018 | £279,039 | 2% |
37 Properties |
| 2017 | £274,381 | 22% |
30 Properties |
| 2016 | £215,350 | -11% |
34 Properties |
| 2015 | £238,844 | -12% |
43 Properties |
| 2014 | £267,369 | 14% |
42 Properties |
| 2013 | £231,040 | 3% |
30 Properties |
| 2012 | £223,420 | -8% |
25 Properties |
| 2011 | £240,806 | -1% |
37 Properties |
| 2010 | £243,624 | 1% |
31 Properties |
| 2009 | £241,843 | 9% |
29 Properties |
| 2008 | £221,130 | -9% |
34 Properties |
| 2007 | £241,142 | 5% |
46 Properties |
| 2006 | £227,982 | 0,3% |
43 Properties |
| 2005 | £227,290 | 7% |
46 Properties |
| 2004 | £211,659 | 20% |
39 Properties |
| 2003 | £169,917 | 22% |
52 Properties |
| 2002 | £132,934 | 13% |
45 Properties |
| 2001 | £115,294 | 12% |
42 Properties |
| 2000 | £101,148 | 13% |
37 Properties |
| 1999 | £88,407 | 20% |
48 Properties |
| 1998 | £70,556 | -7% |
46 Properties |
| 1997 | £75,599 | 16% |
73 Properties |
| 1996 | £63,866 | -7% |
33 Properties |
| 1995 | £68,635 | - |
31 Properties |
Property Price per Property Type in Fylingdales
Here you can find historic sold price data in order to help with your property search.
The average Property Paid Price for specific property types in the last three years are:
| Property Type | Average Sold Price | Sold Properties |
|---|---|---|
| Semi Detached House | £313,837.00 | 16 Semi Detached Houses |
| Detached House | £389,304.00 | 23 Detached Houses |
| Terraced House | £350,062.00 | 35 Terraced Houses |
| Flat | £105,000.00 | 1 Flat |

