
Houses for sale in Whitby, North Yorkshire
House Prices in Whitby
Properties in Whitby have an average house price of £299k and had 1,100 Property Transactions within the last 3 years.¹
Whitby is an area in North Yorkshire with 10,564 households², where the most expensive property was sold for £2.1M.
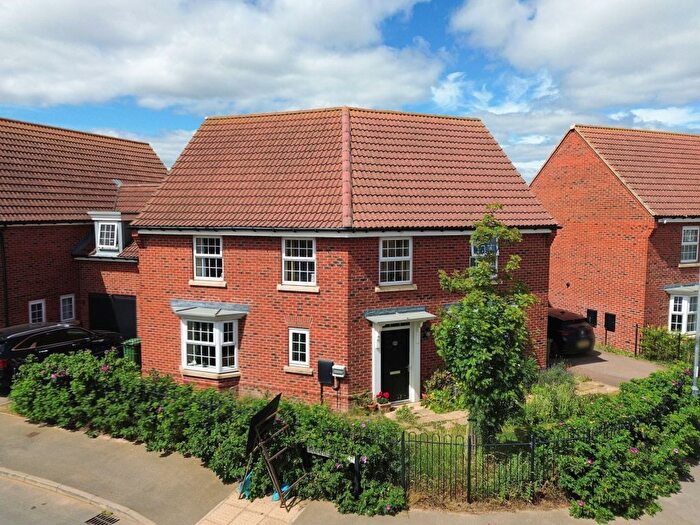
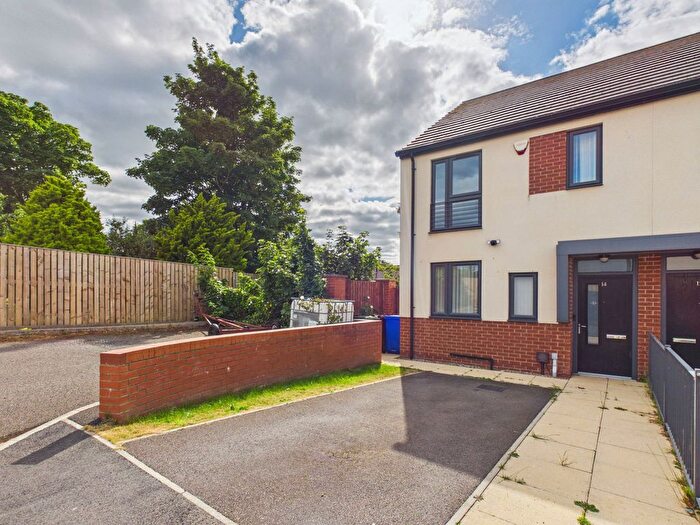
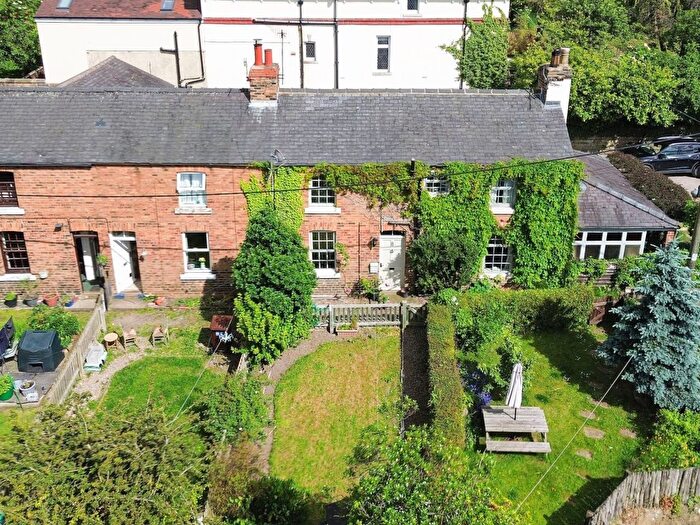
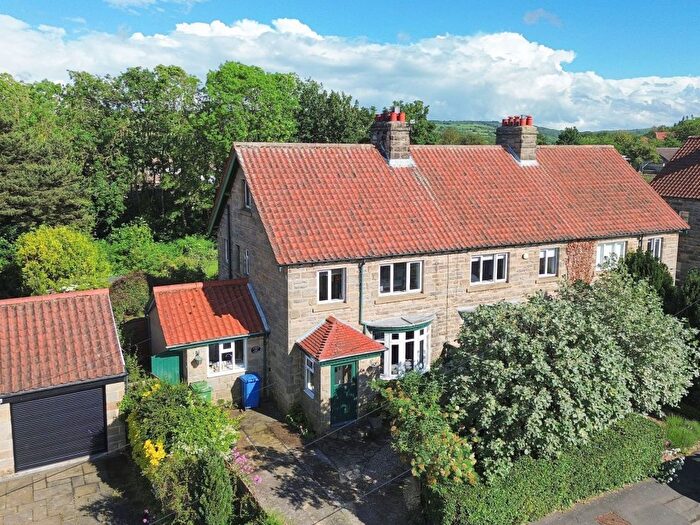
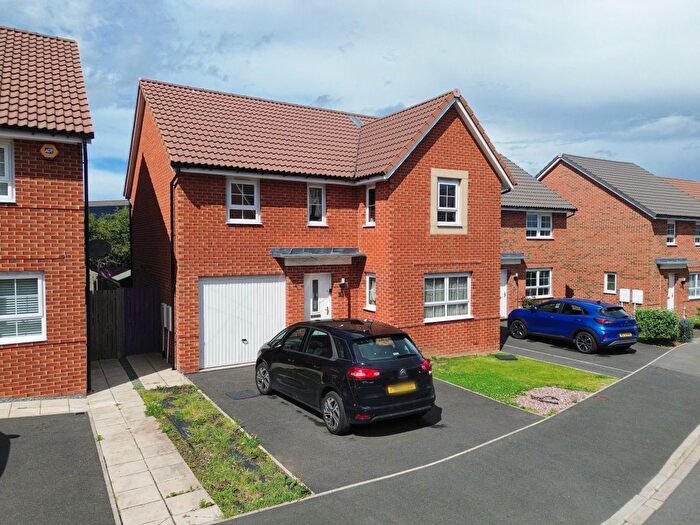
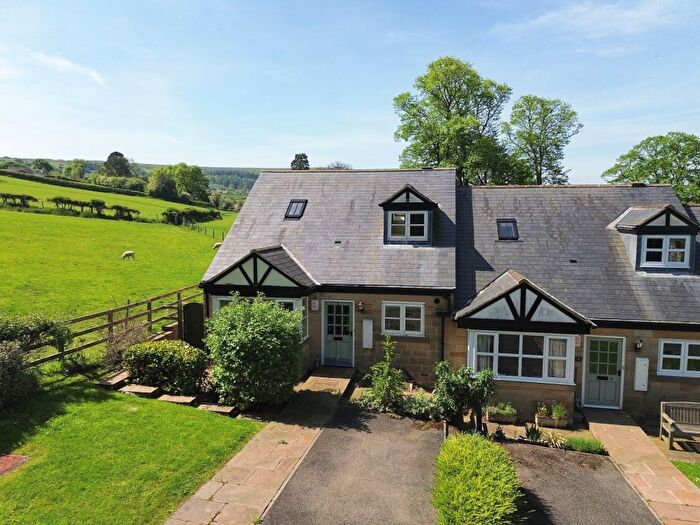
Properties for sale in Whitby
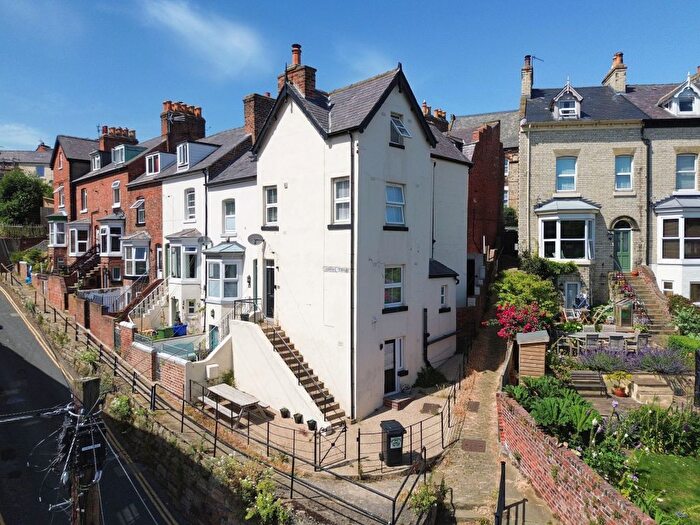
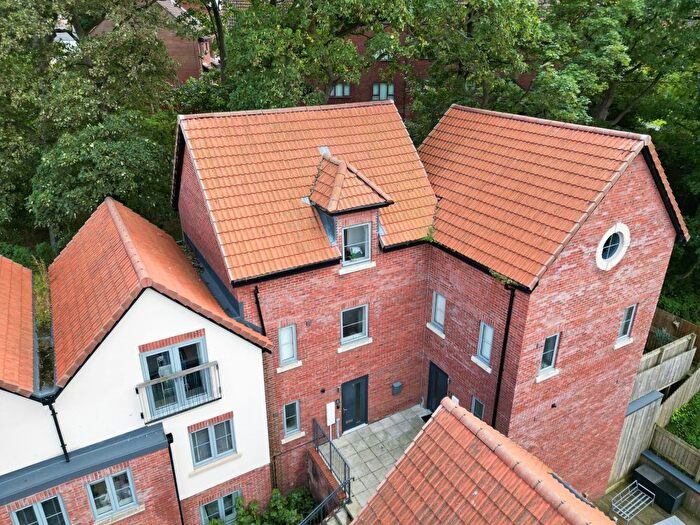
![]()
If you are looking to sell your house, let it out, or receive a property valuation, an expert can help you.
Click the button below to get started.
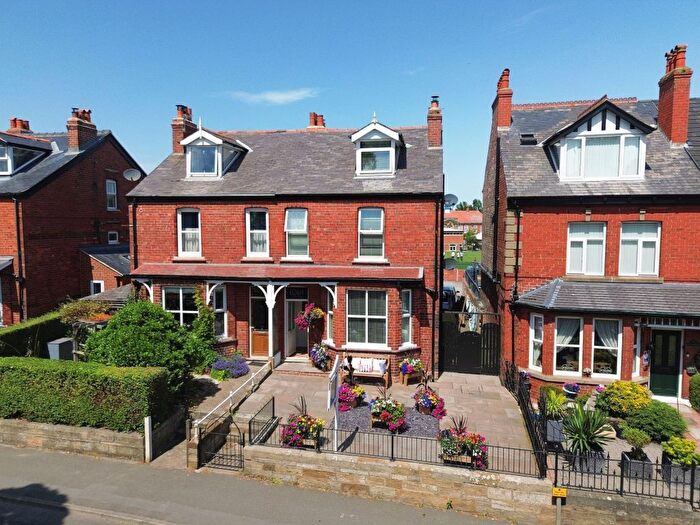
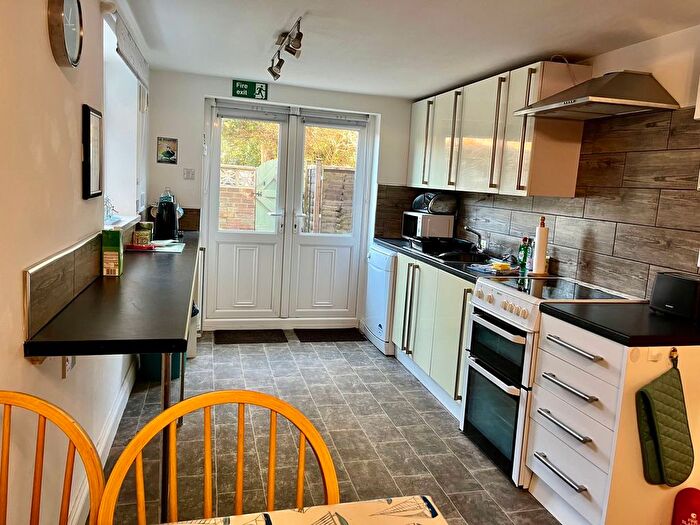
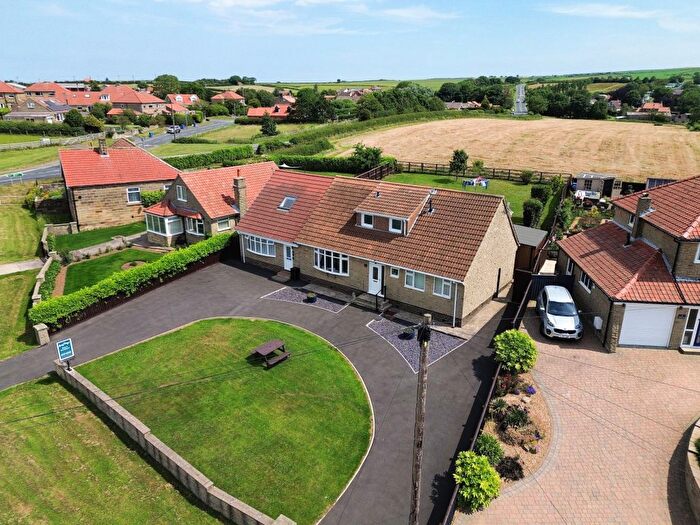
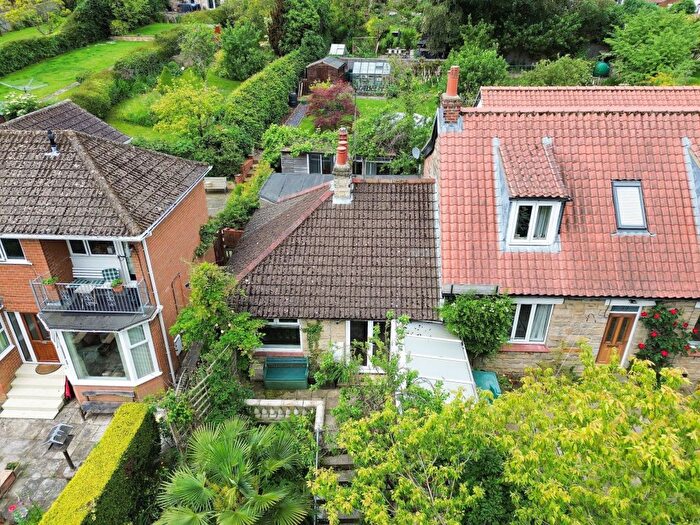
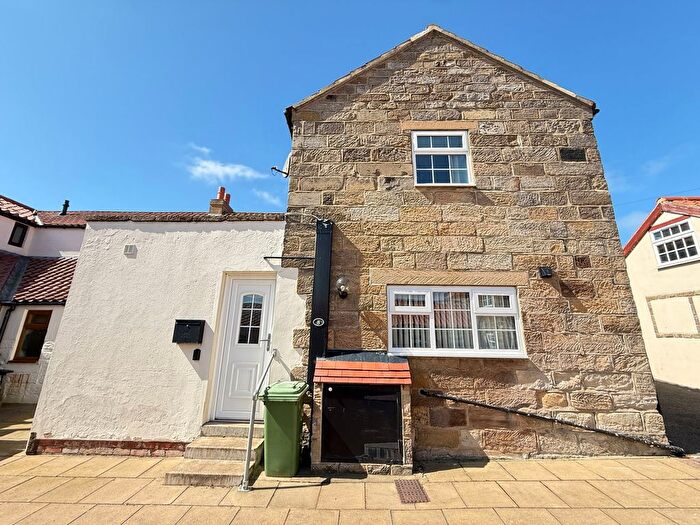
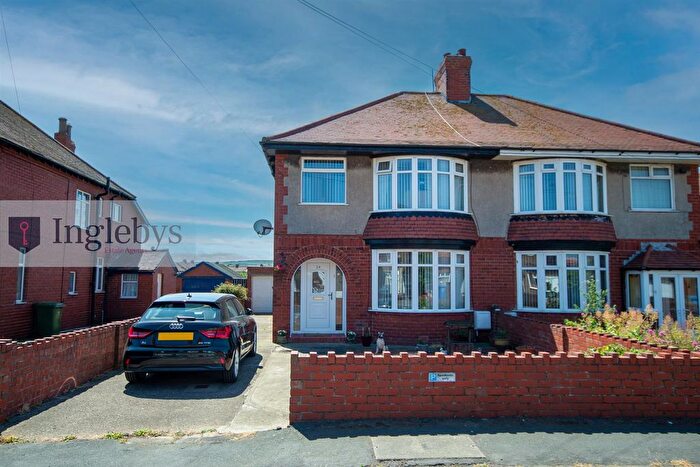
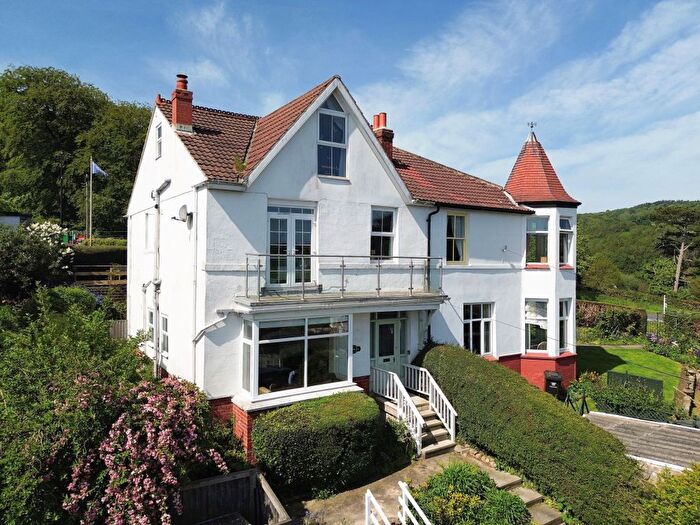
Previously listed properties in Whitby
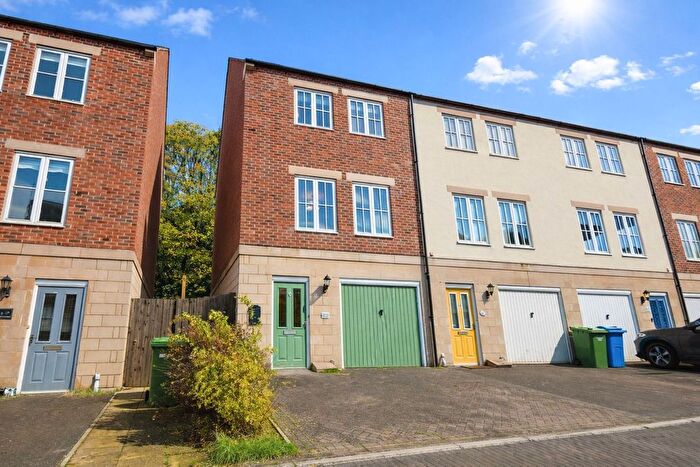
![]()
If you are looking to sell your house, let it out, or receive a property valuation, an expert can help you.
Click the button below to get started.
Neighbourhoods in Whitby
Navigate through our locations to find the location of your next house in Whitby, North Yorkshire for sale or to rent.
Property price trends in Whitby
According to the latest Land Registry data, the average home in Whitby sold for £264,724 in 2026. That figure comes from a substantial record of 15,179 sales logged over the past 31 years.
Prices have fallen back over the last three years. Compared with 2023, when the typical sale came in around £305,026, that's a fall of roughly 13.2%.
Looking back five years, average prices are down about 3.7% since 2021, a drop of around £10,113 in cash terms.
Zoom out to the past decade for the fuller picture. Back in 2016, homes here averaged £201,454, so the typical sold price has climbed about 31.4% since then, roughly 2.8% a year. Stretch the view to fifteen years and that annual pace eases back to about 1.7%.
Frequently asked questions about Whitby
What is the average price for a property for sale in Whitby?
The average price for a property for sale in Whitby is £299,281. This amount is 5% lower than the average price in North Yorkshire. There are 2,801 property listings for sale in Whitby.
What locations have the most expensive properties for sale in Whitby?
The locations with the most expensive properties for sale in Whitby are Mulgrave at an average of £537,750, Danby & Mulgrave at an average of £530,250 and Fylingdales & Ravenscar at an average of £475,000.
What locations have the most affordable properties for sale in Whitby?
The locations with the most affordable properties for sale in Whitby are Streonshalh at an average of £217,783, Whitby West Cliff at an average of £261,604 and Mayfield at an average of £286,402.
Which train stations are available in or near Whitby?
Some of the train stations available in or near Whitby are Sleights, Ruswarp and Whitby.
Property Price Paid in Whitby by Year
The average sold property price by year was:
| Year | Average Sold Price | Price Change |
Sold Properties
|
|---|---|---|---|
| 2026 | £264,724 | -17% |
22 Properties |
| 2025 | £308,785 | 7% |
329 Properties |
| 2024 | £287,658 | -6% |
384 Properties |
| 2023 | £305,026 | 1% |
365 Properties |
| 2022 | £300,550 | 9% |
425 Properties |
| 2021 | £274,837 | 10% |
603 Properties |
| 2020 | £248,636 | 16% |
508 Properties |
| 2019 | £209,035 | 0,1% |
551 Properties |
| 2018 | £208,804 | 4% |
561 Properties |
| 2017 | £199,916 | -1% |
569 Properties |
Property Price per Property Type in Whitby
Here you can find historic sold price data in order to help with your property search.
The average Property Paid Price for specific property types in the last three years are:
| Property Type | Average Sold Price | Sold Properties |
|---|---|---|
| Semi Detached House | £283,754.00 | 317 Semi Detached Houses |
| Detached House | £430,498.00 | 296 Detached Houses |
| Terraced House | £253,942.00 | 322 Terraced Houses |
| Flat | £182,196.00 | 165 Flats |
Transport in Whitby
Please see below transportation links in this area:
