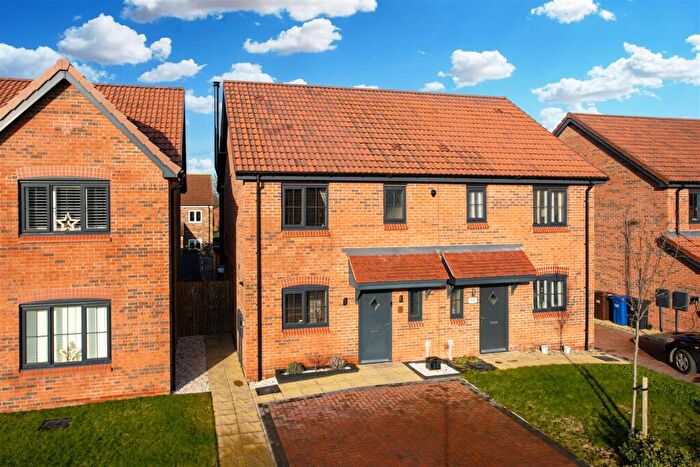
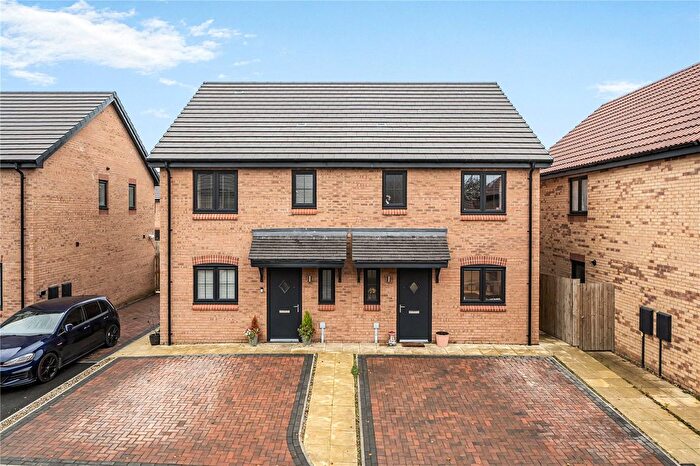
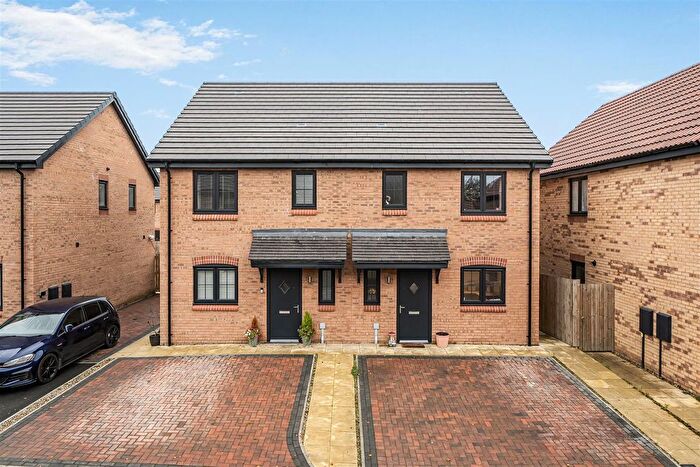
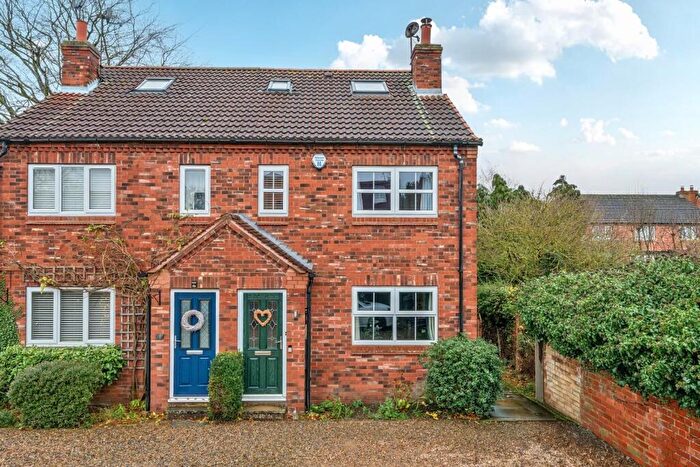
Houses for sale & to rent in Appleton Roebuck, York
House Prices in Appleton Roebuck
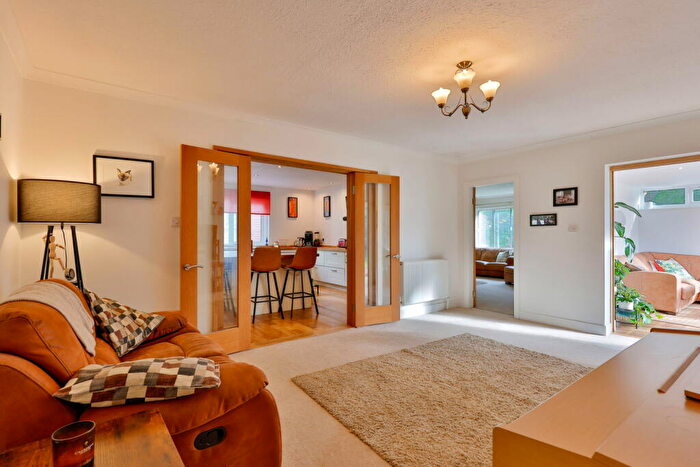
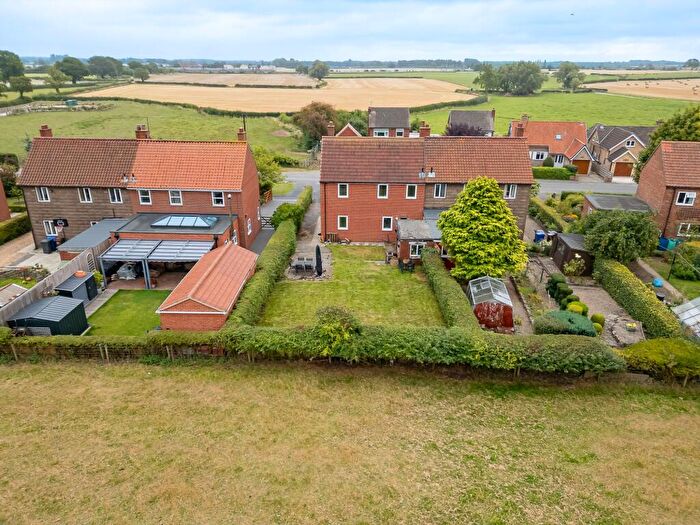
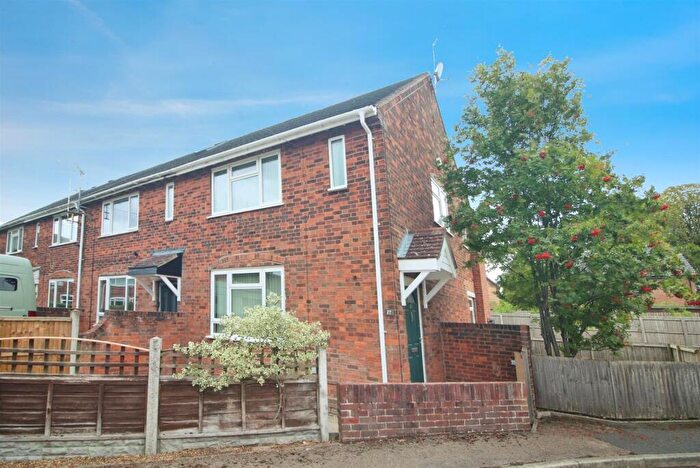
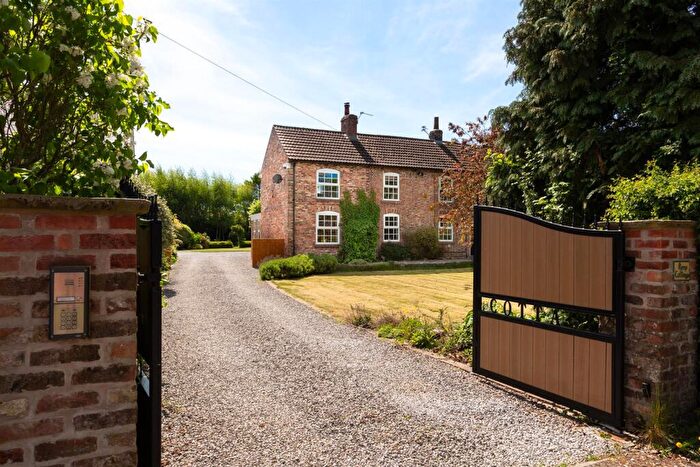
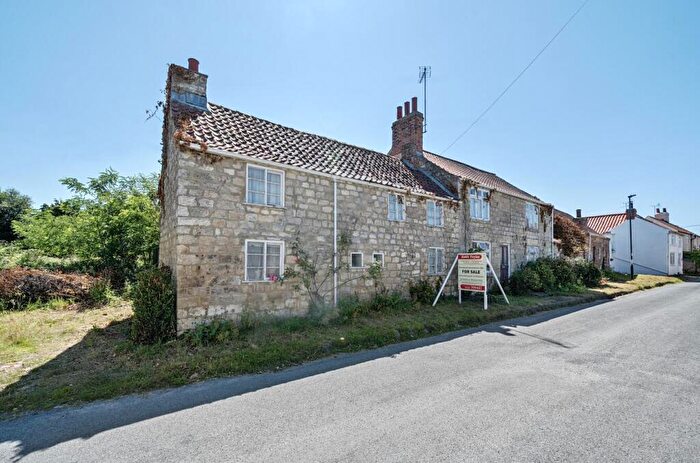
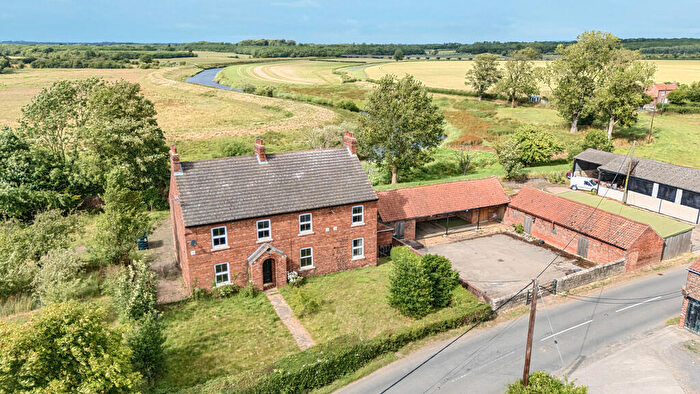
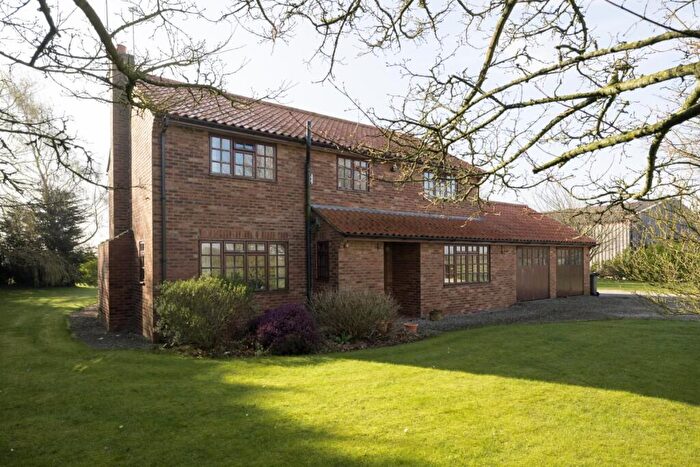
Properties in Appleton Roebuck have an average house price of £487,828.00 and had 47 Property Transactions within the last 3 years¹.
Appleton Roebuck is an area in York, North Yorkshire with 498 households², where the most expensive property was sold for £1,150,000.00.
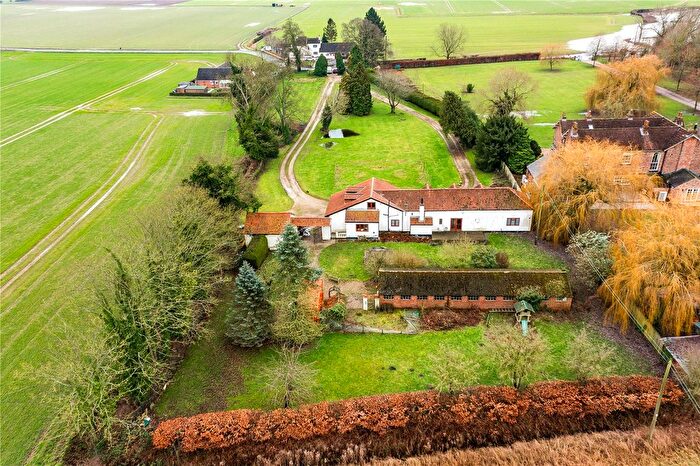
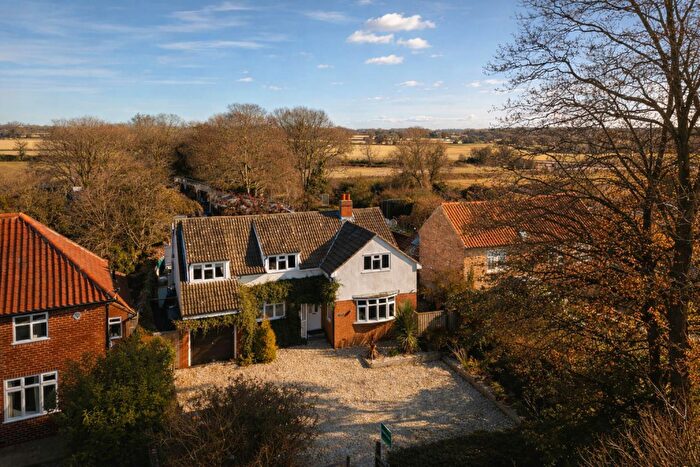
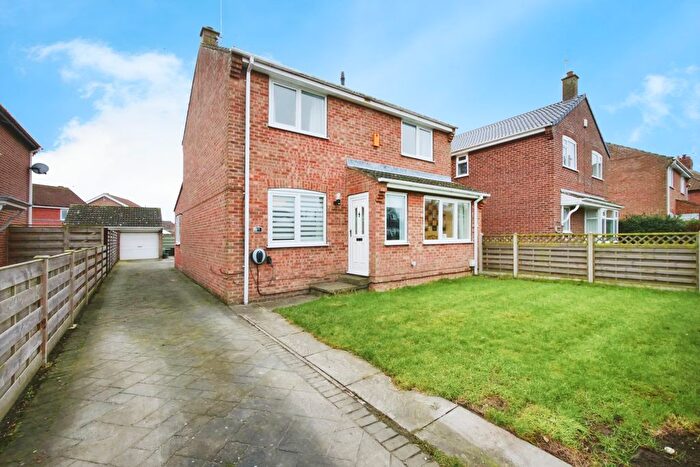
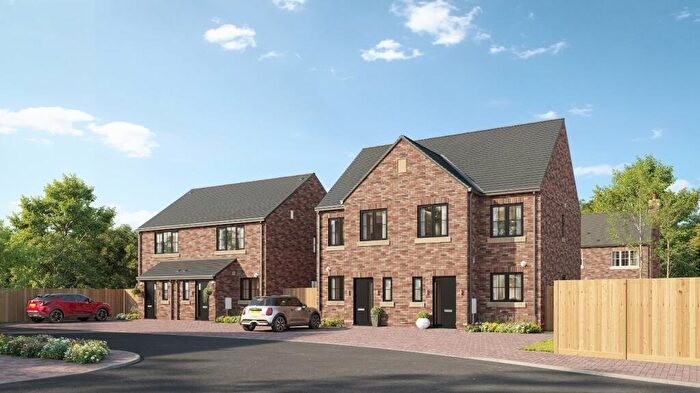
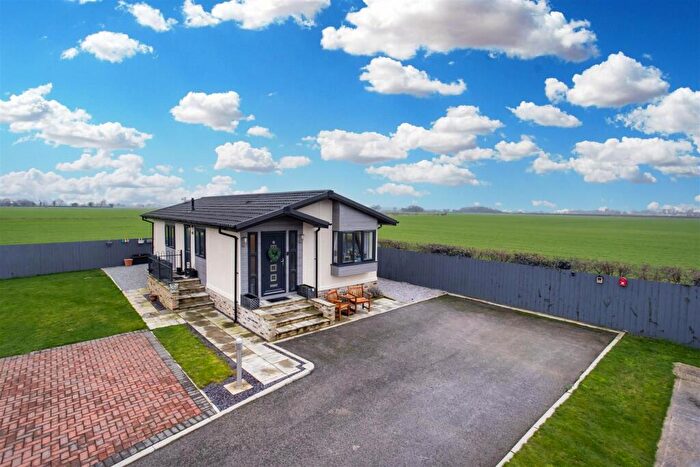
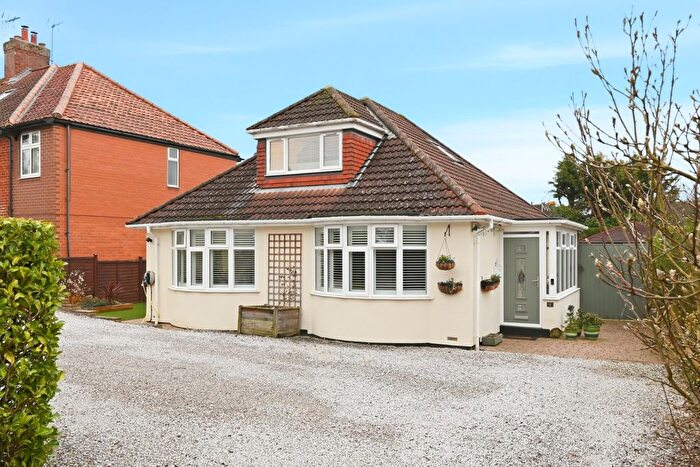
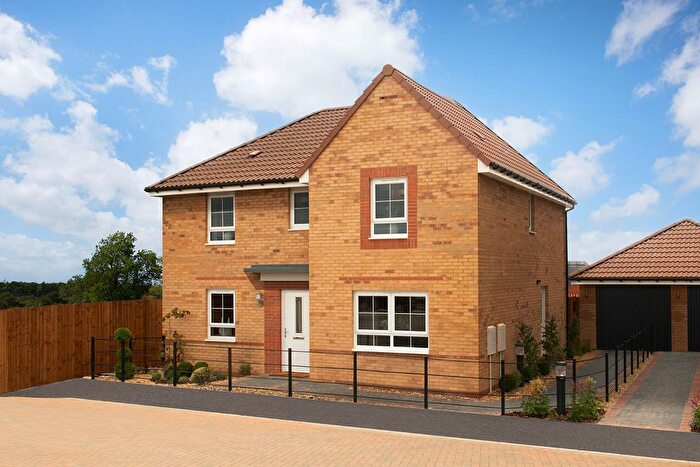
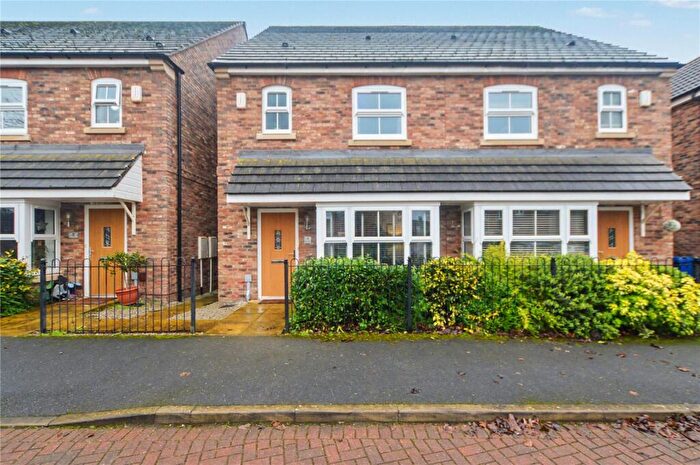
Properties for sale in Appleton Roebuck
Roads and Postcodes in Appleton Roebuck
Navigate through our locations to find the location of your next house in Appleton Roebuck, York for sale or to rent.
| Streets | Postcodes |
|---|---|
| Ainsty Garth | YO23 7BU |
| Back Lane | YO23 3PL |
| Bond Lane | YO23 7EF |
| Briars Court | YO23 7BY |
| Broad Lane | YO23 7DS |
| Cat Lane | YO23 3PJ YO23 3PN |
| Chapel Green | YO23 7DP YO23 7DR |
| Church Lane | YO23 7DF |
| Church View | YO23 7AF |
| Colton Bridge Cottages | YO23 7DU |
| Daw Lane | YO23 7BL YO23 7DL |
| Fairfax Close | YO23 7AY |
| Glebe Close | YO23 7HB |
| Holme Green | YO23 7BH YO23 7BJ |
| Hornington Cottages | YO23 7AS |
| Lilac Avenue | YO23 7DH |
| Low Farm Close | YO23 7HA |
| Low Farm Road | YO23 7AH |
| Main Street | YO23 3PH YO23 7DA YO23 7DD YO23 7DG YO23 7DJ YO23 7DN YO23 7DQ YO23 7DW YO23 7HJ |
| Malt Kiln Lane | YO23 7DT |
| Marsh Lane | YO23 7BA |
| Northfield Avenue | YO23 7EB |
| Northfield Close | YO23 7ED |
| Northfield Way | YO23 7EA |
| Old Manor Gardens | YO23 3NE |
| Orchard Close | YO23 7DB |
| Rectory Close | YO23 7AX |
| Redhill Field Lane | YO23 3PG |
| School Lane | YO23 7AD |
| Southfield Grange | YO23 7EH |
| Station Road | YO23 7AP |
| Tadcaster Road | YO23 3PP |
| Villa Farm Way | YO23 7AZ |
| Vine Cottages | YO23 7AE |
| Watson Garth | YO23 7EE |
| West End Avenue | YO23 7DE |
| Westfield Drive | YO23 7EG |
| Wheatley Croft | YO23 7BX |
| YO23 3PQ YO23 7AA YO23 7AB YO23 7AL YO23 7BF YO23 7BP |
Transport near Appleton Roebuck
-
Ulleskelf Station
-
Church Fenton Station
-
Sherburn-In-Elmet Station
-
York Station
-
Poppleton Station
-
South Milford Station
-
Selby Station
-
Micklefield Station
-
Hammerton Station
-
East Garforth Station
- FAQ
- Price Paid By Year
- Property Type Price
Frequently asked questions about Appleton Roebuck
What is the average price for a property for sale in Appleton Roebuck?
The average price for a property for sale in Appleton Roebuck is £487,828. This amount is 16% higher than the average price in York. There are 503 property listings for sale in Appleton Roebuck.
What streets have the most expensive properties for sale in Appleton Roebuck?
The streets with the most expensive properties for sale in Appleton Roebuck are Bond Lane at an average of £735,000, School Lane at an average of £655,000 and Malt Kiln Lane at an average of £634,500.
What streets have the most affordable properties for sale in Appleton Roebuck?
The streets with the most affordable properties for sale in Appleton Roebuck are West End Avenue at an average of £95,885, Vine Cottages at an average of £280,000 and Chapel Green at an average of £353,333.
Which train stations are available in or near Appleton Roebuck?
Some of the train stations available in or near Appleton Roebuck are Ulleskelf, Church Fenton and Sherburn-In-Elmet.
Property Price Paid in Appleton Roebuck by Year
The average sold property price by year was:
| Year | Average Sold Price | Price Change |
Sold Properties
|
|---|---|---|---|
| 2025 | £420,348 | -30% |
14 Properties |
| 2024 | £547,113 | 8% |
11 Properties |
| 2023 | £501,127 | -10% |
22 Properties |
| 2022 | £553,269 | 8% |
26 Properties |
| 2021 | £506,980 | 6% |
28 Properties |
| 2020 | £474,665 | -0,4% |
16 Properties |
| 2019 | £476,444 | -6% |
18 Properties |
| 2018 | £502,880 | 30% |
23 Properties |
| 2017 | £352,011 | -15% |
21 Properties |
| 2016 | £403,550 | 12% |
19 Properties |
| 2015 | £354,449 | -5% |
27 Properties |
| 2014 | £373,913 | 11% |
30 Properties |
| 2013 | £332,394 | -17% |
19 Properties |
| 2012 | £389,176 | 7% |
17 Properties |
| 2011 | £361,642 | 8% |
20 Properties |
| 2010 | £332,510 | 6% |
15 Properties |
| 2009 | £313,322 | -28% |
20 Properties |
| 2008 | £402,535 | -18% |
14 Properties |
| 2007 | £476,170 | 35% |
29 Properties |
| 2006 | £309,286 | -6% |
22 Properties |
| 2005 | £327,607 | -23% |
32 Properties |
| 2004 | £402,523 | 37% |
21 Properties |
| 2003 | £253,639 | -17% |
19 Properties |
| 2002 | £296,289 | 43% |
19 Properties |
| 2001 | £168,509 | -6% |
17 Properties |
| 2000 | £177,981 | 9% |
15 Properties |
| 1999 | £162,004 | 1% |
21 Properties |
| 1998 | £160,789 | 25% |
23 Properties |
| 1997 | £120,815 | 7% |
29 Properties |
| 1996 | £112,847 | 10% |
22 Properties |
| 1995 | £101,117 | - |
13 Properties |
Property Price per Property Type in Appleton Roebuck
Here you can find historic sold price data in order to help with your property search.
The average Property Paid Price for specific property types in the last three years are:
| Property Type | Average Sold Price | Sold Properties |
|---|---|---|
| Semi Detached House | £370,840.00 | 7 Semi Detached Houses |
| Detached House | £572,733.00 | 31 Detached Houses |
| Terraced House | £286,366.00 | 9 Terraced Houses |

