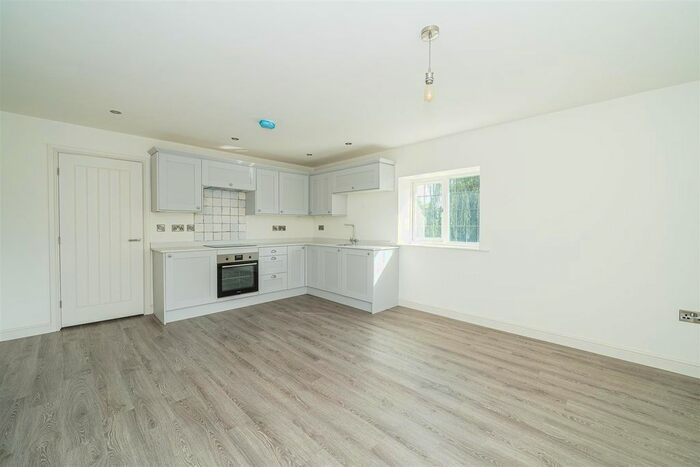
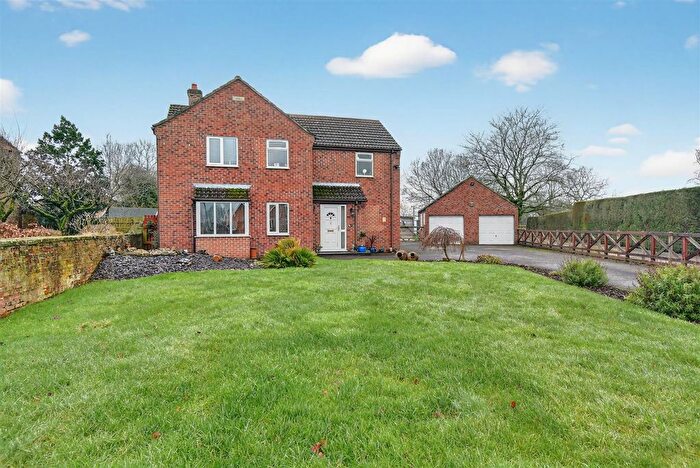
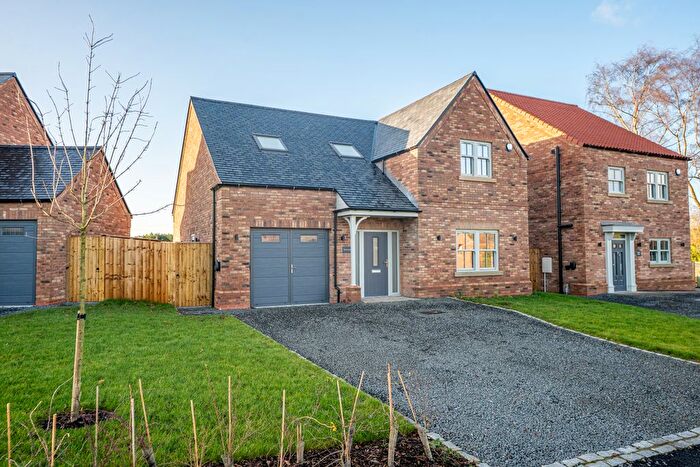
Houses for sale & to rent in Helperby, York
House Prices in Helperby
Properties in Helperby have an average house price of £467,088.00 and had 73 Property Transactions within the last 3 years¹.
Helperby is an area in York, North Yorkshire with 640 households², where the most expensive property was sold for £1,700,000.00.
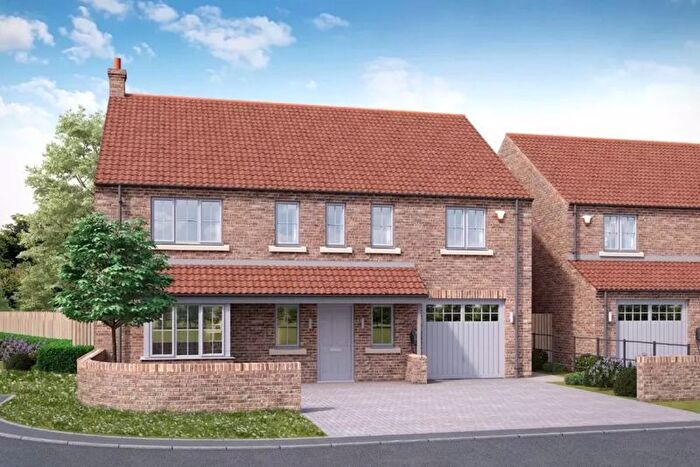
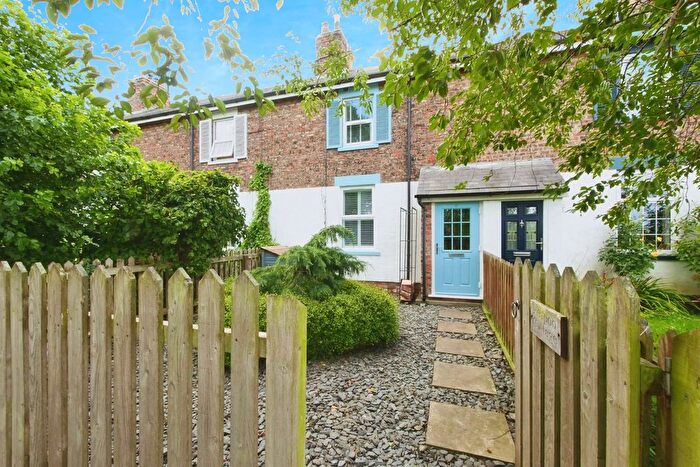
Properties for sale in Helperby
Previously listed properties in Helperby
Roads and Postcodes in Helperby
Navigate through our locations to find the location of your next house in Helperby, York for sale or to rent.
| Streets | Postcodes |
|---|---|
| Back Lane | YO61 2PL YO61 3LT |
| Birchwood Gardens | YO61 2QN |
| Boroughbridge Road | YO61 2PB YO61 2QB |
| Brafferton Hall Gardens | YO61 2NW |
| Bridge Street | YO61 2NU YO61 2NX |
| Derrings Lane | YO61 1SU |
| Drury Lane | YO61 2PJ |
| Dun Royal | YO61 2PY |
| Dun Royal Close | YO61 2NH |
| Flawith Road | YO61 1SG |
| Fox Garth | YO61 2QL |
| Hall Lane | YO61 2NY YO61 2RD |
| Main Street | YO61 2NS YO61 2NT YO61 2PS YO61 2PW |
| Manor Drive | YO61 2QA |
| Moor Lane | YO61 2RA |
| Moorfields | YO61 3UZ |
| North End | YO61 3LF |
| Raskelf Road | YO61 2PF YO61 2PG |
| Red Houses | YO61 4NW |
| Roedeer Cottages | YO61 3UY |
| School Terrace | YO61 2PA |
| Somerset Pastures | YO61 3UF |
| St Peters Close | YO61 2NP |
| Station Cottages | YO61 3LJ |
| Swale View | YO61 2PX |
| The Green | YO61 3LD YO61 3LE YO61 3LQ |
| The Maltings | YO61 2NQ |
| The Oaks | YO61 2QJ |
| The Orchard | YO61 1SX |
| The Orchards | YO61 2NR |
| Thirsk Road | YO61 3NJ YO61 3NQ |
| Tofts Lane | YO61 2PU |
| West Moor Lane | YO61 3LU |
| YO61 1SL YO61 1SN YO61 2NZ YO61 2PQ YO61 2QF YO61 2QH YO61 2QS YO61 2QT YO61 2QY YO61 2QZ YO61 3LB YO61 3LG YO61 3LS YO61 4NL YO61 4NN |
Transport near Helperby
- FAQ
- Price Paid By Year
- Property Type Price
Frequently asked questions about Helperby
What is the average price for a property for sale in Helperby?
The average price for a property for sale in Helperby is £467,088. This amount is 11% higher than the average price in York. There are 231 property listings for sale in Helperby.
What streets have the most expensive properties for sale in Helperby?
The streets with the most expensive properties for sale in Helperby are St Peters Close at an average of £675,000, The Green at an average of £557,188 and Thirsk Road at an average of £522,500.
What streets have the most affordable properties for sale in Helperby?
The streets with the most affordable properties for sale in Helperby are Roedeer Cottages at an average of £141,500, Raskelf Road at an average of £170,000 and Bridge Street at an average of £213,000.
Which train stations are available in or near Helperby?
Some of the train stations available in or near Helperby are Thirsk, Cattal and Hammerton.
Property Price Paid in Helperby by Year
The average sold property price by year was:
| Year | Average Sold Price | Price Change |
Sold Properties
|
|---|---|---|---|
| 2025 | £416,486 | -22% |
24 Properties |
| 2024 | £508,176 | 10% |
34 Properties |
| 2023 | £454,920 | 9% |
15 Properties |
| 2022 | £415,160 | -4% |
28 Properties |
| 2021 | £432,102 | 14% |
37 Properties |
| 2020 | £372,841 | 11% |
46 Properties |
| 2019 | £330,567 | 6% |
25 Properties |
| 2018 | £311,963 | 0,1% |
30 Properties |
| 2017 | £311,539 | 3% |
23 Properties |
| 2016 | £302,081 | -18% |
30 Properties |
| 2015 | £356,923 | 21% |
30 Properties |
| 2014 | £280,901 | -28% |
22 Properties |
| 2013 | £359,640 | 15% |
25 Properties |
| 2012 | £307,410 | -18% |
28 Properties |
| 2011 | £363,206 | 25% |
23 Properties |
| 2010 | £272,896 | 9% |
23 Properties |
| 2009 | £248,431 | -36% |
22 Properties |
| 2008 | £337,786 | 14% |
19 Properties |
| 2007 | £291,128 | 1% |
35 Properties |
| 2006 | £288,014 | 6% |
31 Properties |
| 2005 | £271,063 | 16% |
30 Properties |
| 2004 | £227,049 | -5% |
42 Properties |
| 2003 | £239,329 | 26% |
39 Properties |
| 2002 | £176,879 | 23% |
38 Properties |
| 2001 | £136,123 | 2% |
43 Properties |
| 2000 | £132,816 | 16% |
44 Properties |
| 1999 | £111,679 | 5% |
25 Properties |
| 1998 | £105,563 | 20% |
38 Properties |
| 1997 | £84,258 | 9% |
34 Properties |
| 1996 | £76,895 | -9% |
32 Properties |
| 1995 | £83,745 | - |
28 Properties |
Property Price per Property Type in Helperby
Here you can find historic sold price data in order to help with your property search.
The average Property Paid Price for specific property types in the last three years are:
| Property Type | Average Sold Price | Sold Properties |
|---|---|---|
| Semi Detached House | £400,264.00 | 17 Semi Detached Houses |
| Detached House | £549,192.00 | 40 Detached Houses |
| Terraced House | £332,829.00 | 16 Terraced Houses |

