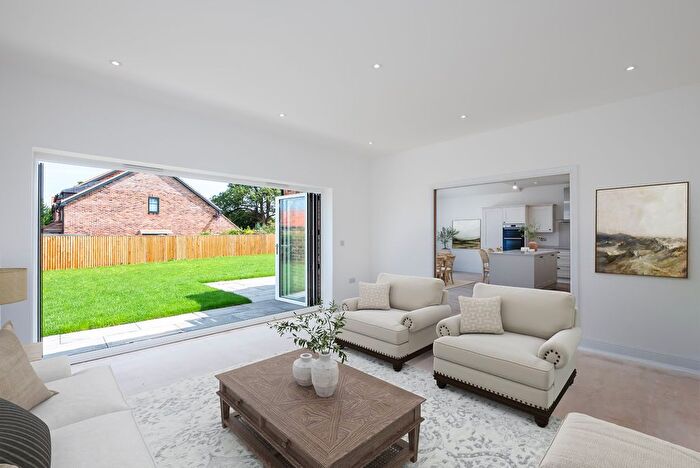
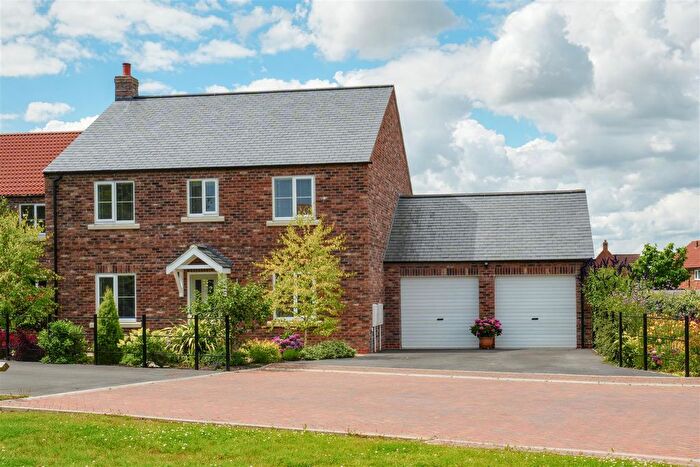
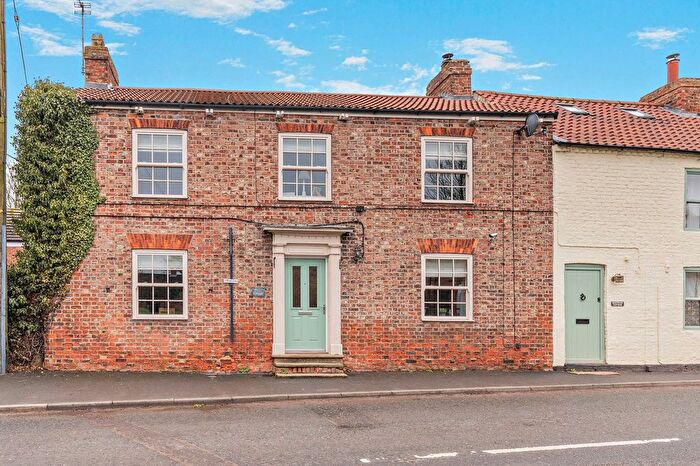
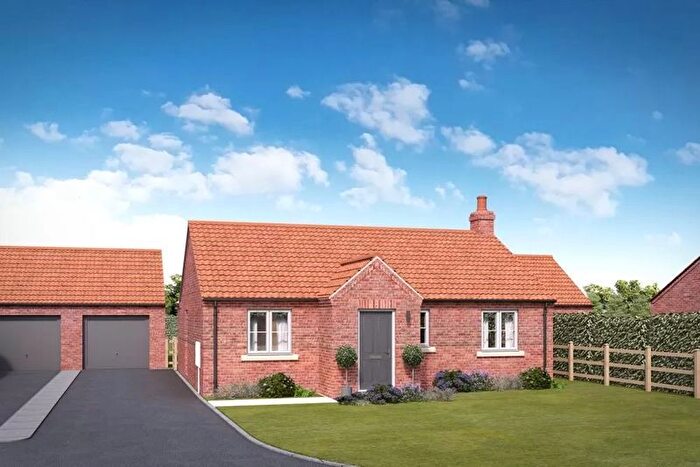
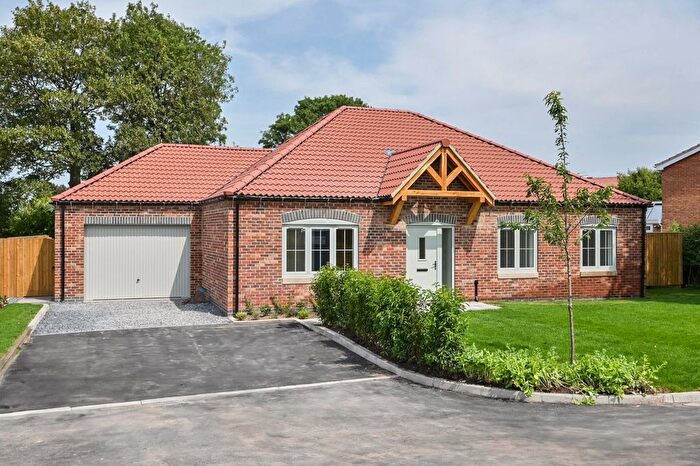
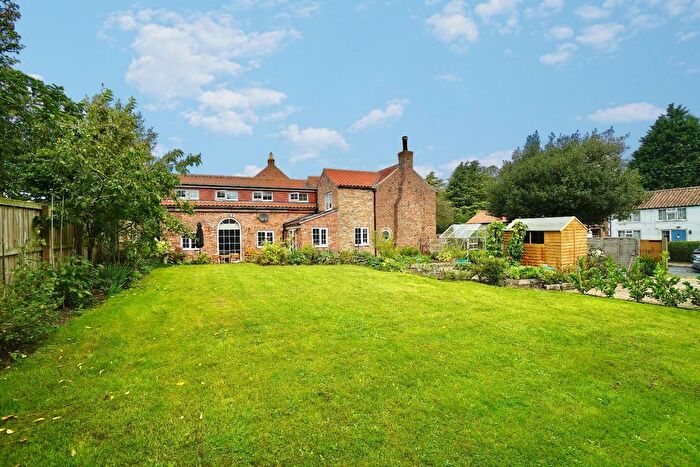
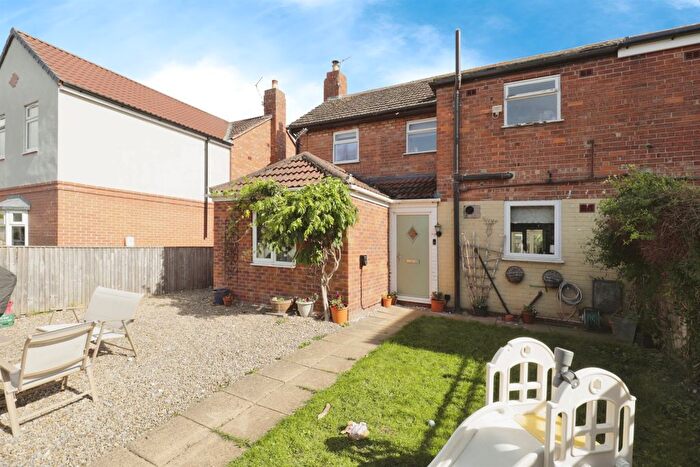
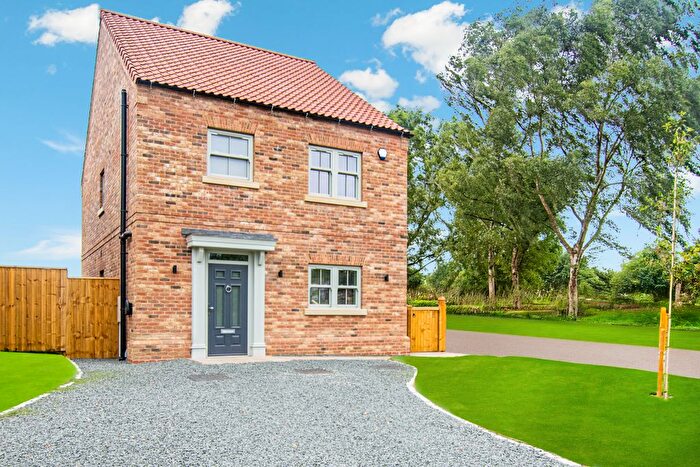
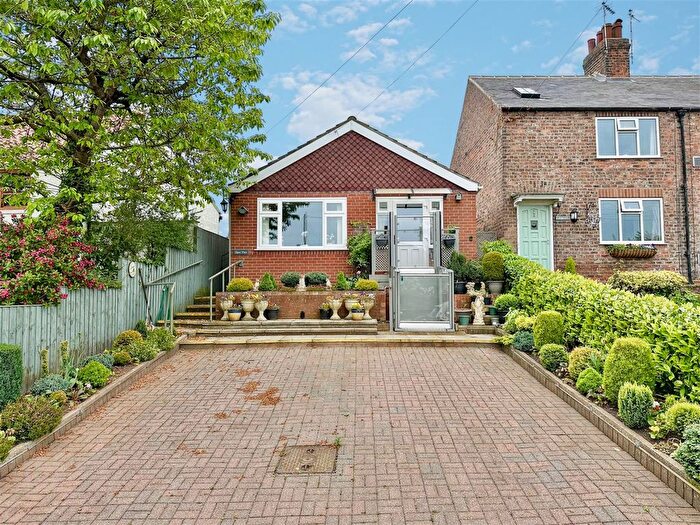
Houses for sale & to rent in Tollerton, York
House Prices in Tollerton
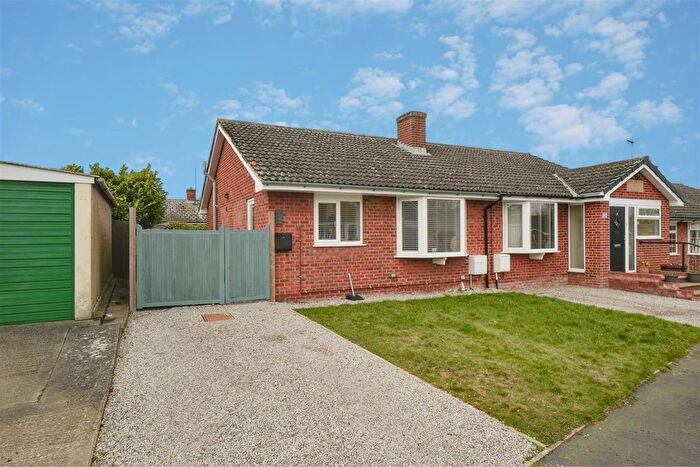
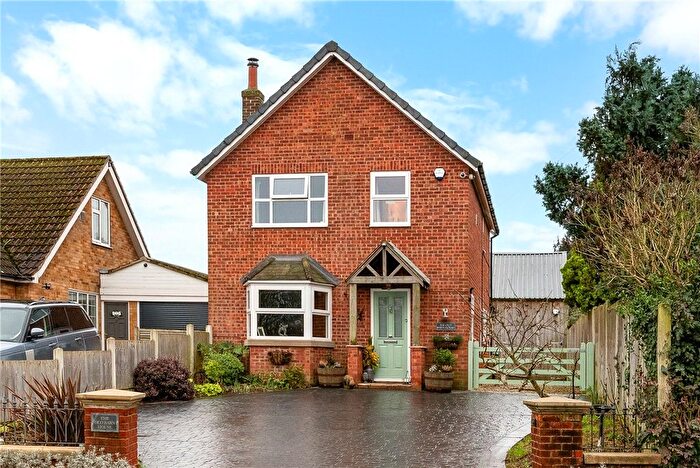
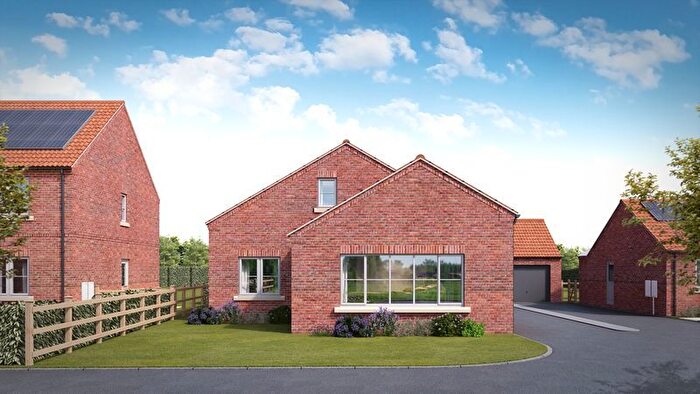
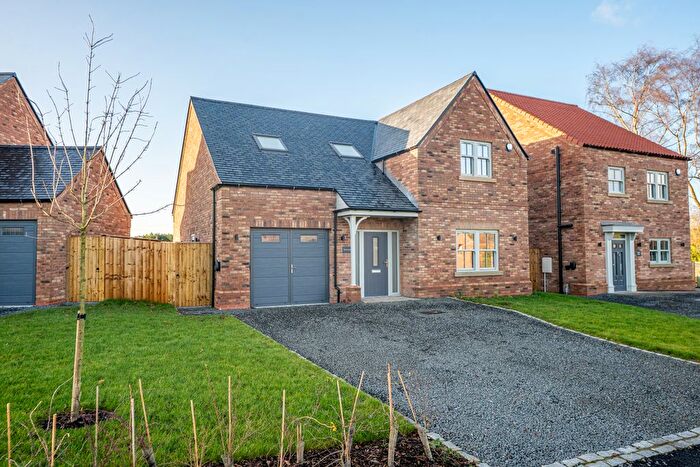
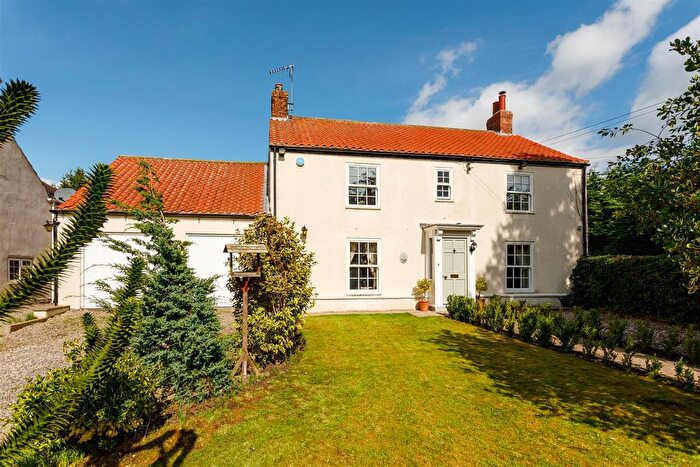
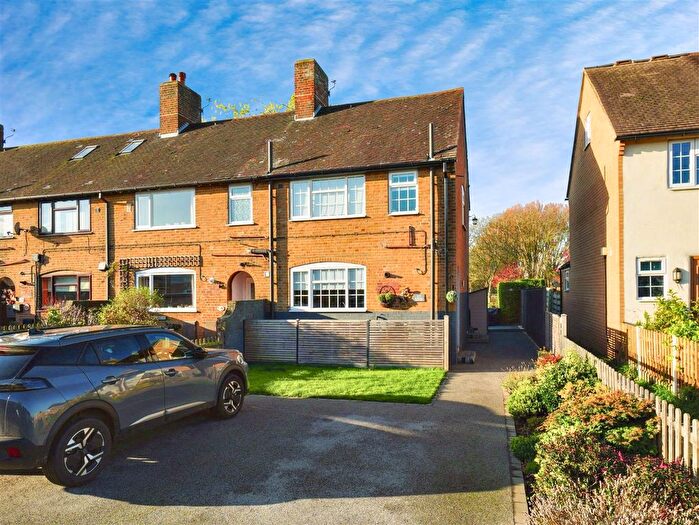
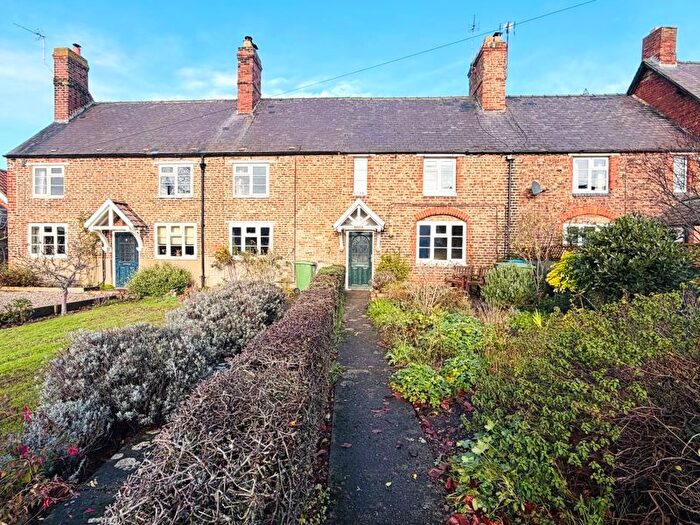
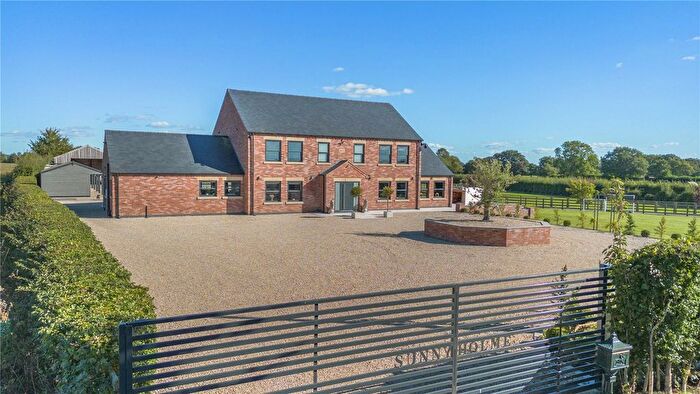
Properties in Tollerton have an average house price of £507,993.00 and had 82 Property Transactions within the last 3 years¹.
Tollerton is an area in York, North Yorkshire with 750 households², where the most expensive property was sold for £1,470,000.00.
Properties for sale in Tollerton
Previously listed properties in Tollerton
Roads and Postcodes in Tollerton
Navigate through our locations to find the location of your next house in Tollerton, York for sale or to rent.
| Streets | Postcodes |
|---|---|
| Aldwark | YO61 1TX YO61 1UB YO61 1UF |
| Alne Cross | YO61 1SD |
| Alne Road | YO61 1QA YO61 1QD |
| Back Lane | YO61 1PY YO61 1PZ YO61 1TJ |
| Braviners Row | YO61 1TA |
| Chestnut Meadows | YO61 1PT |
| Church Close | YO61 1QS |
| Cross Lanes | YO61 1RB |
| Flawith | YO61 1SF |
| Forest Lane | YO61 1TT YO61 1TW |
| Forge Cottages | YO61 1QF |
| Forge Lane | YO61 1QP |
| Gale Garth | YO61 1TQ |
| Gale Road | YO61 1TH |
| Hallgarth | YO61 1RN |
| Hambleton View | YO61 1QW |
| Hill Top Cottages | YO61 1TF |
| Home Farm Court | YO61 1TE |
| Ings View | YO61 1PR |
| Jubilee Court | YO61 1RF |
| Kyle Close | YO61 1QU |
| Main Street | YO61 1RP YO61 1RR YO61 1RS YO61 1RT YO61 1TB YO61 1TD |
| Maltings Court | YO61 1RW |
| Monk Green | YO61 1RY |
| Moorlands Lane | YO61 1QR |
| Newton Road | YO61 1QT YO61 1QX |
| Orchard Cottages | YO61 1UD |
| Pinfold Terrace | YO61 1QG |
| Sadlers Court | YO61 1RJ |
| South Back Lane | YO61 1PU |
| St Marys View | YO61 1RU |
| Station Court | YO61 1RH |
| Station Road | YO61 1RD YO61 1TP YO61 1TR YO61 1TS |
| Sykes Lane | YO61 1RE |
| Tennis Court Lane | YO61 1QE |
| The Avenue | YO61 1RZ |
| The Green | YO61 1PX |
| Thornhill Wind | YO61 1RL |
| Tillicum Cottages | YO61 1TN |
| Tollerton Road | YO61 1JE |
| Warehills Lane | YO61 1RG |
| White House Close | YO61 1QB |
| York Road | YO61 1QZ YO61 1RA YO61 3EJ YO61 3EL |
| Youlton | YO61 1QL |
| Youlton Lane | YO61 1SB |
| YO61 1PS YO61 1QQ YO61 1RX |
Transport near Tollerton
- FAQ
- Price Paid By Year
- Property Type Price
Frequently asked questions about Tollerton
What is the average price for a property for sale in Tollerton?
The average price for a property for sale in Tollerton is £507,993. This amount is 21% higher than the average price in York. There are 179 property listings for sale in Tollerton.
What streets have the most expensive properties for sale in Tollerton?
The streets with the most expensive properties for sale in Tollerton are Main Street at an average of £759,625, Chestnut Meadows at an average of £685,000 and Flawith at an average of £651,750.
What streets have the most affordable properties for sale in Tollerton?
The streets with the most affordable properties for sale in Tollerton are The Green at an average of £215,000, Hambleton View at an average of £233,998 and Kyle Close at an average of £266,500.
Which train stations are available in or near Tollerton?
Some of the train stations available in or near Tollerton are Hammerton, Cattal and Poppleton.
Property Price Paid in Tollerton by Year
The average sold property price by year was:
| Year | Average Sold Price | Price Change |
Sold Properties
|
|---|---|---|---|
| 2025 | £476,450 | -6% |
20 Properties |
| 2024 | £502,831 | -5% |
27 Properties |
| 2023 | £529,999 | -15% |
35 Properties |
| 2022 | £612,070 | 20% |
18 Properties |
| 2021 | £491,734 | 9% |
66 Properties |
| 2020 | £445,597 | 9% |
36 Properties |
| 2019 | £407,193 | 5% |
22 Properties |
| 2018 | £388,790 | 7% |
31 Properties |
| 2017 | £363,387 | 0,5% |
32 Properties |
| 2016 | £361,749 | -1% |
32 Properties |
| 2015 | £365,395 | 8% |
30 Properties |
| 2014 | £334,702 | 10% |
34 Properties |
| 2013 | £302,284 | 10% |
33 Properties |
| 2012 | £272,983 | -33% |
30 Properties |
| 2011 | £363,647 | 4% |
17 Properties |
| 2010 | £350,628 | 30% |
40 Properties |
| 2009 | £245,506 | -66% |
36 Properties |
| 2008 | £407,704 | 28% |
24 Properties |
| 2007 | £294,123 | -6% |
40 Properties |
| 2006 | £312,479 | 14% |
49 Properties |
| 2005 | £269,925 | -1% |
36 Properties |
| 2004 | £272,198 | 4% |
36 Properties |
| 2003 | £261,975 | 15% |
42 Properties |
| 2002 | £221,562 | 24% |
52 Properties |
| 2001 | £168,953 | 20% |
69 Properties |
| 2000 | £134,363 | 5% |
43 Properties |
| 1999 | £127,320 | -1% |
32 Properties |
| 1998 | £128,422 | 21% |
32 Properties |
| 1997 | £101,741 | 6% |
37 Properties |
| 1996 | £95,581 | 2% |
27 Properties |
| 1995 | £93,607 | - |
26 Properties |
Property Price per Property Type in Tollerton
Here you can find historic sold price data in order to help with your property search.
The average Property Paid Price for specific property types in the last three years are:
| Property Type | Average Sold Price | Sold Properties |
|---|---|---|
| Semi Detached House | £372,658.00 | 22 Semi Detached Houses |
| Detached House | £588,329.00 | 53 Detached Houses |
| Terraced House | £325,070.00 | 7 Terraced Houses |

