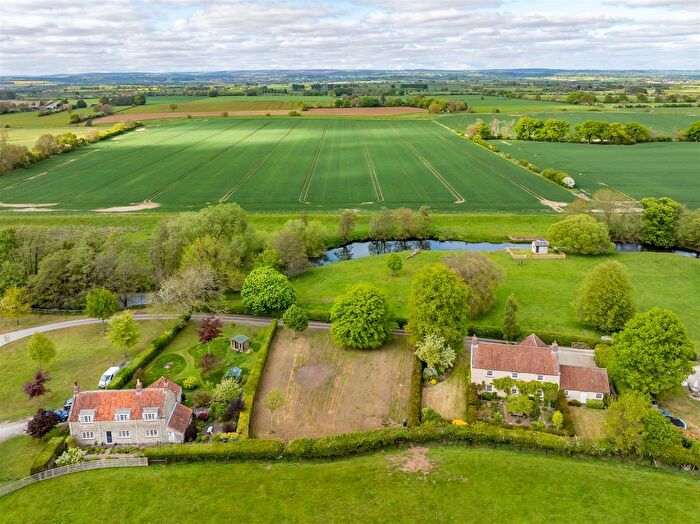
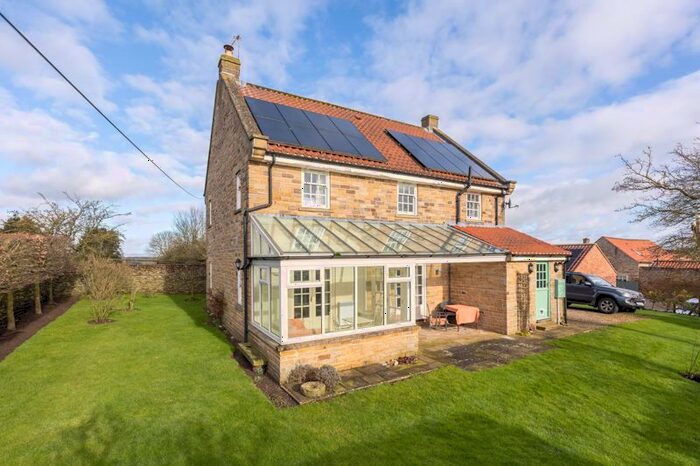
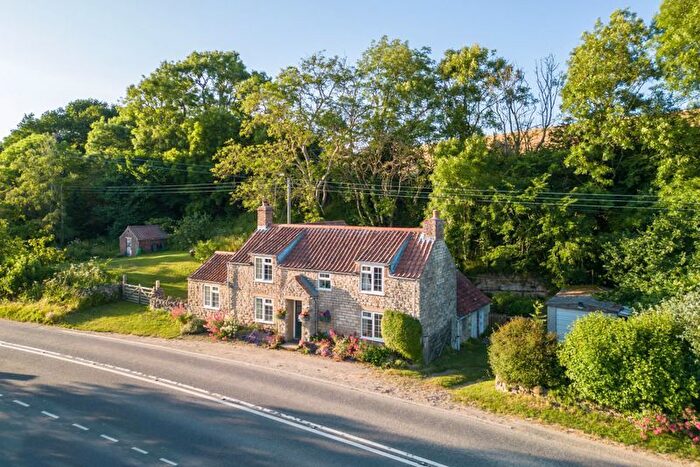
Houses for sale & to rent in Hovingham, York
House Prices in Hovingham
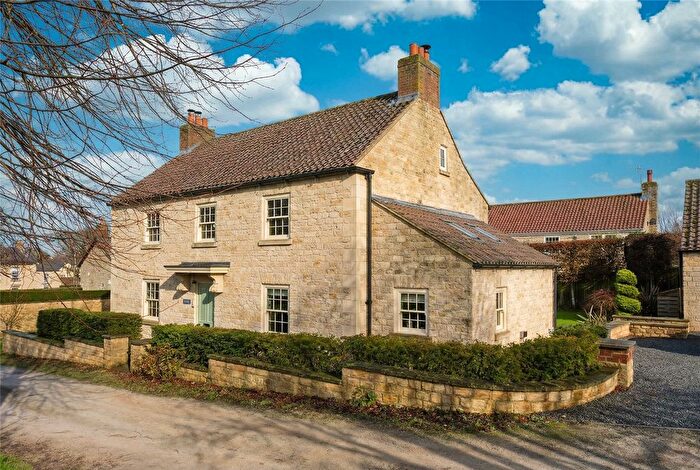
Properties in Hovingham have an average house price of £403,679.00 and had 58 Property Transactions within the last 3 years¹.
Hovingham is an area in York, North Yorkshire with 685 households², where the most expensive property was sold for £1,135,000.00.
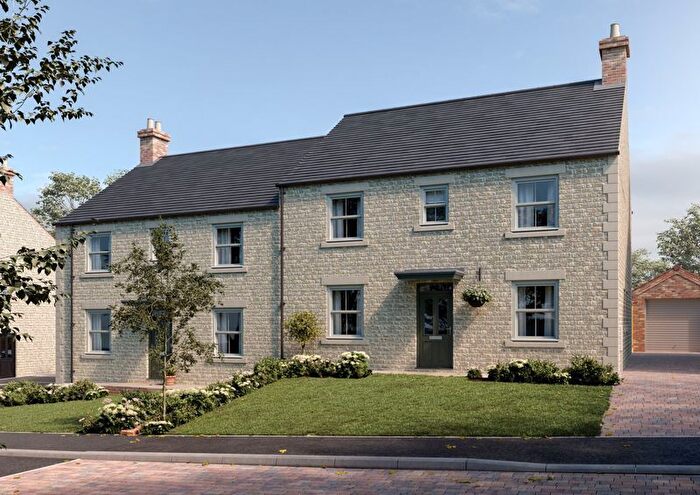
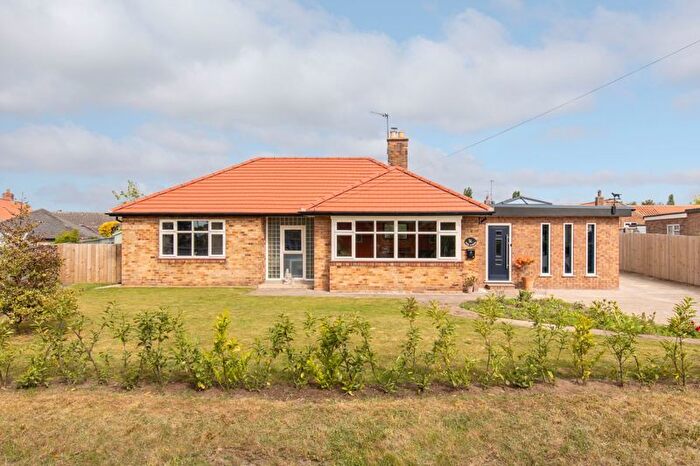
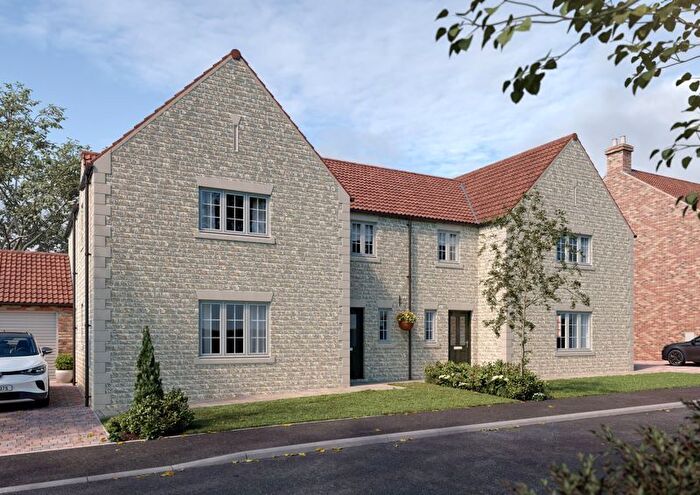
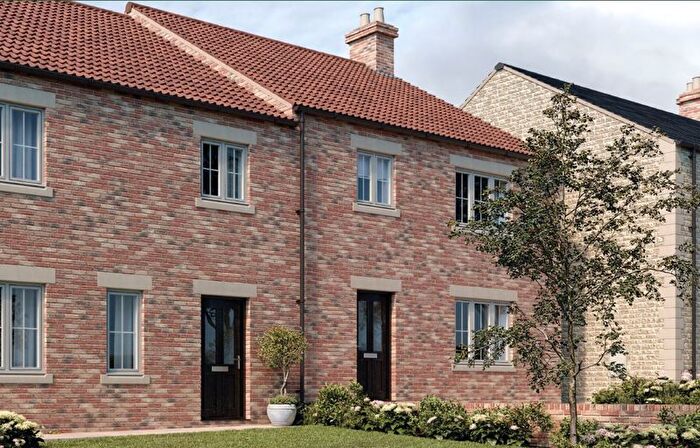
Properties for sale in Hovingham
Previously listed properties in Hovingham
Roads and Postcodes in Hovingham
Navigate through our locations to find the location of your next house in Hovingham, York for sale or to rent.
| Streets | Postcodes |
|---|---|
| Aspen Way | YO62 4AR |
| Balksyde | YO62 4AG |
| Brookside | YO62 4LG |
| Cavendish Court | YO62 4BN |
| Church Lane | YO60 6PS YO62 4AD |
| Church Street | YO62 4JY |
| Cliffe Mews | YO60 6PW |
| East View | YO62 4AJ |
| Far North Ings | YO60 6PQ |
| Flat Top Cottages | YO60 6PB |
| Flat Top Farm Road | YO60 6AB |
| Fryton | YO62 4AT |
| Green Dyke Lane | YO62 4AP YO62 4AU YO62 4BF |
| Hall Farm Cottages | YO62 4JS |
| High Street | YO62 4AE YO62 4LA |
| Little Terrington | YO60 6PA |
| Main Street | YO62 4LF |
| Malton Road | YO62 4AF YO62 4LD |
| Market Square | YO62 4JX |
| Mossburn Drive | YO62 4LY |
| Mowbray Crescent | YO62 4LE |
| Mowthorpe | YO60 6QF YO60 6QE |
| Mowthorpe Lane | YO60 6PZ |
| New Road | YO60 6NT |
| North Back Lane | YO60 6NS |
| North Carr | YO60 6PN |
| Park Street | YO62 4JZ |
| Parkside Lane | YO62 4JD |
| Pasture Lane | YO62 4JT |
| Porch Farm Close | YO62 4BQ |
| Railway Street | YO62 4AH YO62 4AL YO62 4AN YO62 4BP |
| South Back Lane | YO60 6PX YO60 6PY |
| South Crescent | YO60 6QA |
| Sycamore Close | YO62 4BG |
| The Balk | YO62 4AQ |
| The Green | YO62 4AA YO62 4JU |
| The Green Crescent | YO62 4AB |
| The Lawns | YO62 4AW |
| The Quarry | YO62 4LB |
| The Square | YO60 6PT |
| Wath Court | YO62 4NN |
| Wheatlands Court | YO62 4AZ |
| Wiganthorpe | YO60 6NU YO60 6NX |
| YO60 6PP YO60 6PU YO60 6QB YO62 4JR YO62 4LQ YO62 4LR YO60 6PD YO60 6PH YO60 6PJ YO60 6PR YO60 6QD YO62 4AS YO62 4AX YO62 4AY YO62 4LP YO62 4LS YO62 4LU YO62 4LX |
Transport near Hovingham
- FAQ
- Price Paid By Year
- Property Type Price
Frequently asked questions about Hovingham
What is the average price for a property for sale in Hovingham?
The average price for a property for sale in Hovingham is £403,679. This amount is 4% lower than the average price in York. There are 46 property listings for sale in Hovingham.
What streets have the most expensive properties for sale in Hovingham?
The streets with the most expensive properties for sale in Hovingham are South Back Lane at an average of £666,666, Pasture Lane at an average of £537,485 and Wiganthorpe at an average of £505,000.
What streets have the most affordable properties for sale in Hovingham?
The streets with the most affordable properties for sale in Hovingham are Hall Farm Cottages at an average of £88,500, Flat Top Cottages at an average of £175,000 and Aspen Way at an average of £199,250.
Which train stations are available in or near Hovingham?
Some of the train stations available in or near Hovingham are Malton, Poppleton and York.
Property Price Paid in Hovingham by Year
The average sold property price by year was:
| Year | Average Sold Price | Price Change |
Sold Properties
|
|---|---|---|---|
| 2025 | £472,500 | 30% |
12 Properties |
| 2024 | £332,825 | -28% |
20 Properties |
| 2023 | £426,419 | -2% |
26 Properties |
| 2022 | £436,784 | -3% |
13 Properties |
| 2021 | £450,930 | 19% |
23 Properties |
| 2020 | £366,564 | 17% |
24 Properties |
| 2019 | £302,990 | -22% |
20 Properties |
| 2018 | £368,794 | 6% |
27 Properties |
| 2017 | £345,773 | 6% |
43 Properties |
| 2016 | £325,679 | 7% |
27 Properties |
| 2015 | £302,704 | 5% |
26 Properties |
| 2014 | £287,290 | -5% |
36 Properties |
| 2013 | £301,825 | 1% |
20 Properties |
| 2012 | £299,866 | 6% |
17 Properties |
| 2011 | £281,326 | -6% |
15 Properties |
| 2010 | £297,533 | -23% |
15 Properties |
| 2009 | £365,250 | -3% |
13 Properties |
| 2008 | £376,656 | 27% |
16 Properties |
| 2007 | £274,342 | -11% |
13 Properties |
| 2006 | £304,998 | -3% |
28 Properties |
| 2005 | £315,416 | 23% |
18 Properties |
| 2004 | £242,846 | 1% |
26 Properties |
| 2003 | £239,530 | 45% |
27 Properties |
| 2002 | £130,658 | 2% |
30 Properties |
| 2001 | £128,418 | 18% |
16 Properties |
| 2000 | £105,939 | 21% |
19 Properties |
| 1999 | £83,963 | 1% |
40 Properties |
| 1998 | £83,404 | 7% |
21 Properties |
| 1997 | £77,586 | -34% |
33 Properties |
| 1996 | £104,175 | 6% |
34 Properties |
| 1995 | £97,972 | - |
11 Properties |
Property Price per Property Type in Hovingham
Here you can find historic sold price data in order to help with your property search.
The average Property Paid Price for specific property types in the last three years are:
| Property Type | Average Sold Price | Sold Properties |
|---|---|---|
| Semi Detached House | £324,380.00 | 21 Semi Detached Houses |
| Detached House | £498,854.00 | 24 Detached Houses |
| Terraced House | £366,701.00 | 12 Terraced Houses |
| Flat | £228,500.00 | 1 Flat |

