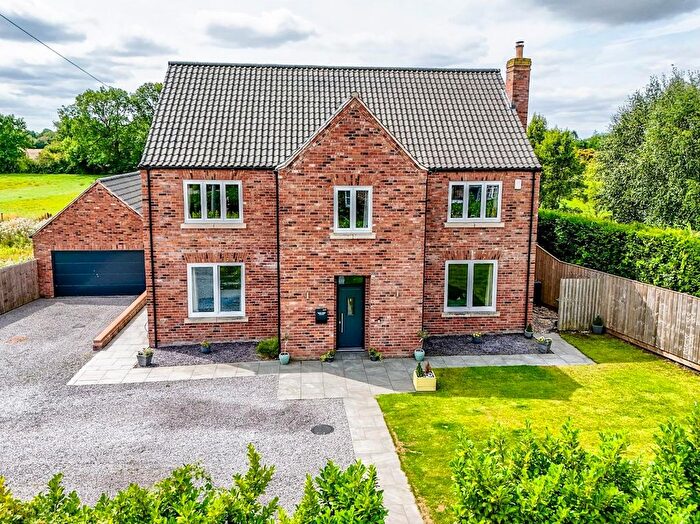
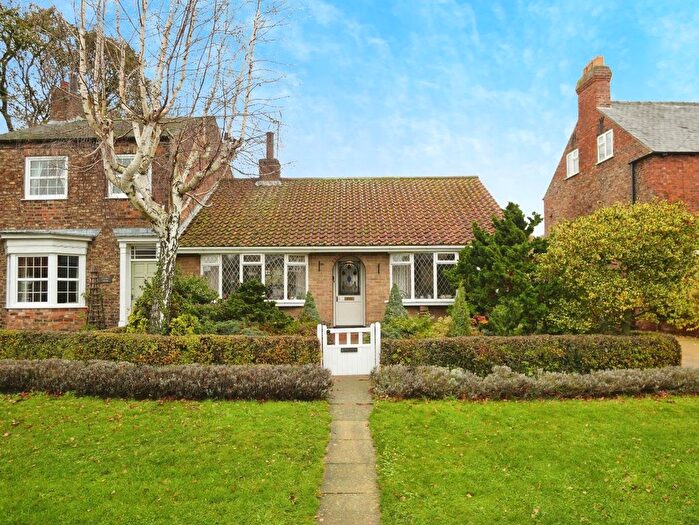
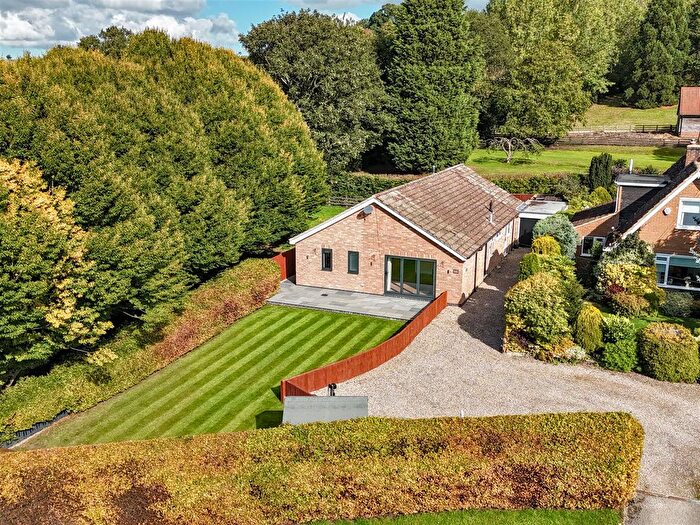
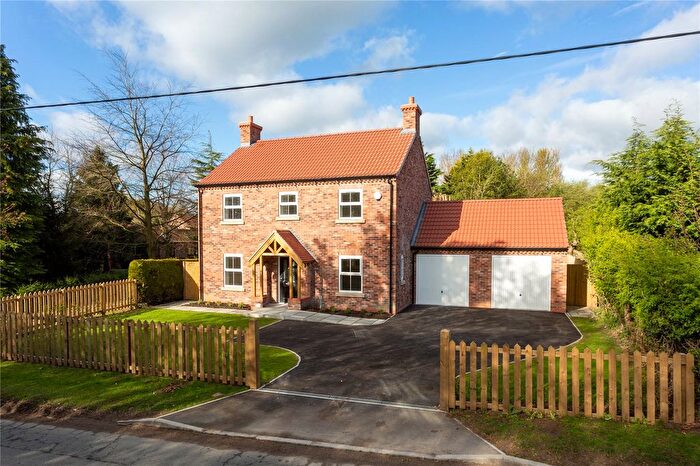
Houses for sale & to rent in Huby And Sutton, York
House Prices in Huby And Sutton
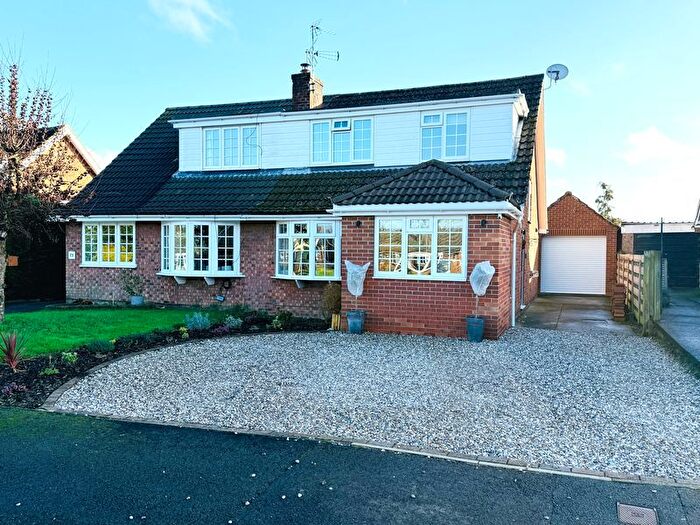
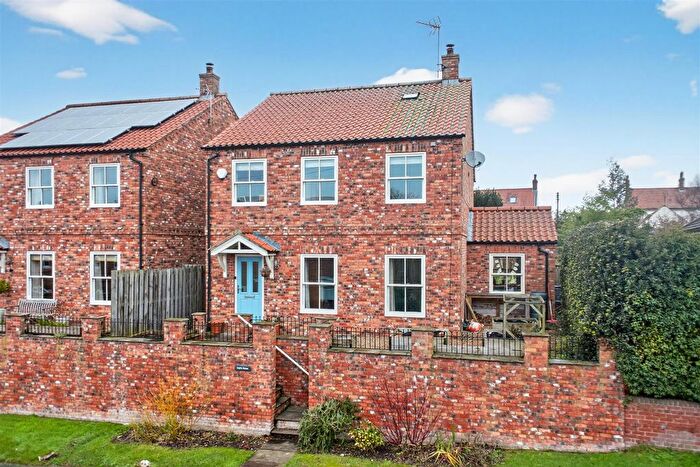
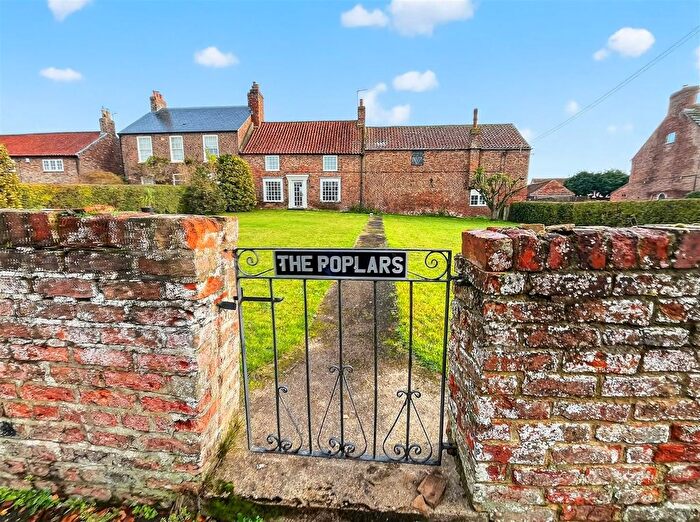
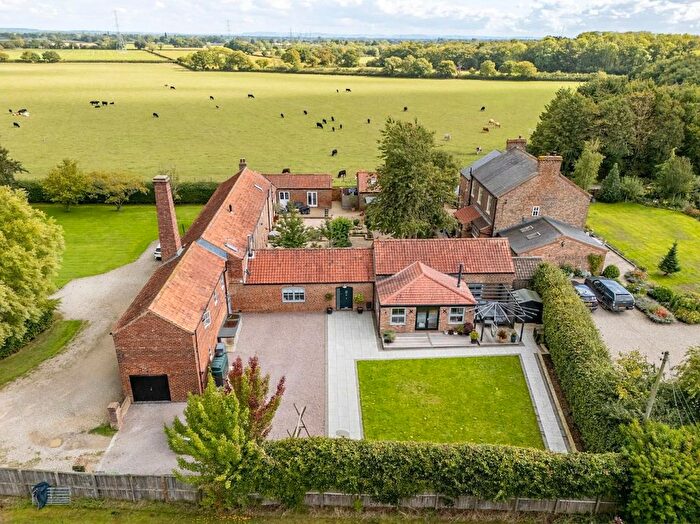
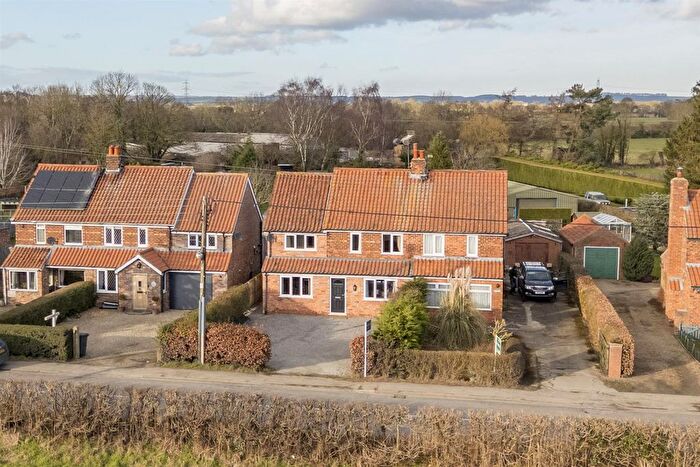
Properties in Huby And Sutton have an average house price of £468,081.00 and had 64 Property Transactions within the last 3 years¹.
Huby And Sutton is an area in York, North Yorkshire with 680 households², where the most expensive property was sold for £950,000.00.
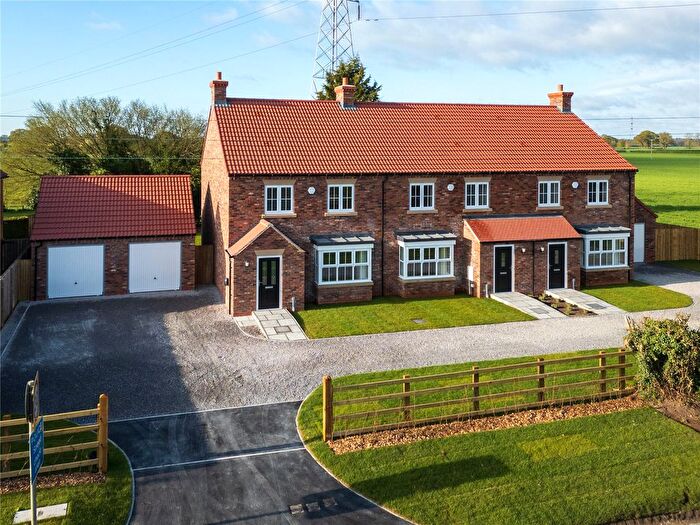
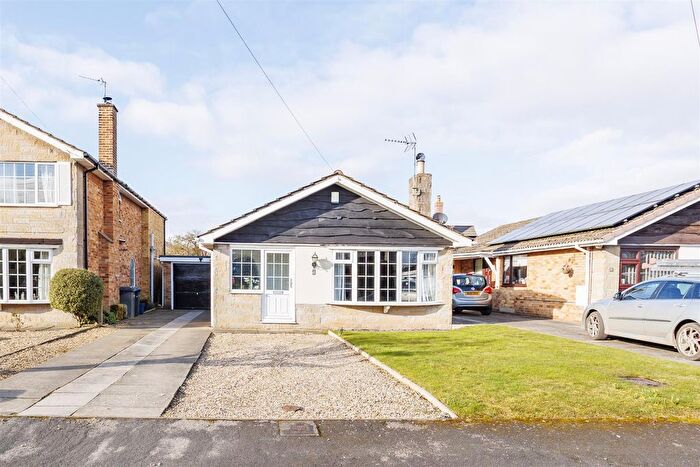
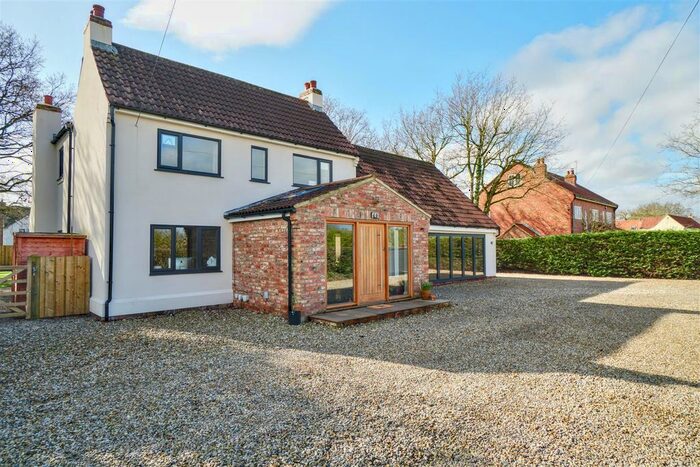
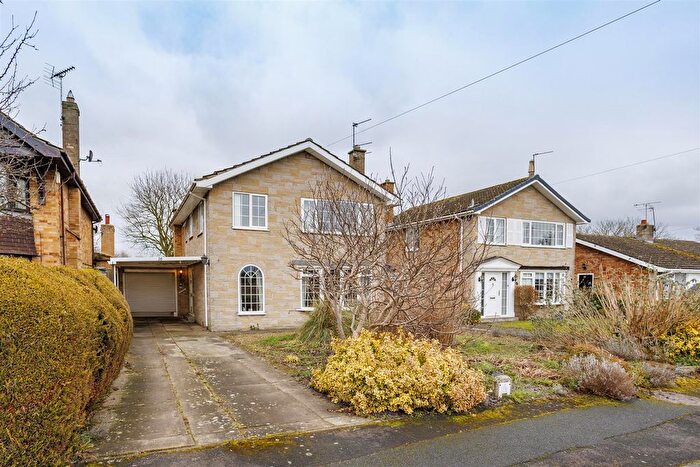
Properties for sale in Huby And Sutton
Previously listed properties in Huby And Sutton
Roads and Postcodes in Huby And Sutton
Navigate through our locations to find the location of your next house in Huby And Sutton, York for sale or to rent.
| Streets | Postcodes |
|---|---|
| Bell Lane | YO61 1YA |
| Carr Lane | YO61 1EB |
| Chapel Court | YO61 1YF |
| Coombes Close | YO61 1DX |
| Easingwold Road | YO61 1HJ YO61 1HN |
| Gracious Street | YO61 1HR |
| Grey Close | YO61 1DQ |
| Harland Close | YO61 1DH |
| Horner Avenue | YO61 1YD |
| Horner Close | YO61 1YE |
| Huby Road | YO61 1DT YO61 1DY |
| Inhams Fold | YO61 1DE |
| Jacobs Court | YO61 1EW |
| Main Street | YO61 1DN YO61 1DP YO61 1DW YO61 1HQ YO61 1HS |
| Maple Croft | YO61 1JQ |
| Maple Lane | YO61 1JG |
| May Cottages | YO61 1HL |
| Newton Farm Court | YO61 1EZ |
| Paddock Close | YO61 1YG |
| Robin Lane | YO61 1HH |
| Shaw Crescent | YO61 1JF |
| Skates Lane | YO61 1HB |
| South View | YO61 1DU |
| Sterne Way | YO61 1DG |
| Stillington Road | YO61 1EH YO61 1EJ YO61 1EQ YO61 1HW |
| Sutton Road | YO61 1HD YO61 1HF |
| Tally Hill | YO61 1HP |
| The Gowans | YO61 1DJ YO61 1DL |
| The Green | YO61 1DR |
| Tollerton Road | YO61 1HT YO61 1HU YO61 1HX YO61 1JA |
| Walton Close | YO61 1HA |
| Well Lane | YO61 1ED YO61 1EF |
| West End | YO61 1DS |
| West Villas | YO61 1YB |
| York Road | YO61 1DZ YO61 1EN |
| YO30 1BD YO61 1LY |
Transport near Huby And Sutton
- FAQ
- Price Paid By Year
- Property Type Price
Frequently asked questions about Huby And Sutton
What is the average price for a property for sale in Huby And Sutton?
The average price for a property for sale in Huby And Sutton is £468,081. This amount is 11% higher than the average price in York. There are 121 property listings for sale in Huby And Sutton.
What streets have the most expensive properties for sale in Huby And Sutton?
The streets with the most expensive properties for sale in Huby And Sutton are Sutton Road at an average of £750,000, The Gowans at an average of £698,000 and Gracious Street at an average of £622,125.
What streets have the most affordable properties for sale in Huby And Sutton?
The streets with the most affordable properties for sale in Huby And Sutton are The Green at an average of £250,000, Horner Avenue at an average of £254,987 and Chapel Court at an average of £260,000.
Which train stations are available in or near Huby And Sutton?
Some of the train stations available in or near Huby And Sutton are Poppleton, York and Hammerton.
Property Price Paid in Huby And Sutton by Year
The average sold property price by year was:
| Year | Average Sold Price | Price Change |
Sold Properties
|
|---|---|---|---|
| 2025 | £459,022 | 4% |
20 Properties |
| 2024 | £441,372 | -19% |
28 Properties |
| 2023 | £526,143 | 1% |
16 Properties |
| 2022 | £520,458 | 14% |
23 Properties |
| 2021 | £445,187 | 10% |
44 Properties |
| 2020 | £402,631 | 14% |
30 Properties |
| 2019 | £344,465 | -5% |
40 Properties |
| 2018 | £362,916 | -13% |
24 Properties |
| 2017 | £410,805 | 23% |
36 Properties |
| 2016 | £318,108 | 13% |
26 Properties |
| 2015 | £277,173 | -5% |
23 Properties |
| 2014 | £290,280 | 14% |
34 Properties |
| 2013 | £249,798 | -9% |
30 Properties |
| 2012 | £272,523 | -11% |
19 Properties |
| 2011 | £301,158 | 2% |
25 Properties |
| 2010 | £295,406 | 1% |
22 Properties |
| 2009 | £292,284 | 7% |
19 Properties |
| 2008 | £270,616 | -9% |
21 Properties |
| 2007 | £295,142 | 12% |
39 Properties |
| 2006 | £260,639 | -10% |
38 Properties |
| 2005 | £287,694 | 19% |
36 Properties |
| 2004 | £233,720 | 20% |
35 Properties |
| 2003 | £187,650 | 15% |
30 Properties |
| 2002 | £159,446 | -0,2% |
33 Properties |
| 2001 | £159,759 | 15% |
44 Properties |
| 2000 | £135,425 | 22% |
31 Properties |
| 1999 | £105,207 | -17% |
44 Properties |
| 1998 | £122,670 | 16% |
25 Properties |
| 1997 | £103,226 | -2% |
41 Properties |
| 1996 | £104,963 | 30% |
45 Properties |
| 1995 | £73,608 | - |
29 Properties |
Property Price per Property Type in Huby And Sutton
Here you can find historic sold price data in order to help with your property search.
The average Property Paid Price for specific property types in the last three years are:
| Property Type | Average Sold Price | Sold Properties |
|---|---|---|
| Semi Detached House | £292,683.00 | 16 Semi Detached Houses |
| Detached House | £559,604.00 | 41 Detached Houses |
| Terraced House | £332,921.00 | 7 Terraced Houses |

