
Houses for sale & to rent in Oakley North, Corby
House Prices in Oakley North
Properties in Oakley North have an average house price of £286k and had 26 Property Transactions within the last 3 years¹.
Oakley North is an area in Corby, Northamptonshire with 166 households², where the most expensive property was sold for £390k.
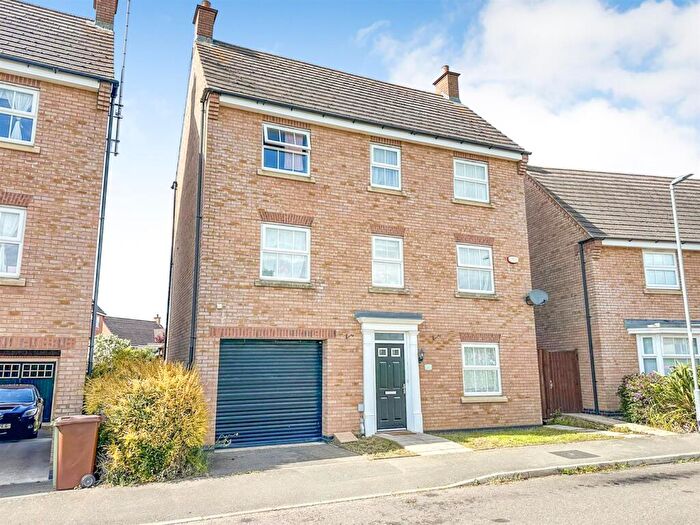
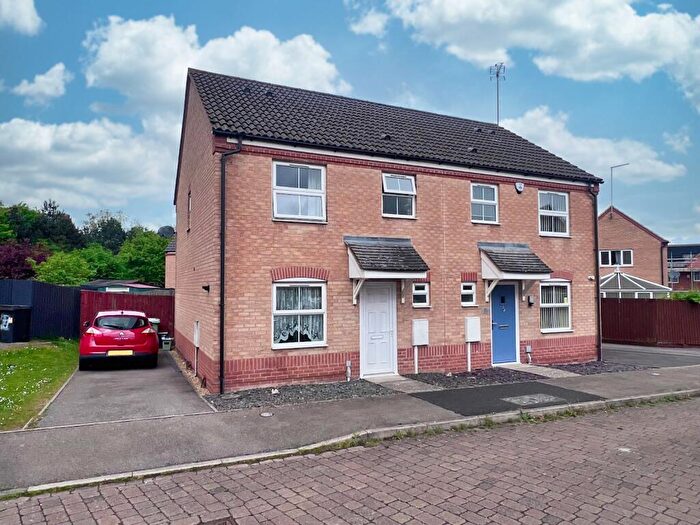
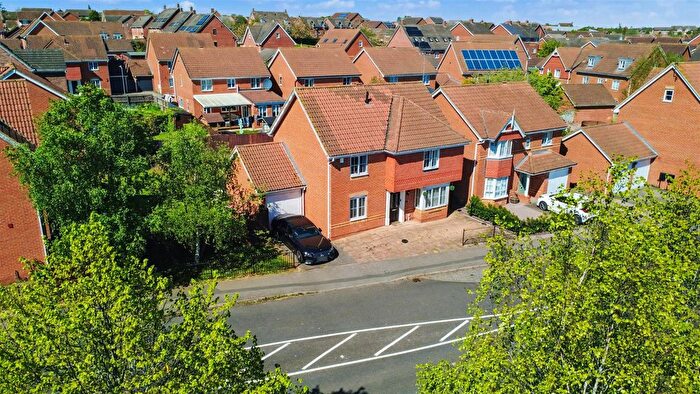
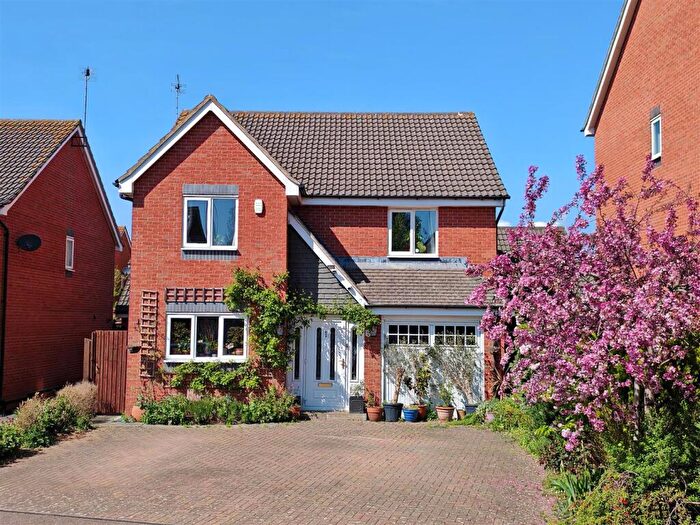
Properties for sale in Oakley North
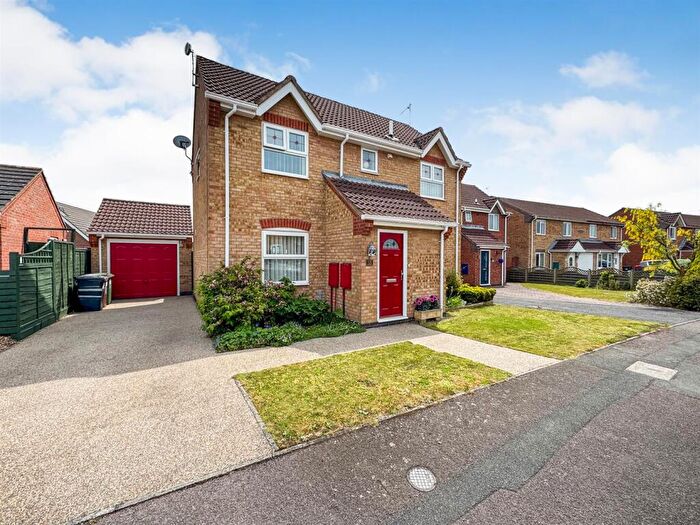
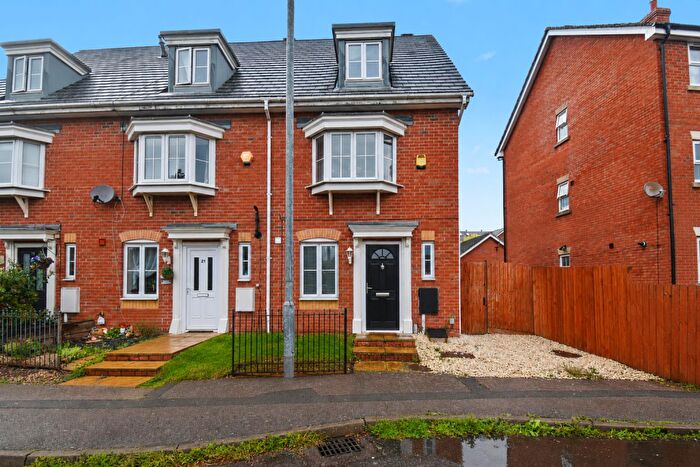
![]()
If you are looking to sell your house, let it out, or receive a property valuation, an expert can help you.
Click the button below to get started.


Roads and Postcodes in Oakley North
Navigate through our locations to find the location of your next house in Oakley North, Corby for sale or to rent.
| Streets | Postcodes |
|---|---|
| Bruce Drive | NN18 8TL |
| Burton Close | NN18 8TU |
| Charter Court | NN18 8QT |
| Douglas Road | NN18 8TQ |
| Dumble Close | NN18 8LN NN18 8LP |
| Forbes Drive | NN18 8SR |
| Livingstone Road | NN18 8TR |
| Rydal Close | NN18 8TY |
| Shackleton Close | NN18 8SU |
| Snatchill Close | NN18 8SY |
| Speke Close | NN18 8TZ |
| Wick Close | NN18 8DF |
Transport near Oakley North

- FAQ
- Price Paid By Year
- Property Type Price
Frequently asked questions about Oakley North
What is the average price for a property for sale in Oakley North?
The average price for a property for sale in Oakley North is £285,949. This amount is 20% higher than the average price in Corby. There are 592 property listings for sale in Oakley North.
What streets have the most expensive properties for sale in Oakley North?
The streets with the most expensive properties for sale in Oakley North are Forbes Drive at an average of £378,000, Bruce Drive at an average of £313,665 and Rydal Close at an average of £289,437.
What streets have the most affordable properties for sale in Oakley North?
The streets with the most affordable properties for sale in Oakley North are Livingstone Road at an average of £182,950, Shackleton Close at an average of £252,700 and Speke Close at an average of £277,750.
Which train stations are available in or near Oakley North?
Some of the train stations available in or near Oakley North are Corby, Kettering and Market Harborough.
Property Price Paid in Oakley North by Year
The average sold property price by year was:
| Year | Average Sold Price | Price Change |
Sold Properties
|
|---|---|---|---|
| 2026 | £390,000 | 25% |
1 Property |
| 2025 | £292,687 | 16% |
12 Properties |
| 2024 | £245,408 | -20% |
6 Properties |
| 2023 | £294,285 | -13% |
7 Properties |
| 2022 | £331,397 | 6% |
25 Properties |
| 2021 | £312,742 | 14% |
61 Properties |
| 2020 | £267,787 | 7% |
37 Properties |
| 2019 | £250,249 | 1% |
46 Properties |
| 2018 | £247,516 | 22% |
25 Properties |
| 2017 | £193,589 | -2% |
9 Properties |
| 2016 | £197,000 | 7% |
2 Properties |
| 2015 | £183,738 | -23% |
35 Properties |
| 2014 | £226,411 | - |
6 Properties |
Property Price per Property Type in Oakley North
Here you can find historic sold price data in order to help with your property search.
The average Property Paid Price for specific property types in the last three years are:
| Property Type | Average Sold Price | Sold Properties |
|---|---|---|
| Semi Detached House | £240,125.00 | 6 Semi Detached Houses |
| Terraced House | £242,500.00 | 2 Terraced Houses |
| Detached House | £313,293.00 | 17 Detached Houses |
| Flat | £182,950.00 | 1 Flat |