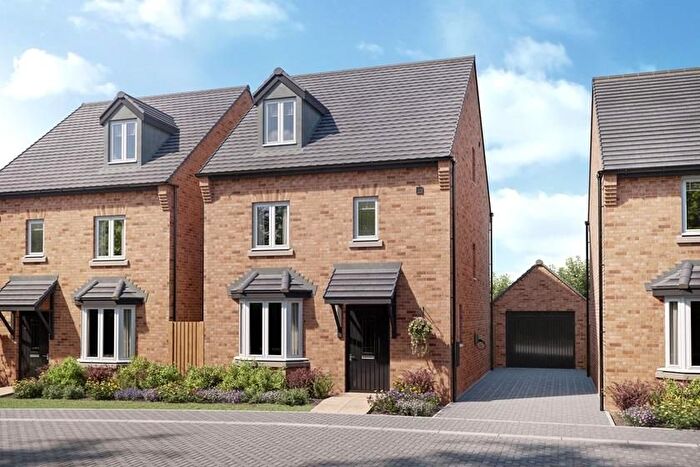
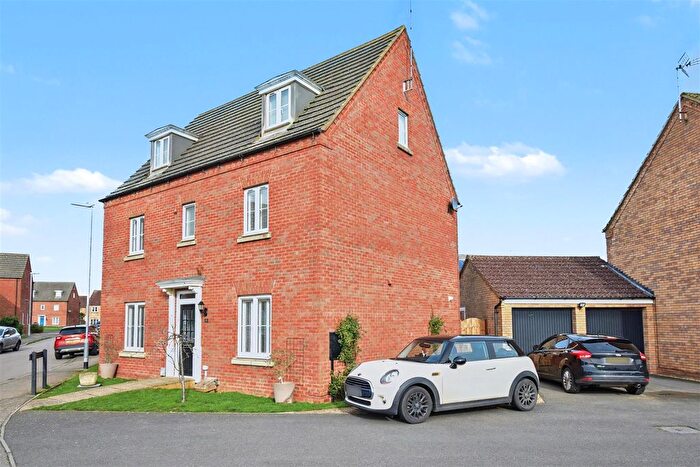
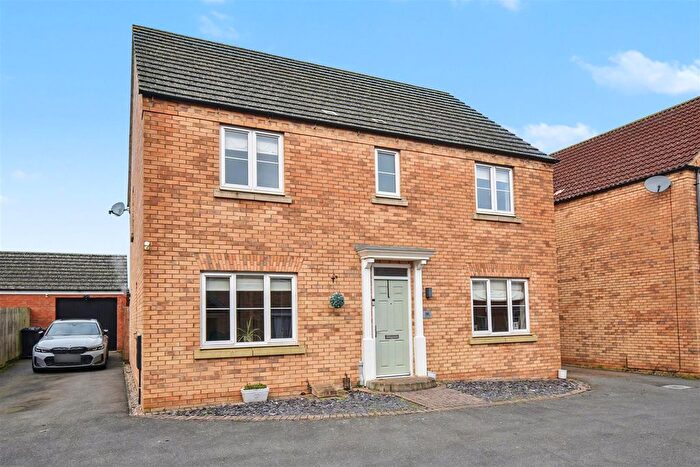
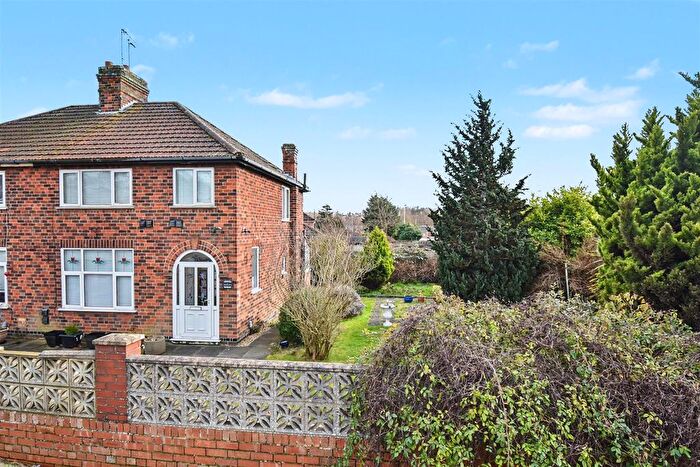
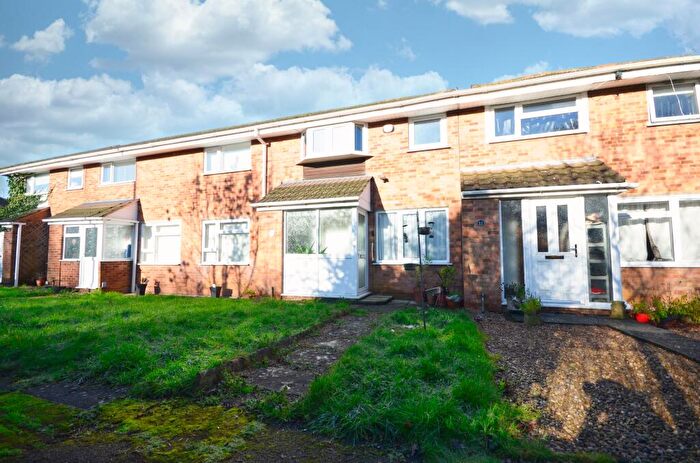
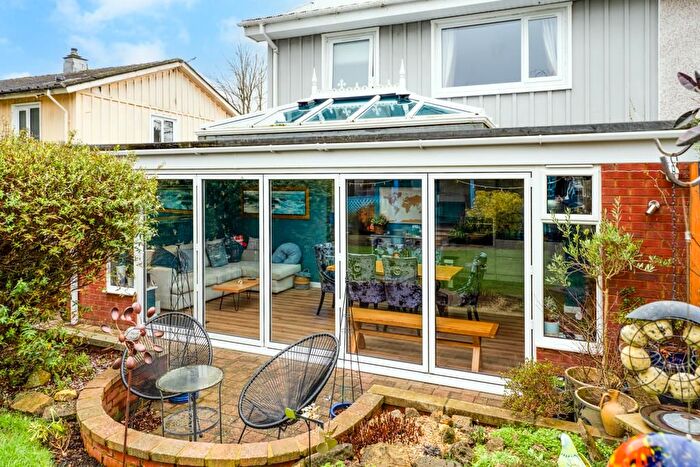
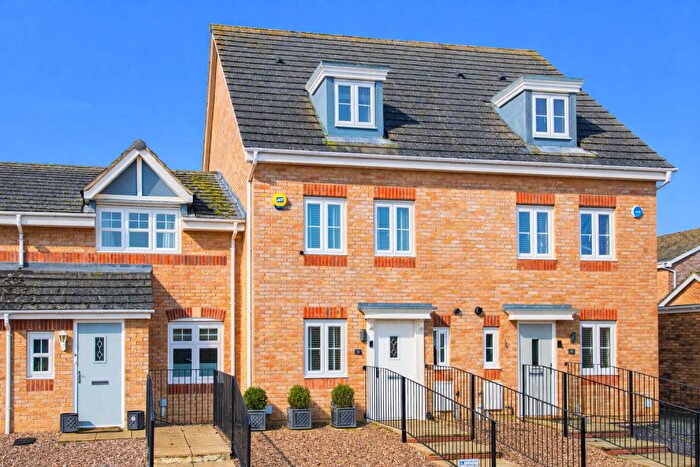
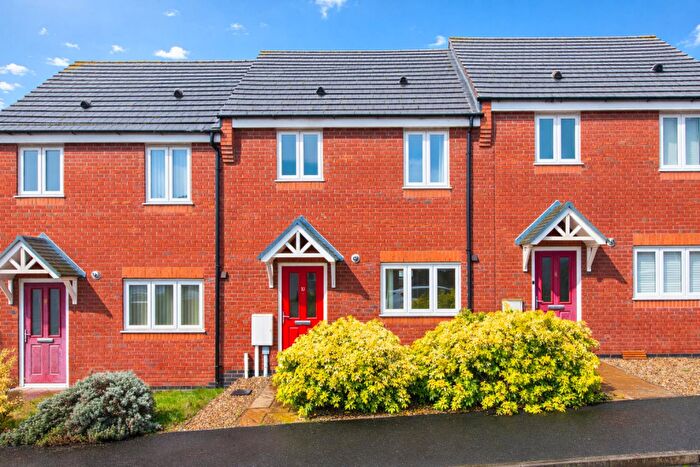
Houses for sale & to rent in Corby, Northamptonshire
House Prices in Corby
Properties in Corby have an average house price of £238,173.00 and had 2,572 Property Transactions within the last 3 years.¹
Corby is an area in Northamptonshire with 24,441 households², where the most expensive property was sold for £1,500,000.00.
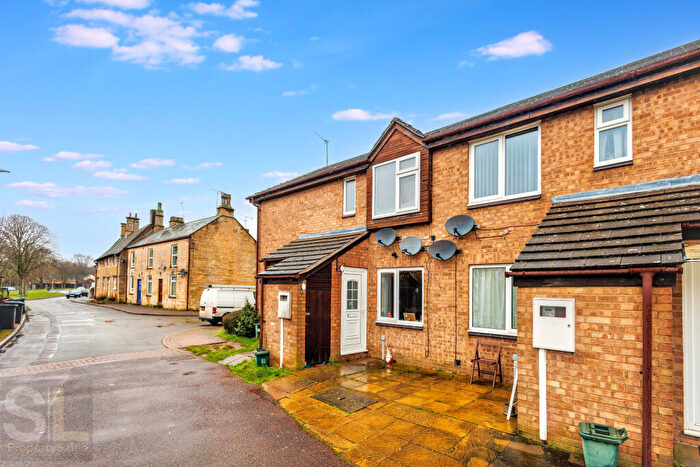
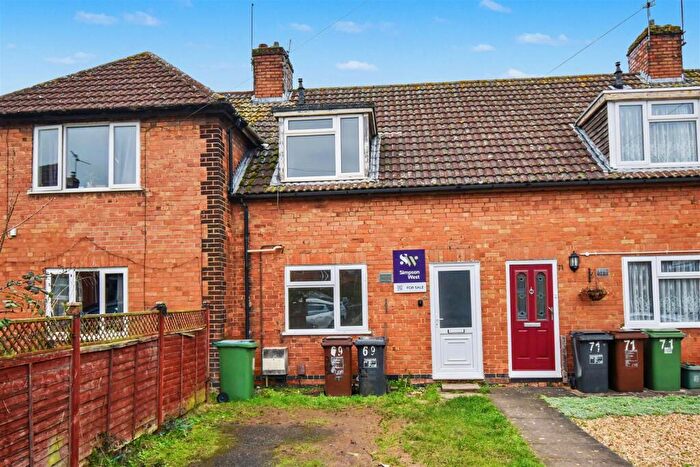
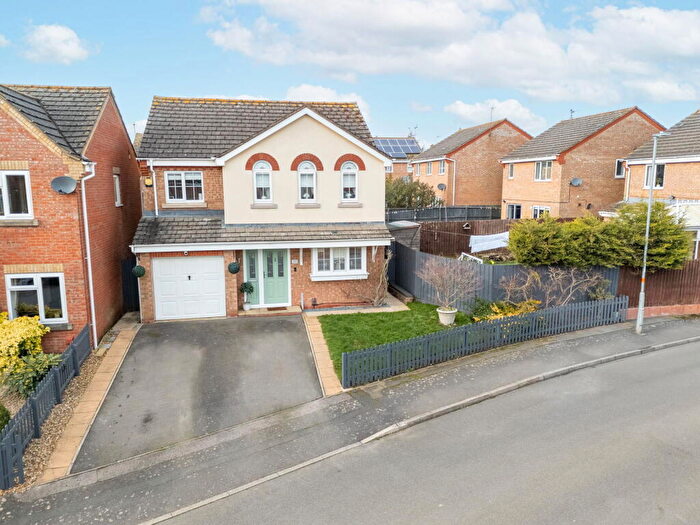
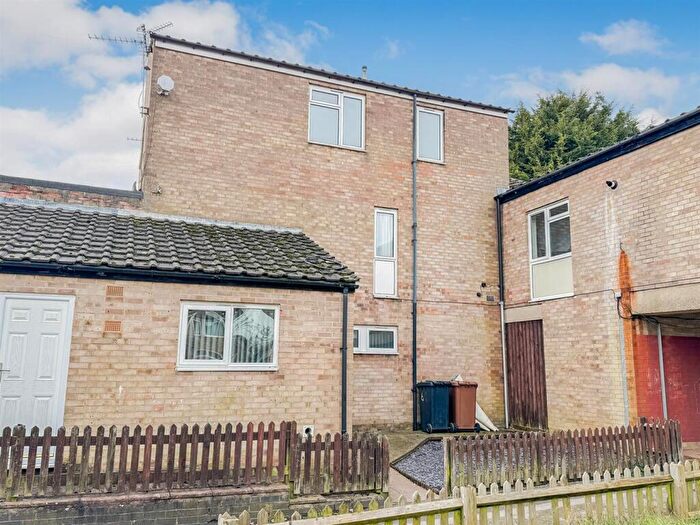
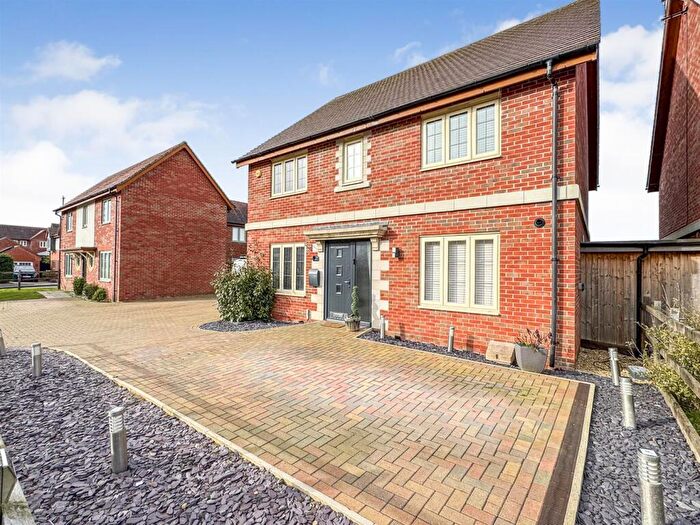
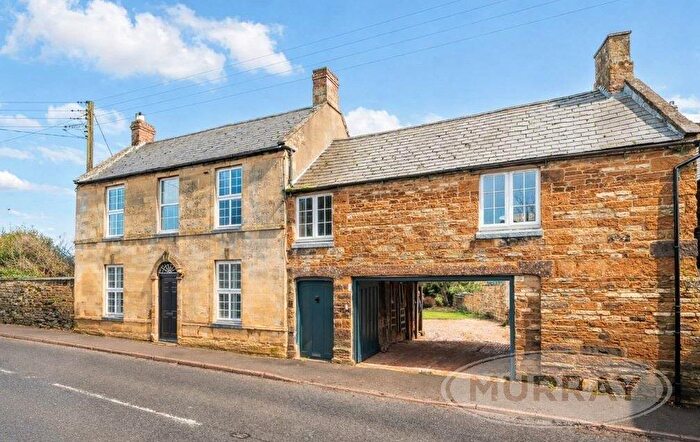
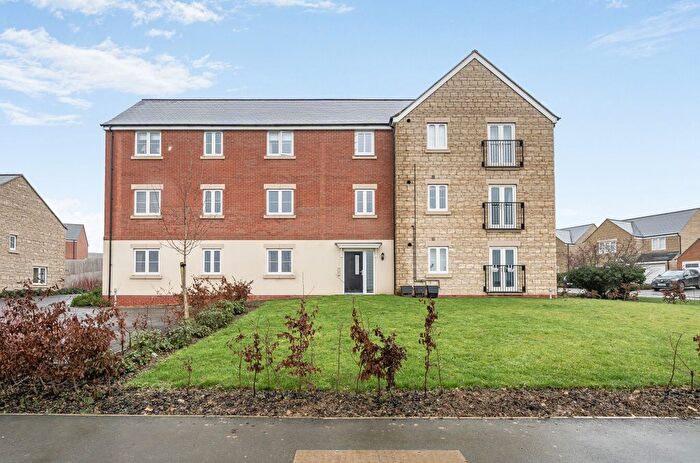
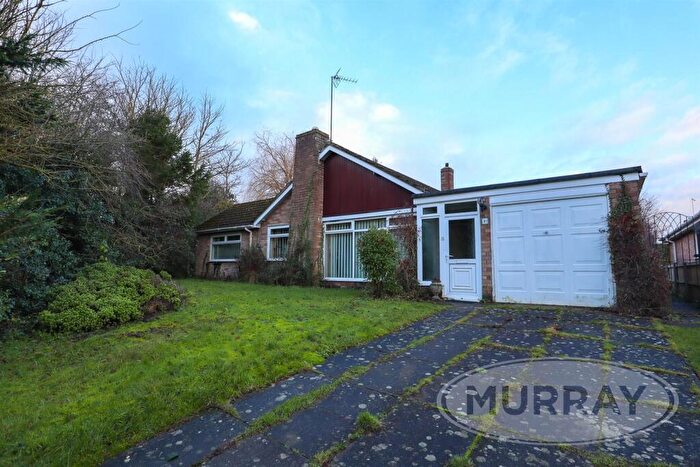
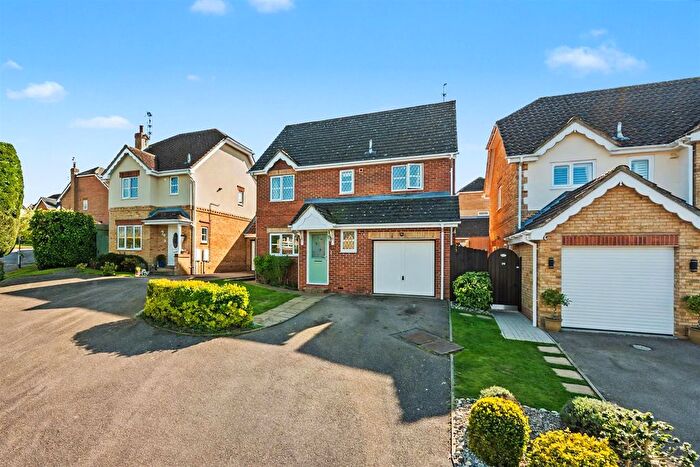
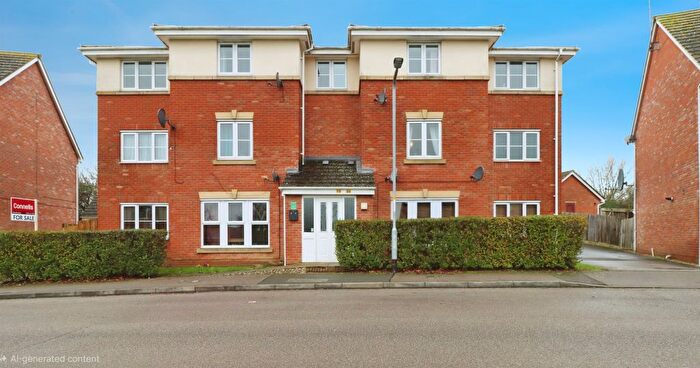
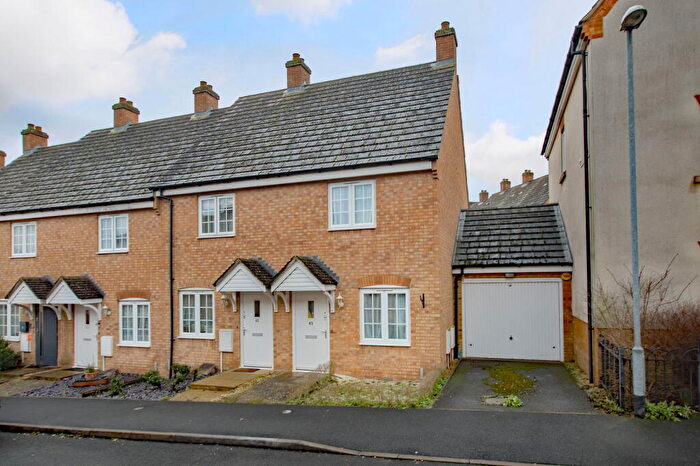
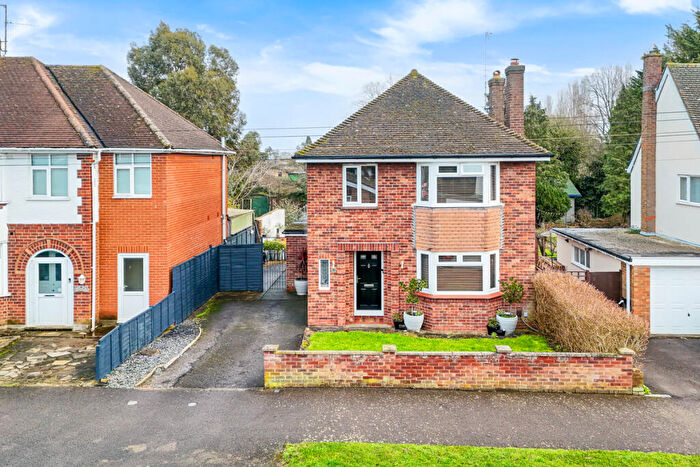
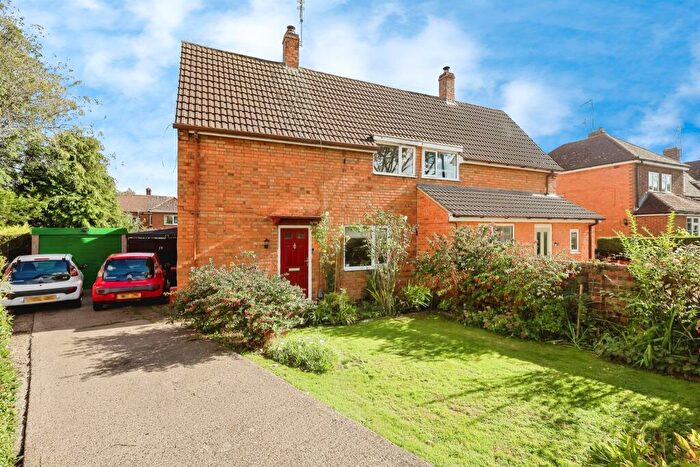
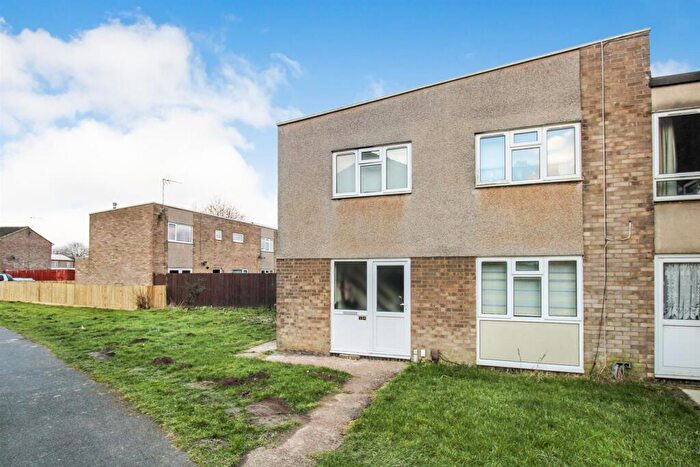
Properties for sale in Corby
Neighbourhoods in Corby
Navigate through our locations to find the location of your next house in Corby, Northamptonshire for sale or to rent.
- Beanfield
- Central
- Danesholme
- East
- Exeter
- Fineshade
- Great Oakley
- Kings Forest
- Kingswood
- Lodge Park
- Oakley Vale
- Queen Eleanor And Buccleuch
- Rowlett
- Shire Lodge
- Stanion And Corby Village
- Tower Hill
- Weldon And Gretton
- Stanion & Corby Village
- Lloyds
- Weldon & Gretton
- Kingswood & Hazel Leys
- Oakley North
- Oakley South
- Corby Rural
- Oundle
- Oakley
Transport in Corby
Please see below transportation links in this area:
- FAQ
- Price Paid By Year
- Property Type Price
Frequently asked questions about Corby
What is the average price for a property for sale in Corby?
The average price for a property for sale in Corby is £238,173. This amount is 18% lower than the average price in Northamptonshire. There are more than 10,000 property listings for sale in Corby.
What locations have the most expensive properties for sale in Corby?
The locations with the most expensive properties for sale in Corby are Fineshade at an average of £818,355, Kings Forest at an average of £566,666 and Oakley South at an average of £322,312.
What locations have the most affordable properties for sale in Corby?
The locations with the most affordable properties for sale in Corby are Kingswood at an average of £183,748, Beanfield at an average of £187,310 and Exeter at an average of £191,113.
Which train stations are available in or near Corby?
Some of the train stations available in or near Corby are Corby, Kettering and Market Harborough.
Property Price Paid in Corby by Year
The average sold property price by year was:
| Year | Average Sold Price | Price Change |
Sold Properties
|
|---|---|---|---|
| 2025 | £233,424 | -2% |
749 Properties |
| 2024 | £237,745 | -2% |
967 Properties |
| 2023 | £242,812 | -0,3% |
856 Properties |
| 2022 | £243,622 | 6% |
1,244 Properties |
| 2021 | £228,152 | 3% |
1,432 Properties |
| 2020 | £220,178 | 8% |
1,075 Properties |
| 2019 | £201,543 | 2% |
1,404 Properties |
| 2018 | £198,407 | 1% |
1,645 Properties |
| 2017 | £196,861 | 16% |
1,577 Properties |
| 2016 | £165,984 | 5% |
1,422 Properties |
| 2015 | £157,737 | 10% |
1,307 Properties |
| 2014 | £141,604 | 0,4% |
1,261 Properties |
| 2013 | £141,059 | 1% |
897 Properties |
| 2012 | £139,083 | 6% |
831 Properties |
| 2011 | £130,823 | 0,5% |
812 Properties |
| 2010 | £130,198 | 2% |
764 Properties |
| 2009 | £128,239 | -11% |
658 Properties |
| 2008 | £142,560 | -1% |
995 Properties |
| 2007 | £144,129 | 10% |
1,780 Properties |
| 2006 | £128,996 | 7% |
1,732 Properties |
| 2005 | £120,355 | 9% |
1,257 Properties |
| 2004 | £110,057 | 17% |
1,393 Properties |
| 2003 | £91,216 | 19% |
1,464 Properties |
| 2002 | £73,647 | 18% |
1,300 Properties |
| 2001 | £60,230 | 5% |
1,008 Properties |
| 2000 | £56,983 | 3% |
895 Properties |
| 1999 | £55,156 | 5% |
920 Properties |
| 1998 | £52,507 | 10% |
783 Properties |
| 1997 | £47,224 | 11% |
823 Properties |
| 1996 | £42,050 | 2% |
718 Properties |
| 1995 | £41,371 | - |
571 Properties |
Property Price per Property Type in Corby
Here you can find historic sold price data in order to help with your property search.
The average Property Paid Price for specific property types in the last three years are:
| Property Type | Average Sold Price | Sold Properties |
|---|---|---|
| Semi Detached House | £221,333.00 | 936 Semi Detached Houses |
| Terraced House | £195,104.00 | 827 Terraced Houses |
| Detached House | £348,595.00 | 627 Detached Houses |
| Flat | £140,073.00 | 182 Flats |

