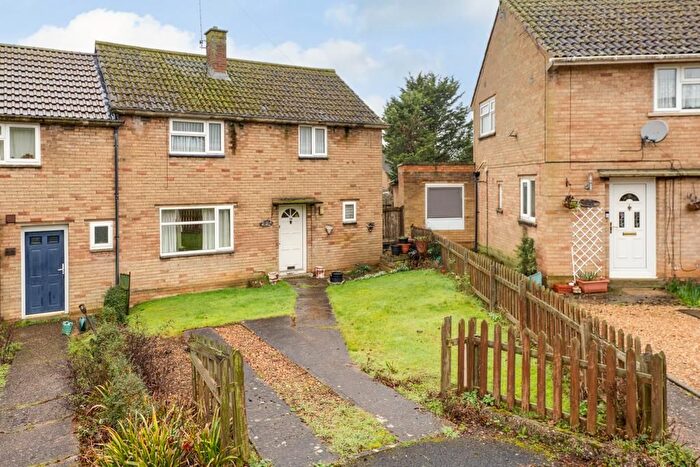
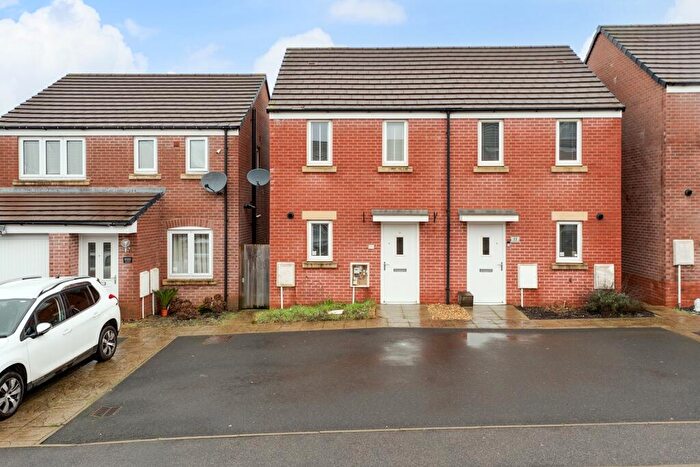
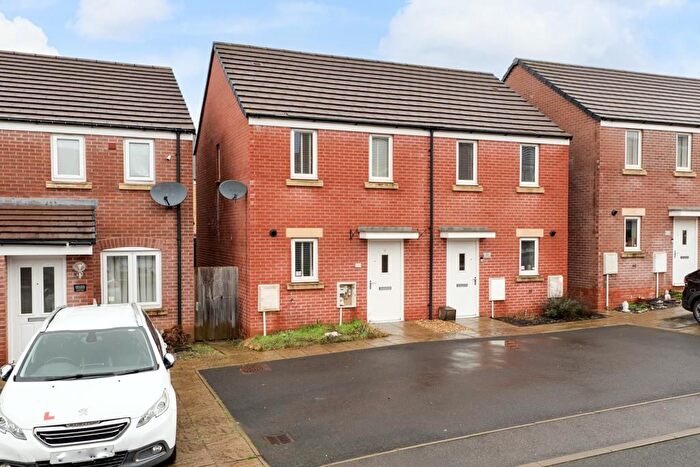
Houses for sale & to rent in Lyveden, Kettering
House Prices in Lyveden
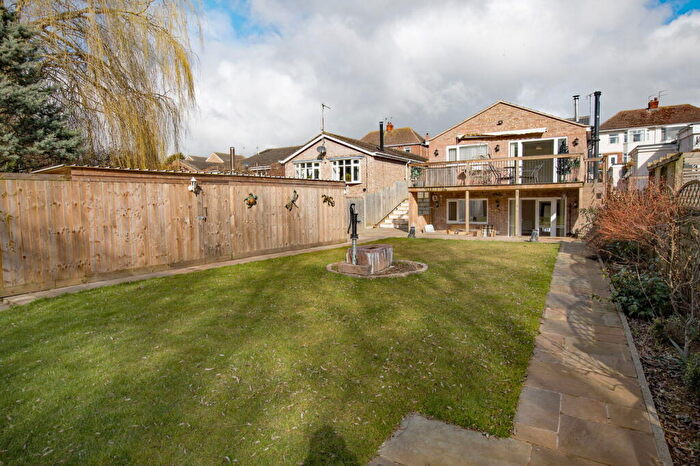
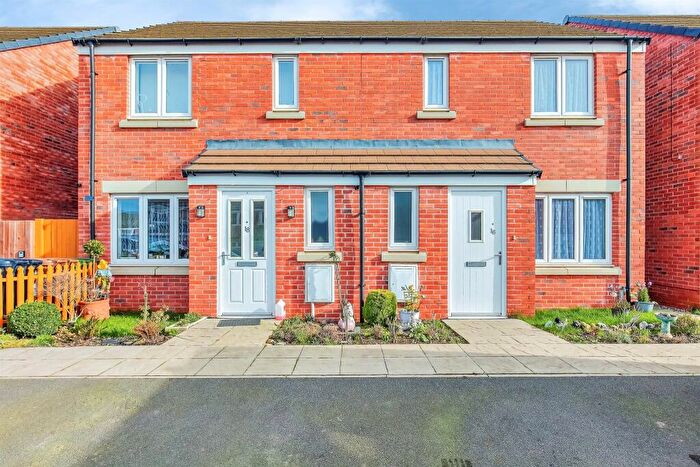
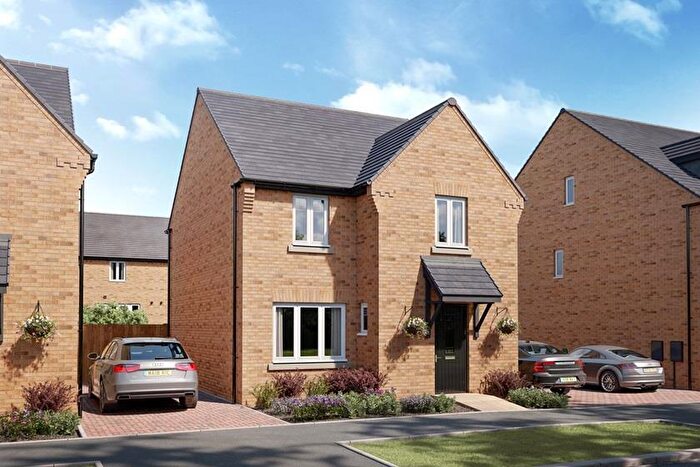
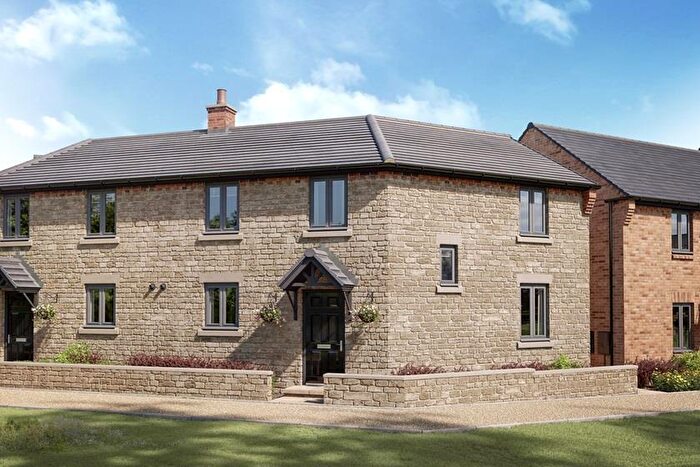
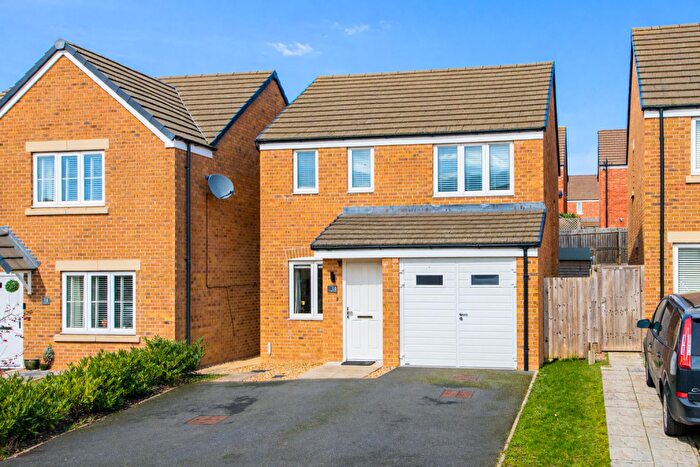
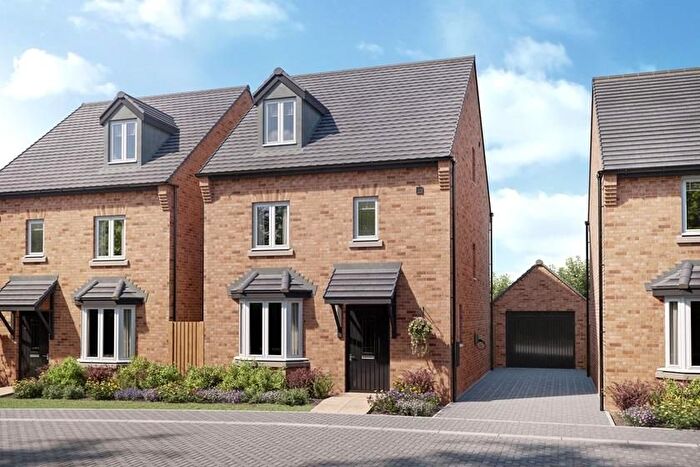
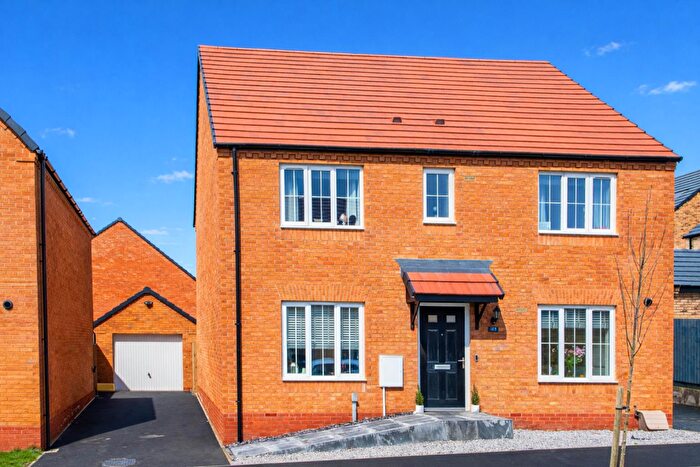
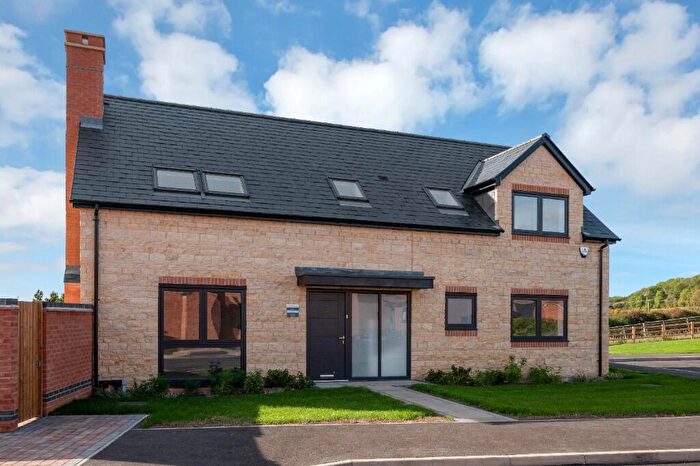
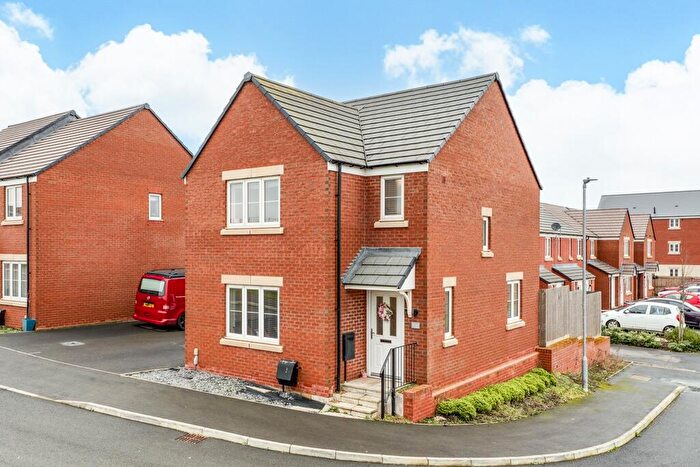
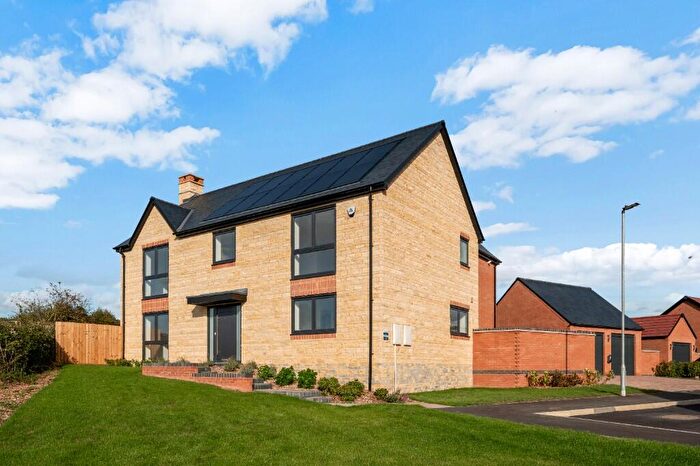
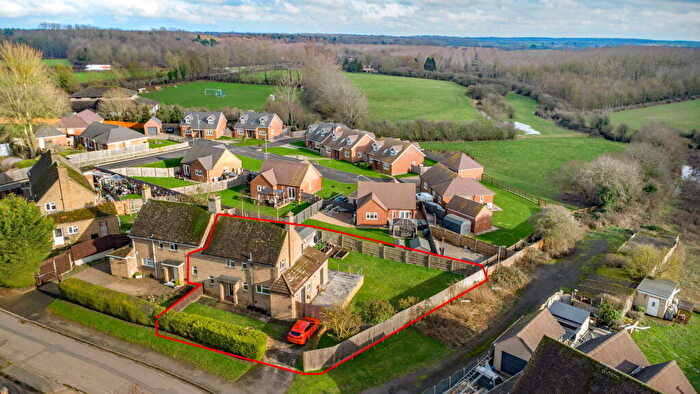
Properties in Lyveden have an average house price of £397,302.00 and had 91 Property Transactions within the last 3 years¹.
Lyveden is an area in Kettering, Northamptonshire with 874 households², where the most expensive property was sold for £1,250,000.00.
Properties for sale in Lyveden
Roads and Postcodes in Lyveden
Navigate through our locations to find the location of your next house in Lyveden, Kettering for sale or to rent.
| Streets | Postcodes |
|---|---|
| Aldwincle Road | NN14 3BL |
| Back Lane | NN14 3ER |
| Barnards Way | NN14 3JE |
| Bells Close | NN14 3JG |
| Benefield Road | NN14 3ES NN14 3JA |
| Braybrooks | NN14 3HX |
| Brewery Yard | NN14 3BT |
| Bridge Street | NN14 3ET |
| Causin Close | NN14 3EU |
| Church Street | NN14 3EX |
| Drayton Road | NN14 3BG |
| Farm Close | NN14 3EF |
| Fermyn Close | NN14 3AJ |
| Grafton Road | NN14 3EY NN14 3NB NN14 3FE |
| Hall Hill | NN14 3EZ |
| Harley Way | NN14 3JD |
| High Street | NN14 3HA |
| Hunter Rise | NN14 3FB NN14 3FG |
| Kennel Hill | NN14 3HB |
| Kitchen Garden Cottage | NN14 3HZ |
| Latham Street | NN14 3HD |
| Lyveden Road | NN14 3HE NN14 3HS |
| Main Street | NN14 3AS NN14 3BH NN14 3BX |
| Mauntley Avenue | NN14 3HF |
| Mill Lane | NN14 3BQ NN14 3HG |
| Mordaunt Close | NN14 3BY |
| Newton Lane | NN14 3BF |
| Newtown | NN14 3HQ |
| Old Dry Lane | NN14 3HY |
| Park Cottage | NN14 3NA |
| Park Walk | NN14 3HH NN14 3JH |
| Robbs Lane | NN14 3BE |
| Sandlands Avenue | NN14 3HJ |
| Sandlands Close | NN14 3HL |
| Slipton Lane | NN14 3AR NN14 3BW NN14 3FJ |
| Stable Hill | NN14 3HN |
| Stanion Road | NN14 1DY NN14 1DZ NN14 3HW NN14 3FF |
| Sudborough Road | NN14 3HP NN14 3AQ NN14 3HT NN14 3SL |
| Swan Avenue | NN14 3JQ |
| The Lawns | NN14 3AU |
| The Syke | NN14 3HR |
| Woodford Lane | NN14 3BJ |
| Woodlands Close | NN14 3LU |
| Woodlands Mews | NN14 3LX |
| Woodwell Cottages | NN14 3AN |
| Woodyard Close | NN14 3LZ |
| NN14 3AH NN14 3AT NN14 3BS NN14 3BU NN14 3BA NN14 3BB NN14 3BD NN14 3JF NN14 3NG |
Transport near Lyveden
- FAQ
- Price Paid By Year
- Property Type Price
Frequently asked questions about Lyveden
What is the average price for a property for sale in Lyveden?
The average price for a property for sale in Lyveden is £397,302. This amount is 46% higher than the average price in Kettering. There are 1,439 property listings for sale in Lyveden.
What streets have the most expensive properties for sale in Lyveden?
The streets with the most expensive properties for sale in Lyveden are Mill Lane at an average of £570,000, Stanion Road at an average of £550,000 and Woodyard Close at an average of £484,000.
What streets have the most affordable properties for sale in Lyveden?
The streets with the most affordable properties for sale in Lyveden are Benefield Road at an average of £178,000, Sandlands Avenue at an average of £242,500 and Newtown at an average of £252,000.
Which train stations are available in or near Lyveden?
Some of the train stations available in or near Lyveden are Corby, Kettering and Wellingborough.
Property Price Paid in Lyveden by Year
The average sold property price by year was:
| Year | Average Sold Price | Price Change |
Sold Properties
|
|---|---|---|---|
| 2025 | £382,648 | -11% |
27 Properties |
| 2024 | £425,121 | 11% |
33 Properties |
| 2023 | £380,451 | -17% |
31 Properties |
| 2022 | £445,944 | 12% |
28 Properties |
| 2021 | £391,659 | 24% |
32 Properties |
| 2020 | £298,043 | -19% |
23 Properties |
| 2019 | £356,138 | 14% |
18 Properties |
| 2018 | £304,871 | -21% |
38 Properties |
| 2017 | £367,693 | 12% |
44 Properties |
| 2016 | £325,224 | 4% |
43 Properties |
| 2015 | £310,644 | 6% |
29 Properties |
| 2014 | £290,610 | 18% |
29 Properties |
| 2013 | £237,018 | -49% |
27 Properties |
| 2012 | £353,701 | 25% |
21 Properties |
| 2011 | £265,000 | -15% |
18 Properties |
| 2010 | £303,745 | 24% |
24 Properties |
| 2009 | £231,781 | 3% |
16 Properties |
| 2008 | £225,905 | -29% |
16 Properties |
| 2007 | £290,895 | 26% |
44 Properties |
| 2006 | £215,768 | -13% |
39 Properties |
| 2005 | £243,514 | 8% |
31 Properties |
| 2004 | £223,057 | -5% |
47 Properties |
| 2003 | £234,780 | 38% |
53 Properties |
| 2002 | £145,673 | -8% |
39 Properties |
| 2001 | £157,958 | 7% |
48 Properties |
| 2000 | £146,992 | 3% |
39 Properties |
| 1999 | £143,103 | 4% |
48 Properties |
| 1998 | £136,716 | 34% |
30 Properties |
| 1997 | £89,927 | -9% |
43 Properties |
| 1996 | £97,869 | -6% |
33 Properties |
| 1995 | £103,671 | - |
30 Properties |
Property Price per Property Type in Lyveden
Here you can find historic sold price data in order to help with your property search.
The average Property Paid Price for specific property types in the last three years are:
| Property Type | Average Sold Price | Sold Properties |
|---|---|---|
| Semi Detached House | £305,175.00 | 20 Semi Detached Houses |
| Detached House | £485,244.00 | 47 Detached Houses |
| Terraced House | £301,854.00 | 24 Terraced Houses |

