
Houses for sale in Kettering, Northamptonshire
House Prices in Kettering
Properties in Kettering have an average house price of £275k and had 5,277 Property Transactions within the last 3 years.¹
Kettering is an area in Northamptonshire with 51,024 households², where the most expensive property was sold for £19.5M.
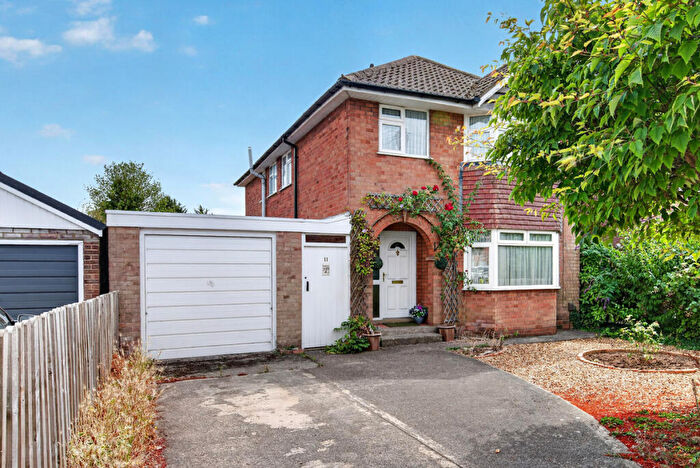
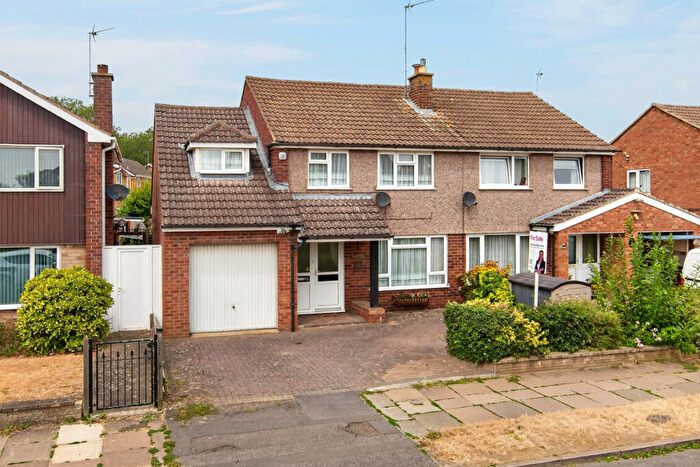
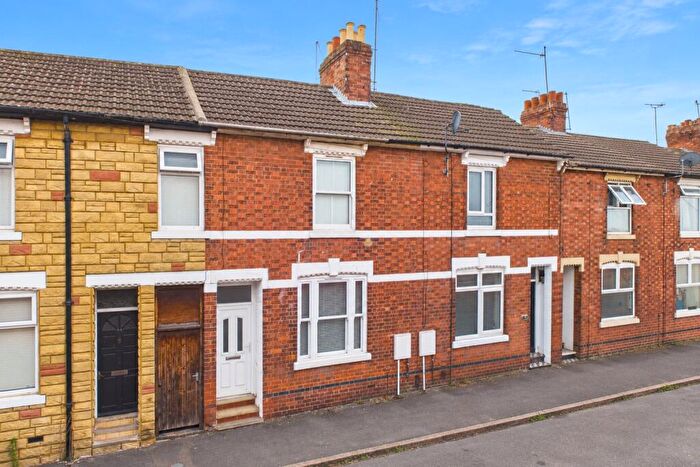
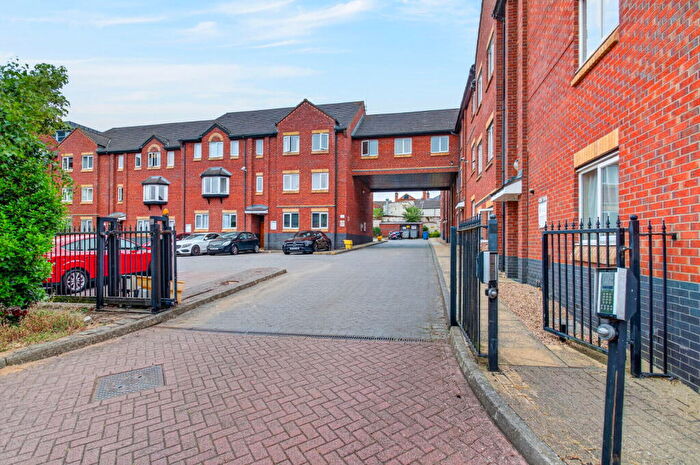
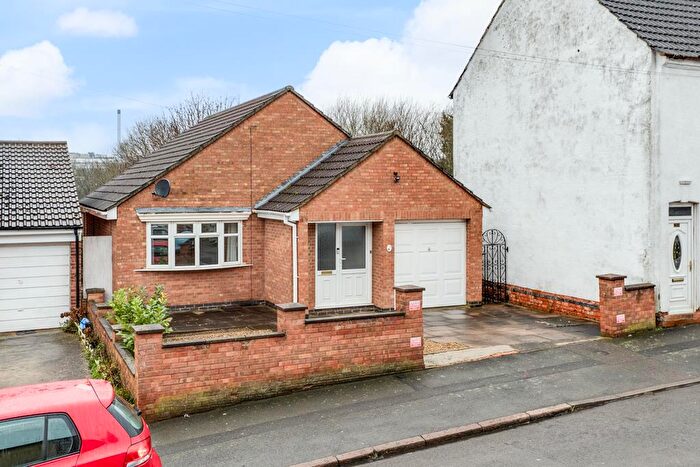
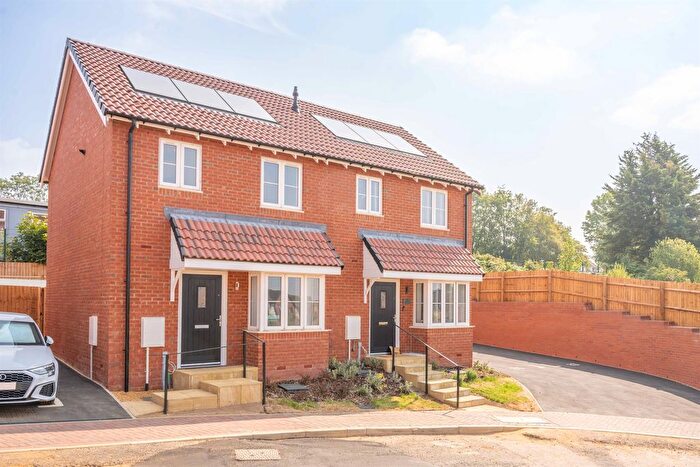
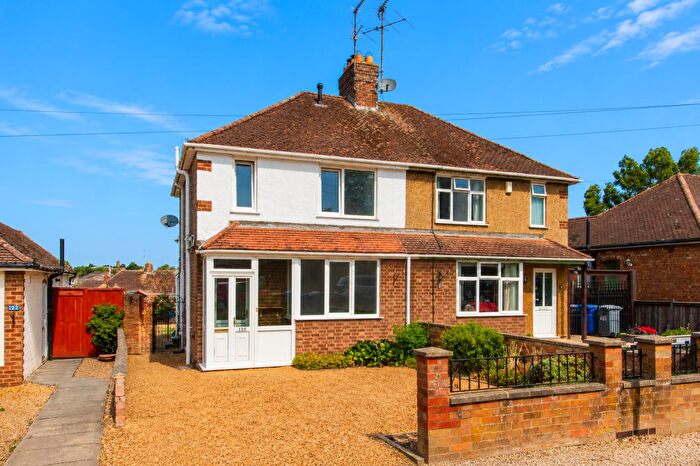
Properties for sale in Kettering
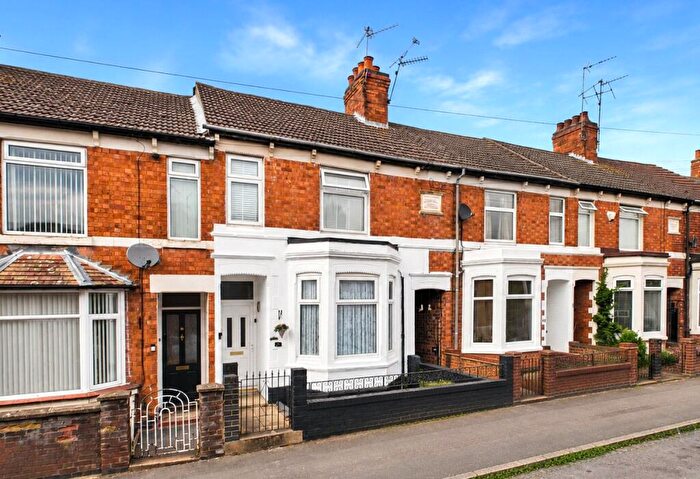
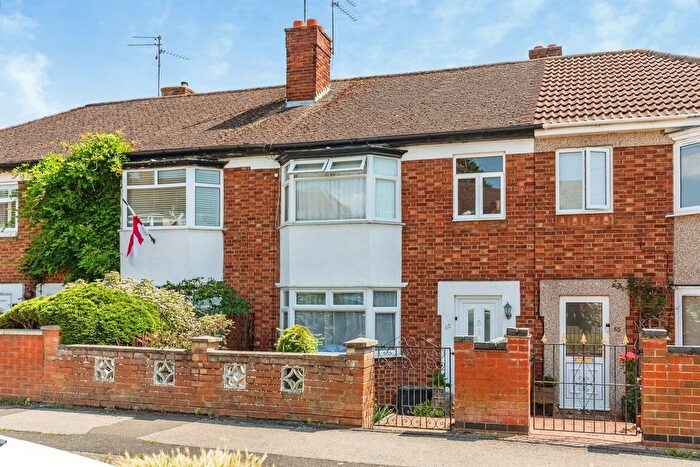
![]()
If you are looking to sell your house, let it out, or receive a property valuation, an expert can help you.
Click the button below to get started.

Neighbourhoods in Kettering
Navigate through our locations to find the location of your next house in Kettering, Northamptonshire for sale or to rent.
- Harrowden & Sywell
- All Saints
- Avondale Grange
- Barnwell
- Barton
- Brambleside
- Burton Latimer
- Desborough Loatland
- Desborough St Giles
- Ise Lodge
- Lyveden
- North
- Northfield
- Pipers Hill
- Queen Eleanor And Buccleuch
- Rothwell
- Slade
- St Michaels And Wicksteed
- St Peters
- Stanion And Corby Village
- Thrapston Lakes
- Thrapston Market
- Welland
- William Knibb
- Woodford
- Stanion & Corby Village
- Corby Rural
- Burton And Broughton
- Earls Barton
- Desborough
- Thrapston
- Clover Hill
- Rothwell And Mawsley
- Irthlingborough
- Ise
- Wicksteed
- Northall
- Windmill
Property price trends in Kettering
According to the latest Land Registry data, the average home in Kettering sold for £428,691 in 2026. That figure comes from a substantial record of 72,719 sales logged over the past 31 years.
Prices have continued to climb over the last three years. Compared with 2023, when the typical sale came in around £270,799, that's a rise of roughly 58.3%.
Looking back five years, average prices are up about 64.6% since 2021, a gain of around £168,188 in cash terms.
Zoom out to the past decade for the fuller picture. Back in 2016, homes here averaged £200,722, so the typical sold price has climbed about 113.6% since then, roughly 7.9% a year. Stretch the view to fifteen years and that annual pace eases back to about 6.7%.
Frequently asked questions about Kettering
What is the average price for a property for sale in Kettering?
The average price for a property for sale in Kettering is £275,343. This amount is 5% lower than the average price in Northamptonshire. There are more than 10,000 property listings for sale in Kettering.
What locations have the most expensive properties for sale in Kettering?
The locations with the most expensive properties for sale in Kettering are Harrowden & Sywell at an average of £740,000, Barnwell at an average of £532,110 and North at an average of £445,900.
What locations have the most affordable properties for sale in Kettering?
The locations with the most affordable properties for sale in Kettering are William Knibb at an average of £167,583, Northfield at an average of £181,103 and Avondale Grange at an average of £184,801.
Which train stations are available in or near Kettering?
Some of the train stations available in or near Kettering are Kettering, Wellingborough and Corby.
Property Price Paid in Kettering by Year
The average sold property price by year was:
| Year | Average Sold Price | Price Change |
Sold Properties
|
|---|---|---|---|
| 2026 | £428,691 | 36% |
119 Properties |
| 2025 | £273,082 | 1% |
1,711 Properties |
| 2024 | £271,510 | 0,3% |
1,808 Properties |
| 2023 | £270,799 | -2% |
1,639 Properties |
| 2022 | £275,273 | 5% |
2,136 Properties |
| 2021 | £260,503 | 8% |
2,579 Properties |
| 2020 | £240,128 | 1% |
1,953 Properties |
| 2019 | £237,029 | 2% |
2,233 Properties |
| 2018 | £233,384 | 6% |
2,402 Properties |
| 2017 | £220,543 | 9% |
2,686 Properties |
Property Price per Property Type in Kettering
Here you can find historic sold price data in order to help with your property search.
The average Property Paid Price for specific property types in the last three years are:
| Property Type | Average Sold Price | Sold Properties |
|---|---|---|
| Semi Detached House | £262,099.00 | 1,713 Semi Detached Houses |
| Terraced House | £204,789.00 | 1,495 Terraced Houses |
| Detached House | £387,463.00 | 1,666 Detached Houses |
| Flat | £129,872.00 | 403 Flats |
Transport in Kettering
Please see below transportation links in this area:
