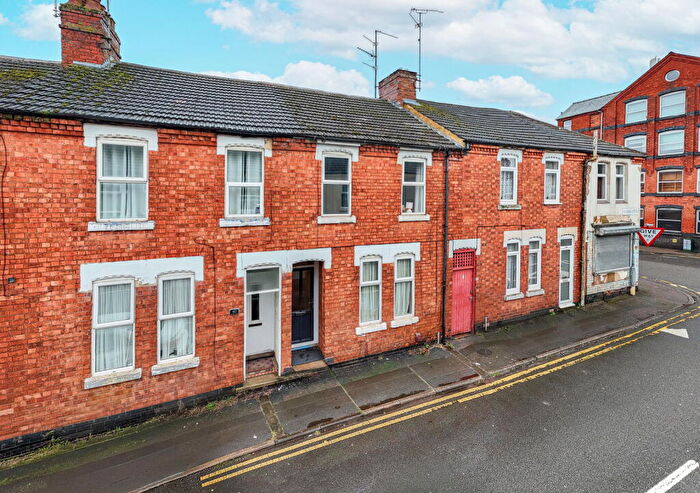
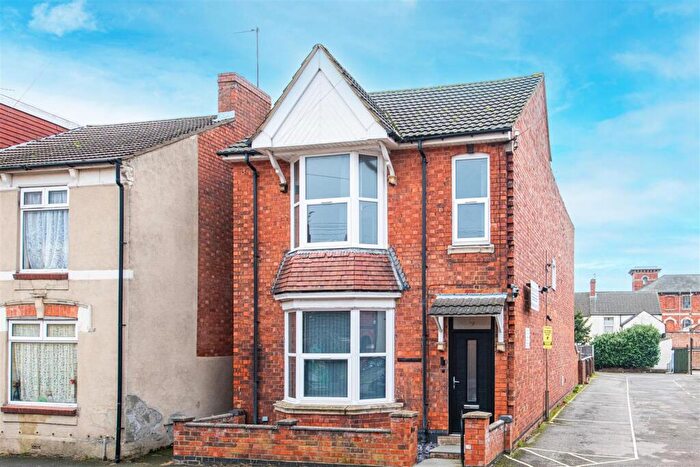
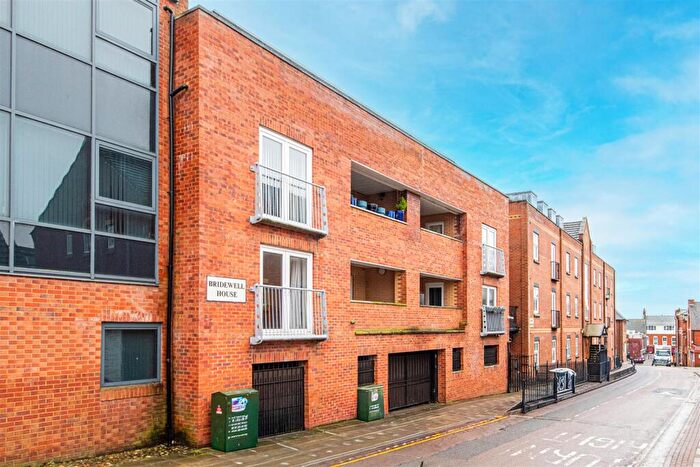
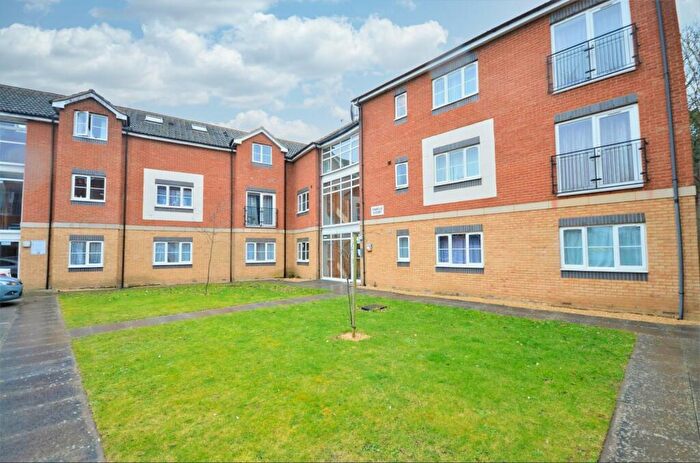
Houses for sale & to rent in Northfield, Kettering
House Prices in Northfield
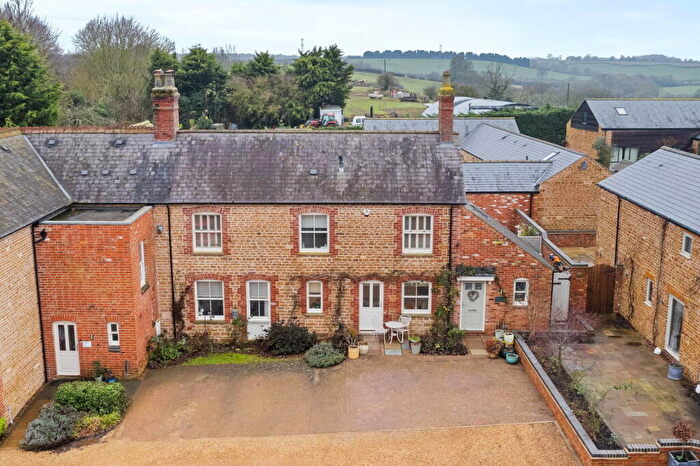
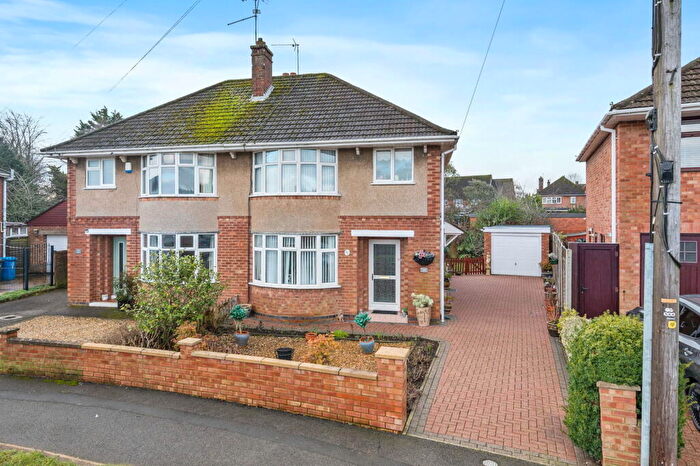
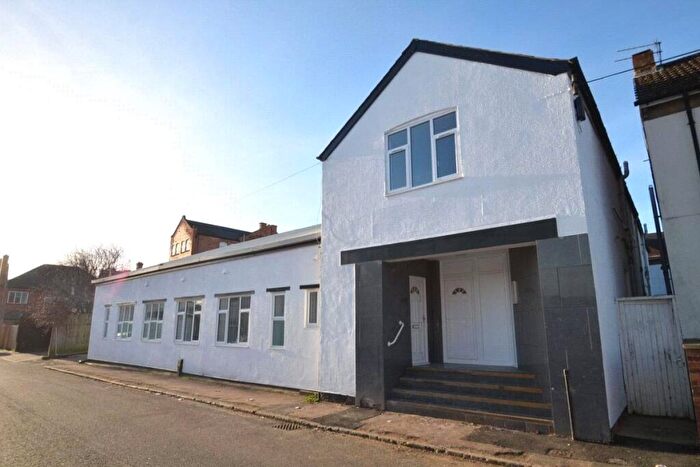
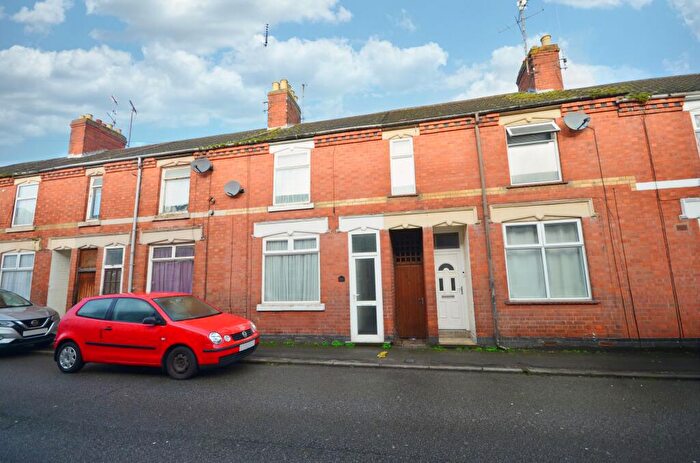
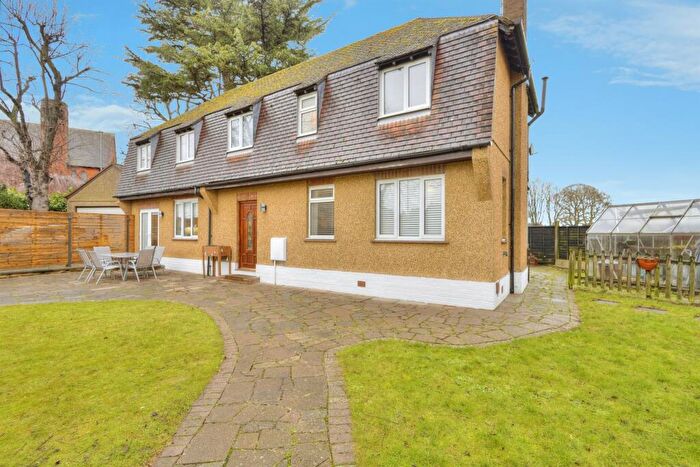
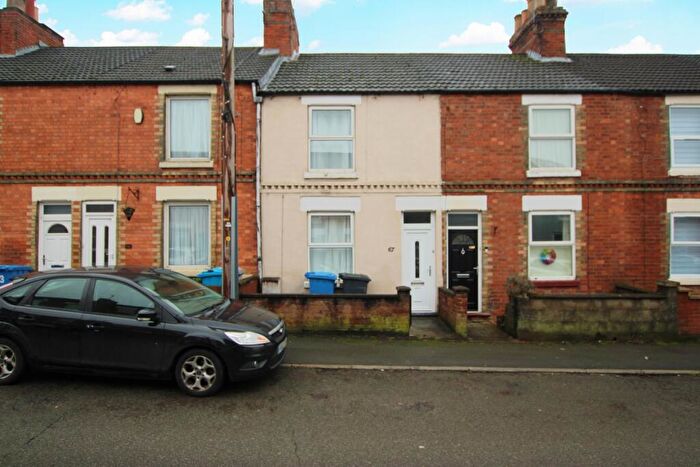
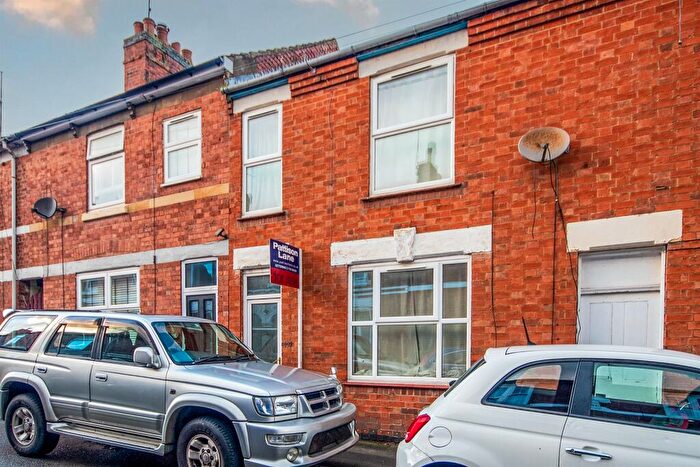
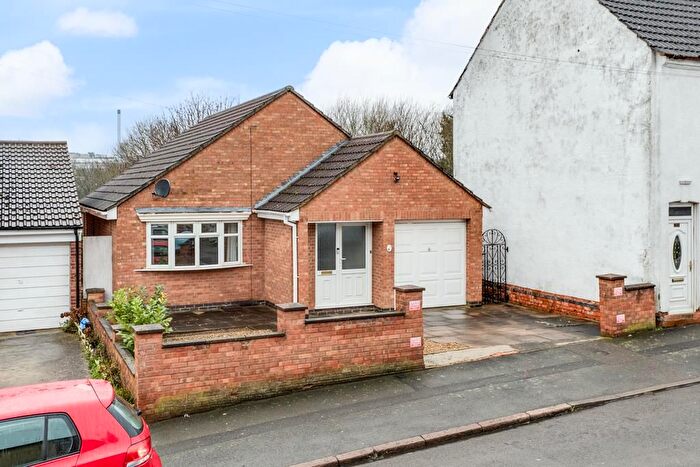
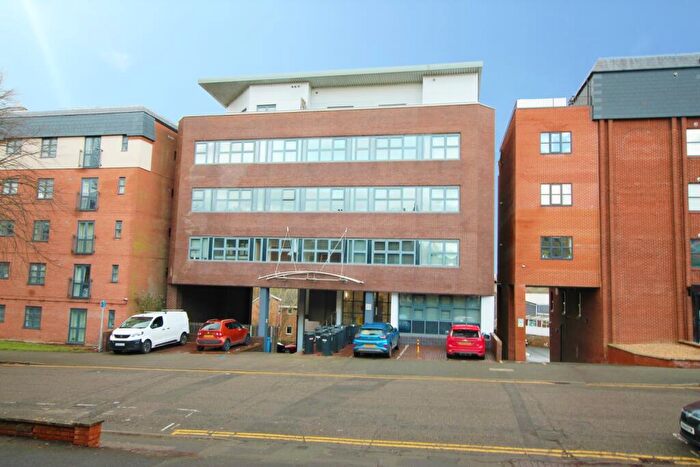
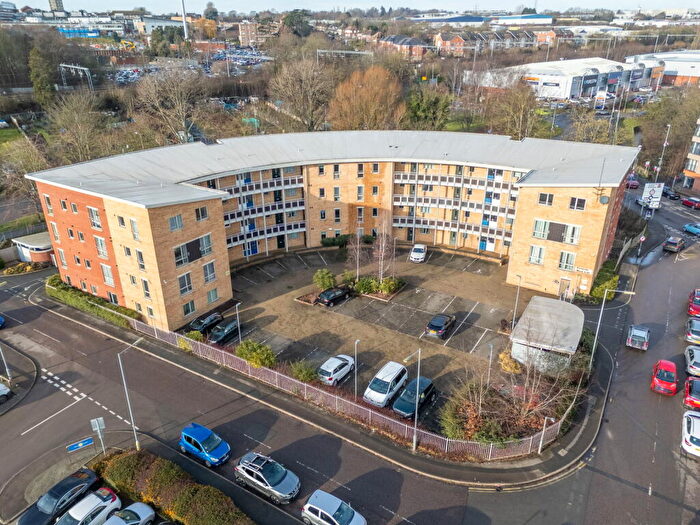
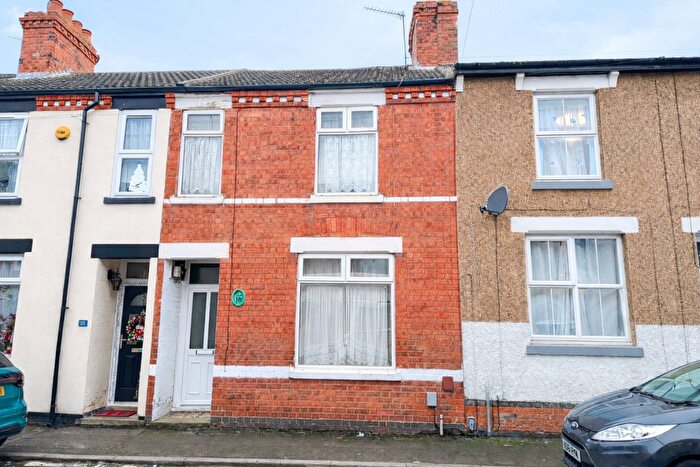
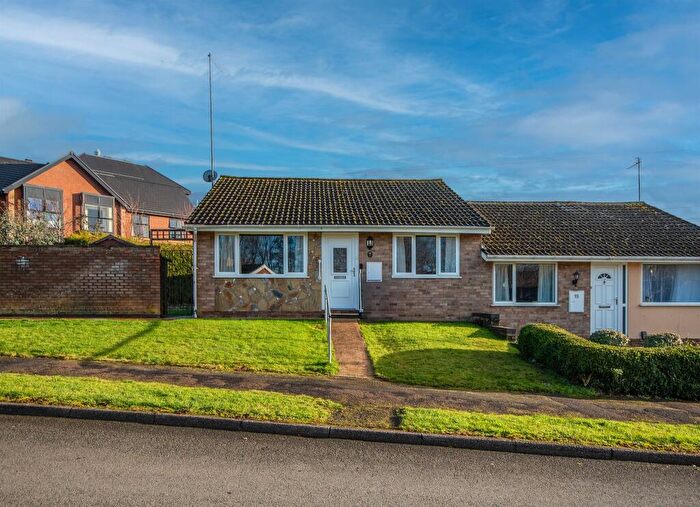
Properties in Northfield have an average house price of £180,185.00 and had 151 Property Transactions within the last 3 years¹.
Northfield is an area in Kettering, Northamptonshire with 1,325 households², where the most expensive property was sold for £540,000.00.
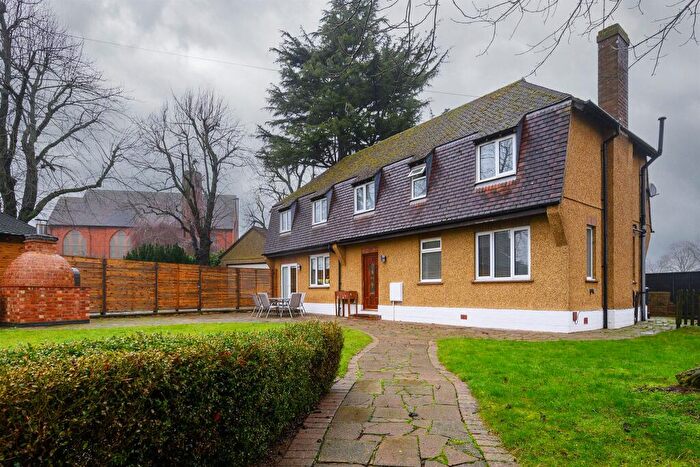
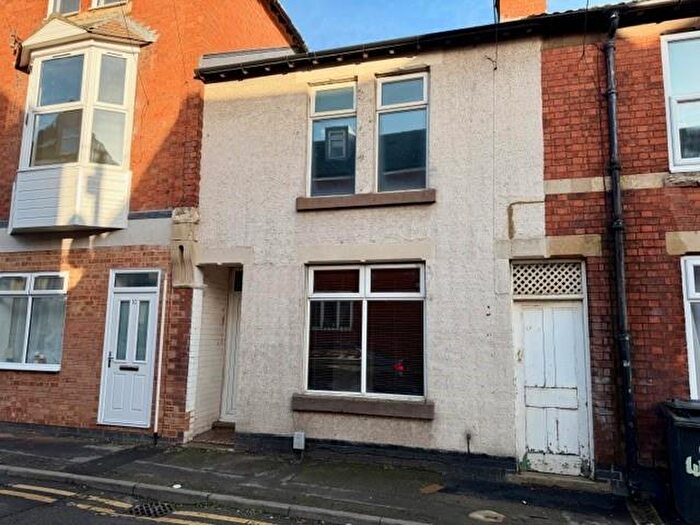
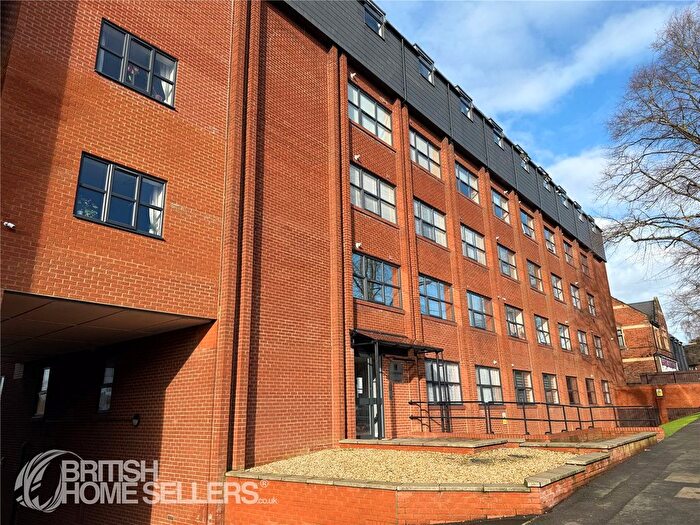
Properties for sale in Northfield
Roads and Postcodes in Northfield
Navigate through our locations to find the location of your next house in Northfield, Kettering for sale or to rent.
| Streets | Postcodes |
|---|---|
| Albion Road | NN16 9DX |
| Ashley Court | NN16 8JQ |
| Bayes Street | NN16 8EH NN16 8HR |
| Bellway Close | NN16 9EH |
| Brunel Close | NN16 9QQ |
| Buccleuch Street | NN16 9ED NN16 9EE NN16 9EF |
| Carlton Street | NN16 8EB NN16 8ED |
| Clarke Close | NN16 9HP |
| Cobden Street | NN16 8DX NN16 8ER |
| Cross Court | NN16 9BN |
| Cross Street | NN16 9DH NN16 9DJ NN16 9DL NN16 9DQ |
| Cunliffe Drive | NN16 9QJ |
| Cunliffe Drive Industrial Estate | NN16 8LD |
| Dryden Street | NN16 8EU |
| Duke Street | NN16 9DY NN16 9DZ NN16 9EA |
| Dyson Drive | NN16 9HR |
| Field Street | NN16 8EJ NN16 8EL NN16 8EW NN16 8EN NN16 8JZ |
| Field Street Avenue | NN16 8EP |
| Grafton Street | NN16 9DD NN16 9DE NN16 9DF |
| Grange Road | NN16 8ES |
| Hill Street | NN16 8EE |
| Leicester Close | NN16 8EZ |
| Leicester Street | NN16 8EF NN16 8EG |
| Lower Street | NN16 8DL NN16 8DN |
| Melton Street | NN16 9DS NN16 9DT |
| Northall Street | NN16 8DS |
| Northfield Avenue | NN16 9HT NN16 9BF NN16 9TS NN16 9XZ |
| Northfield Close | NN16 9HS |
| Oakley Street | NN16 9DP NN16 9DR |
| Oxford Street | NN16 8EQ |
| Railway View | NN16 8EA NN16 8FE |
| Ridley Street | NN16 9DG |
| Rockingham Close | NN16 8AT NN16 8AU |
| Rockingham Road | NN16 8LA NN16 9HX NN16 9HY NN16 9HZ NN16 9JA NN16 8JX NN16 8JY |
| Sackville Street | NN16 9DN NN16 9EQ |
| Spencer Street | NN16 9DW |
| Stanier Close | NN16 9XW |
| The Gardens | NN16 9DU |
| Union Street | NN16 8JR NN16 9DA NN16 9DB |
| Vale Street | NN16 9EB |
| Windsor Gardens | NN16 8DU |
Transport near Northfield
- FAQ
- Price Paid By Year
- Property Type Price
Frequently asked questions about Northfield
What is the average price for a property for sale in Northfield?
The average price for a property for sale in Northfield is £180,185. This amount is 34% lower than the average price in Kettering. There are 1,349 property listings for sale in Northfield.
What streets have the most expensive properties for sale in Northfield?
The streets with the most expensive properties for sale in Northfield are The Gardens at an average of £367,000, Dyson Drive at an average of £306,250 and Clarke Close at an average of £289,666.
What streets have the most affordable properties for sale in Northfield?
The streets with the most affordable properties for sale in Northfield are Bellway Close at an average of £133,000, Railway View at an average of £134,250 and Albion Road at an average of £147,250.
Which train stations are available in or near Northfield?
Some of the train stations available in or near Northfield are Kettering, Corby and Wellingborough.
Property Price Paid in Northfield by Year
The average sold property price by year was:
| Year | Average Sold Price | Price Change |
Sold Properties
|
|---|---|---|---|
| 2025 | £180,954 | 0,3% |
44 Properties |
| 2024 | £180,369 | 1% |
57 Properties |
| 2023 | £179,300 | -5% |
50 Properties |
| 2022 | £189,075 | -5% |
81 Properties |
| 2021 | £198,482 | 26% |
72 Properties |
| 2020 | £146,834 | 3% |
48 Properties |
| 2019 | £142,240 | -6% |
54 Properties |
| 2018 | £150,672 | 15% |
84 Properties |
| 2017 | £128,432 | 1% |
91 Properties |
| 2016 | £127,629 | 1% |
92 Properties |
| 2015 | £125,727 | 10% |
70 Properties |
| 2014 | £112,561 | 7% |
57 Properties |
| 2013 | £104,504 | 8% |
45 Properties |
| 2012 | £95,870 | -3% |
31 Properties |
| 2011 | £98,697 | -12% |
44 Properties |
| 2010 | £110,701 | 13% |
37 Properties |
| 2009 | £96,178 | -34% |
28 Properties |
| 2008 | £129,213 | 2% |
46 Properties |
| 2007 | £126,326 | 3% |
112 Properties |
| 2006 | £122,993 | 3% |
164 Properties |
| 2005 | £119,175 | 16% |
107 Properties |
| 2004 | £100,584 | 19% |
94 Properties |
| 2003 | £81,932 | 14% |
99 Properties |
| 2002 | £70,375 | 17% |
119 Properties |
| 2001 | £58,469 | 31% |
104 Properties |
| 2000 | £40,611 | 7% |
95 Properties |
| 1999 | £37,963 | -5% |
98 Properties |
| 1998 | £39,976 | -7% |
96 Properties |
| 1997 | £42,744 | 29% |
84 Properties |
| 1996 | £30,539 | -4% |
61 Properties |
| 1995 | £31,883 | - |
58 Properties |
Property Price per Property Type in Northfield
Here you can find historic sold price data in order to help with your property search.
The average Property Paid Price for specific property types in the last three years are:
| Property Type | Average Sold Price | Sold Properties |
|---|---|---|
| Semi Detached House | £189,348.00 | 11 Semi Detached Houses |
| Detached House | £274,694.00 | 18 Detached Houses |
| Terraced House | £172,476.00 | 107 Terraced Houses |
| Flat | £115,050.00 | 15 Flats |

