
Houses for sale & to rent in Market Harborough, Northamptonshire
House Prices in Market Harborough
Properties in Market Harborough have an average house price of £464k and had 145 Property Transactions within the last 3 years.¹
Market Harborough is an area in Northamptonshire with 1,663 households², where the most expensive property was sold for £1.45M.
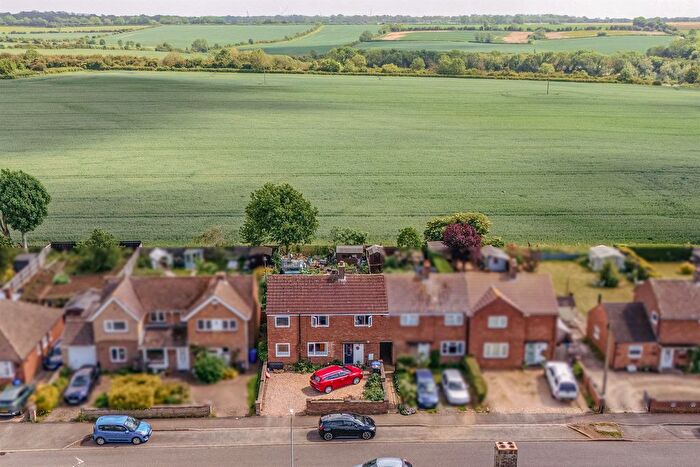
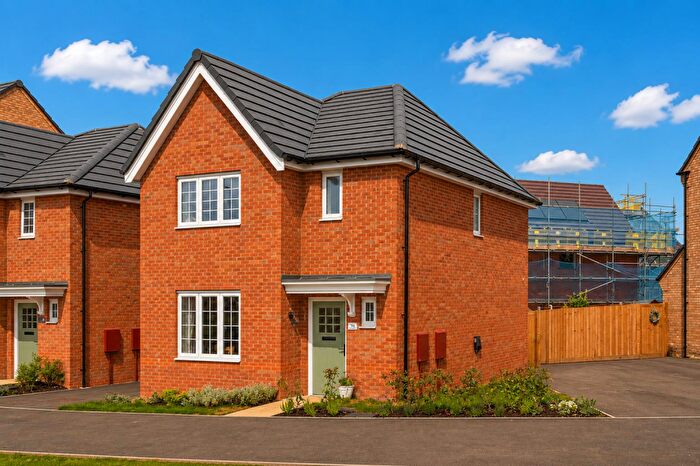
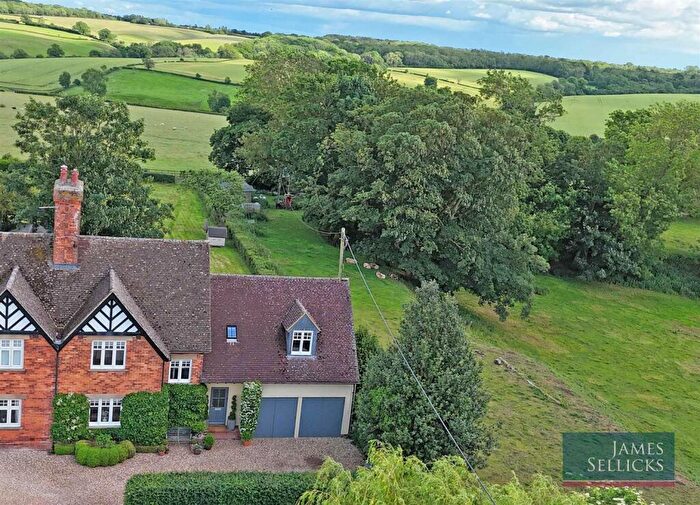
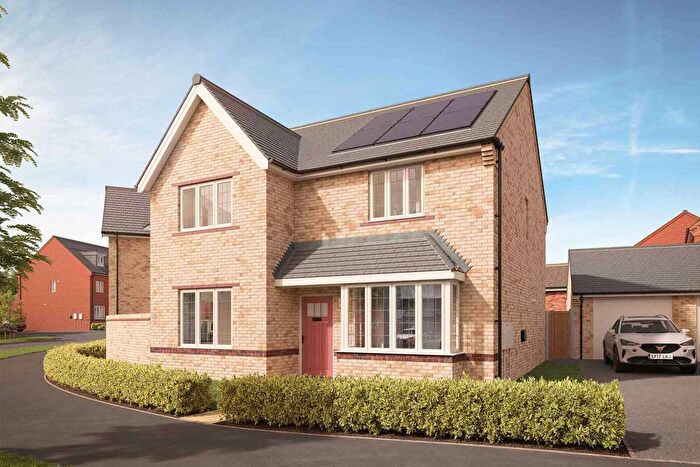
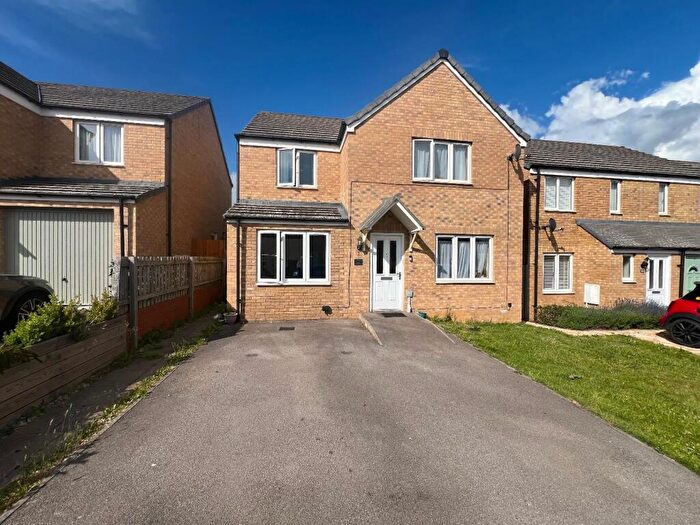
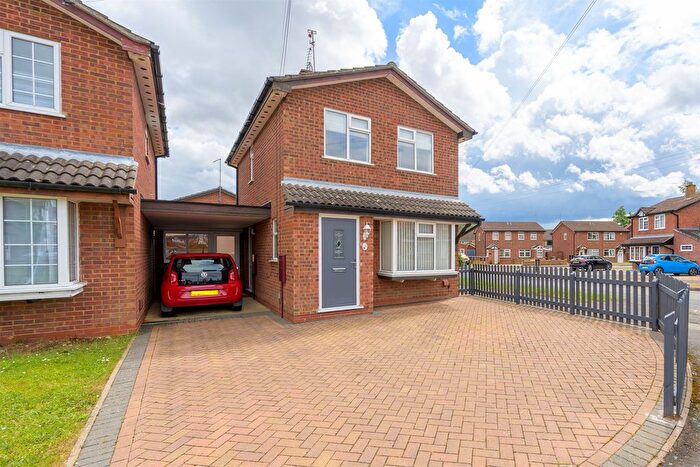
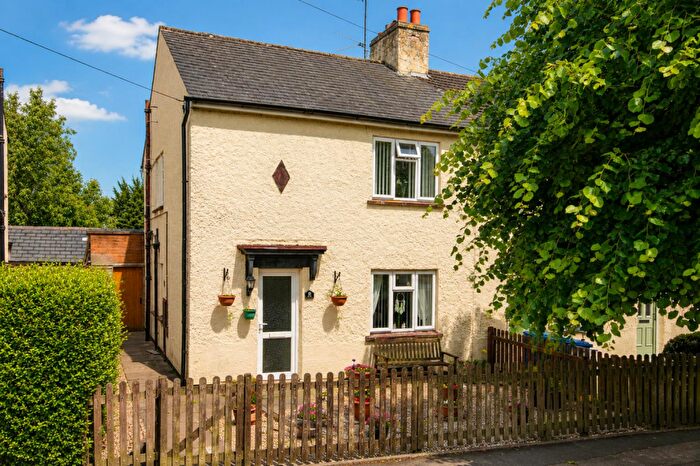
Properties for sale in Market Harborough
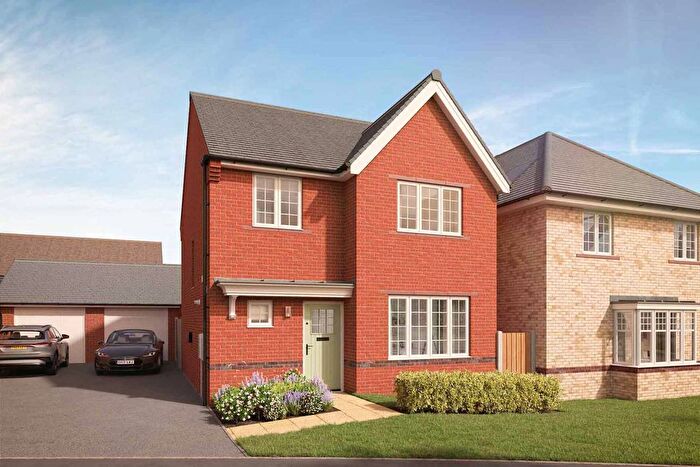
![]()
If you are looking to sell your house, let it out, or receive a property valuation, an expert can help you.
Click the button below to get started.
Neighbourhoods in Market Harborough
Navigate through our locations to find the location of your next house in Market Harborough, Northamptonshire for sale or to rent.
Transport in Market Harborough
Please see below transportation links in this area:

- FAQ
- Price Paid By Year
- Property Type Price
Frequently asked questions about Market Harborough
What is the average price for a property for sale in Market Harborough?
The average price for a property for sale in Market Harborough is £464,327. This amount is 60% higher than the average price in Northamptonshire. There are more than 10,000 property listings for sale in Market Harborough.
What locations have the most expensive properties for sale in Market Harborough?
The locations with the most expensive properties for sale in Market Harborough are Welford at an average of £526,428 and Welland at an average of £505,694.
What locations have the most affordable properties for sale in Market Harborough?
The location with the most affordable properties for sale in Market Harborough is Rural West at an average of £389,783.
Which train stations are available in or near Market Harborough?
Some of the train stations available in or near Market Harborough are Market Harborough, Corby and Kettering.
Property Price Paid in Market Harborough by Year
The average sold property price by year was:
| Year | Average Sold Price | Price Change |
Sold Properties
|
|---|---|---|---|
| 2026 | £688,333 | 42% |
3 Properties |
| 2025 | £397,052 | -25% |
48 Properties |
| 2024 | £498,245 | 3% |
51 Properties |
| 2023 | £483,569 | -0,4% |
43 Properties |
| 2022 | £485,266 | 14% |
67 Properties |
| 2021 | £418,336 | 0,4% |
110 Properties |
| 2020 | £416,732 | 7% |
47 Properties |
| 2019 | £386,242 | 0,1% |
75 Properties |
| 2018 | £385,760 | -2% |
53 Properties |
| 2017 | £392,648 | 24% |
104 Properties |
| 2016 | £299,358 | -9% |
65 Properties |
| 2015 | £326,379 | 1% |
81 Properties |
| 2014 | £321,947 | 5% |
75 Properties |
| 2013 | £305,225 | 10% |
56 Properties |
| 2012 | £273,643 | -2% |
48 Properties |
| 2011 | £280,076 | -1% |
32 Properties |
| 2010 | £283,341 | 10% |
33 Properties |
| 2009 | £255,326 | -11% |
41 Properties |
| 2008 | £282,361 | -25% |
34 Properties |
| 2007 | £352,604 | 13% |
78 Properties |
| 2006 | £307,362 | 16% |
75 Properties |
| 2005 | £256,867 | -7% |
64 Properties |
| 2004 | £273,631 | 19% |
76 Properties |
| 2003 | £222,548 | 10% |
98 Properties |
| 2002 | £201,388 | 19% |
73 Properties |
| 2001 | £163,012 | 14% |
51 Properties |
| 2000 | £140,805 | 5% |
66 Properties |
| 1999 | £134,246 | 5% |
67 Properties |
| 1998 | £127,121 | 18% |
57 Properties |
| 1997 | £104,258 | -9% |
87 Properties |
| 1996 | £113,665 | 24% |
65 Properties |
| 1995 | £86,365 | - |
36 Properties |
Property Price per Property Type in Market Harborough
Here you can find historic sold price data in order to help with your property search.
The average Property Paid Price for specific property types in the last three years are:
| Property Type | Average Sold Price | Sold Properties |
|---|---|---|
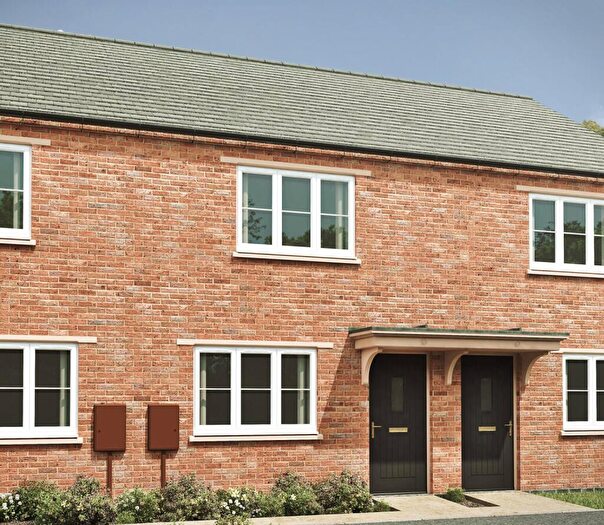
| Semi Detached House | £344,313.00 | 43 Semi Detached Houses |
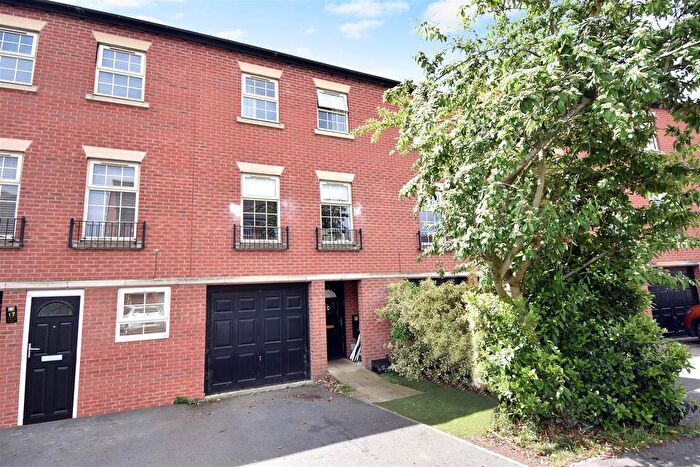
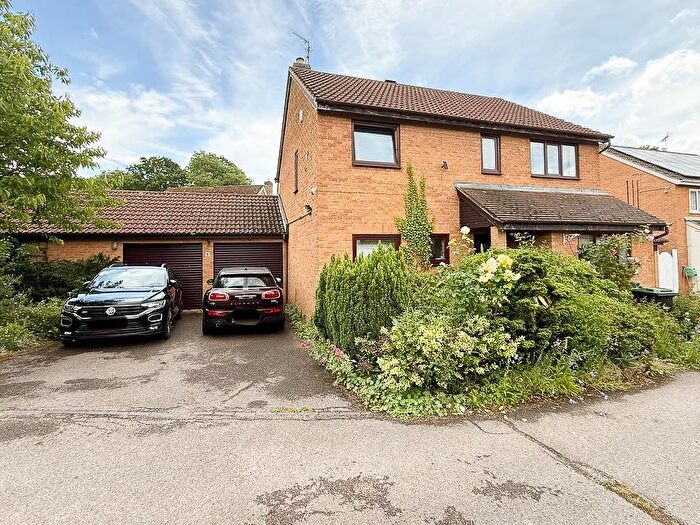
| Detached House | £546,732.00 | 86 Detached Houses |
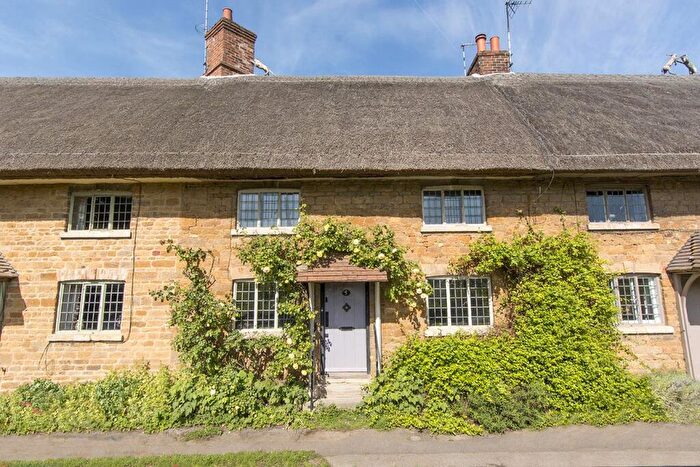
| Terraced House | £327,538.00 | 13 Terraced Houses |
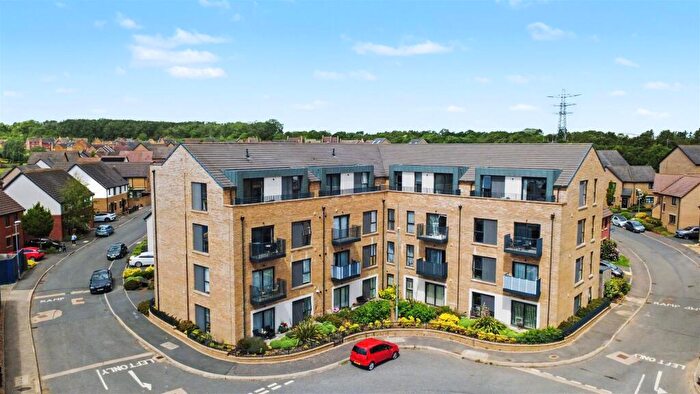
| Flat | £415,000.00 | 3 Flats |