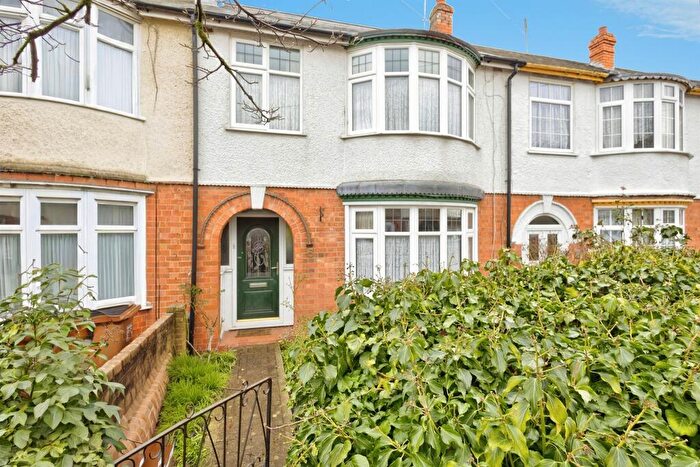
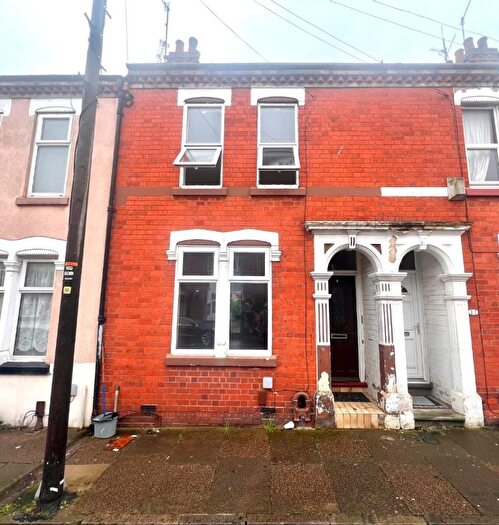
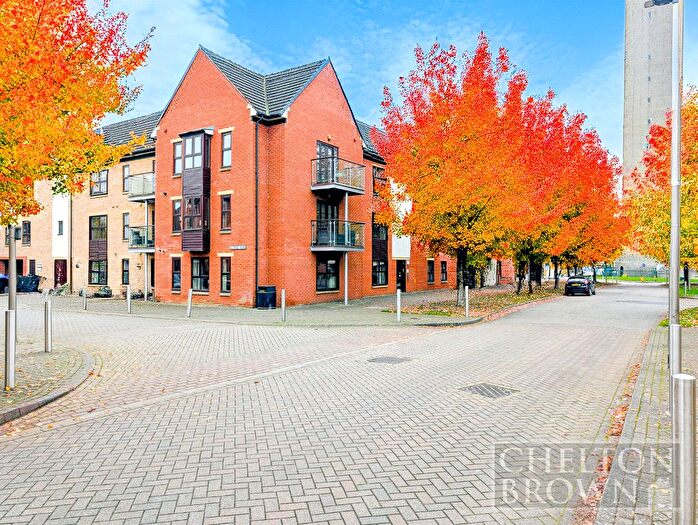
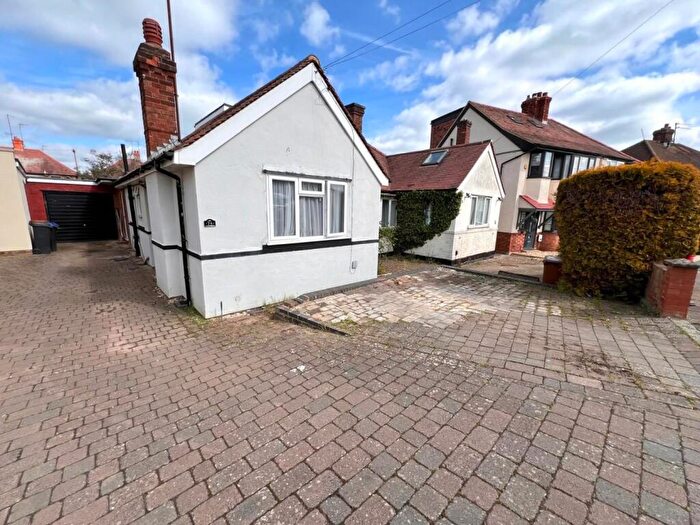
Houses for sale & to rent in St James, Northampton
House Prices in St James
Properties in St James have an average house price of £202,279.00 and had 238 Property Transactions within the last 3 years¹.
St James is an area in Northampton, Northamptonshire with 2,519 households², where the most expensive property was sold for £625,000.00.
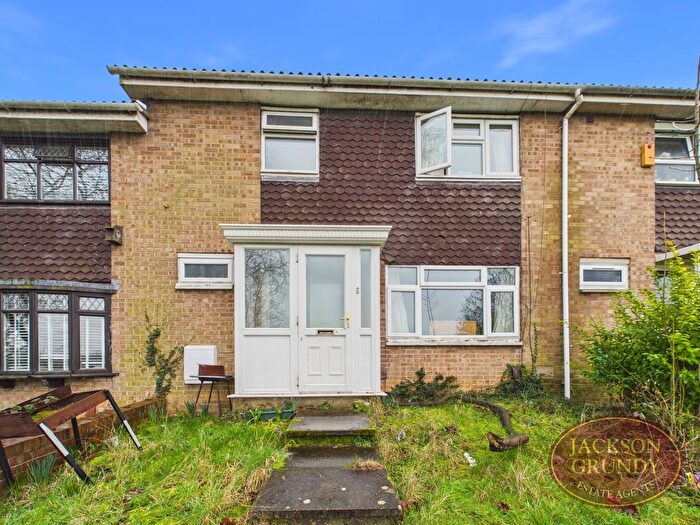
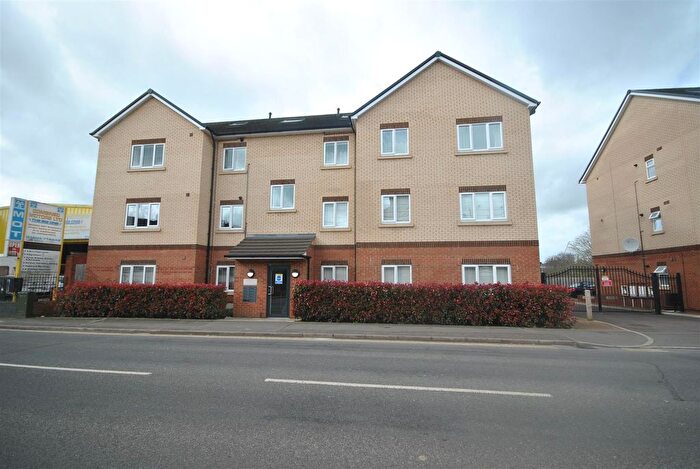
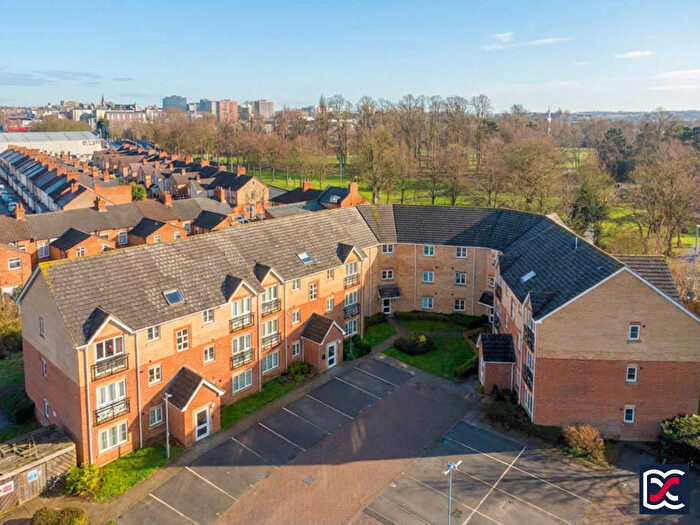
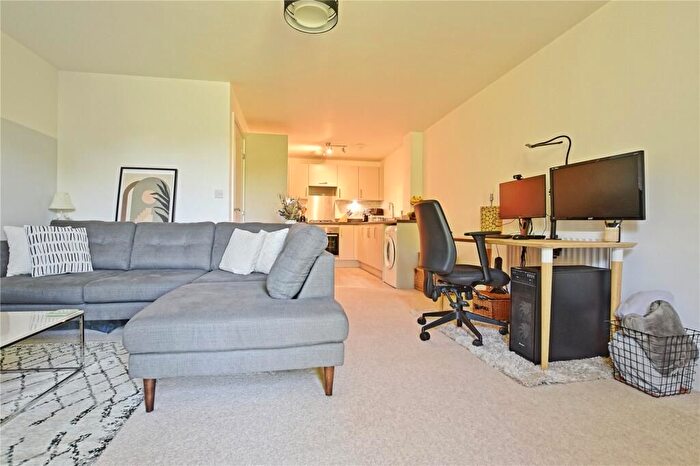
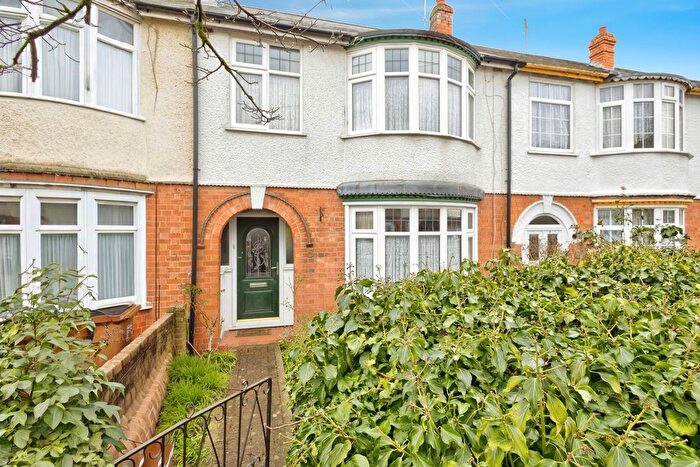
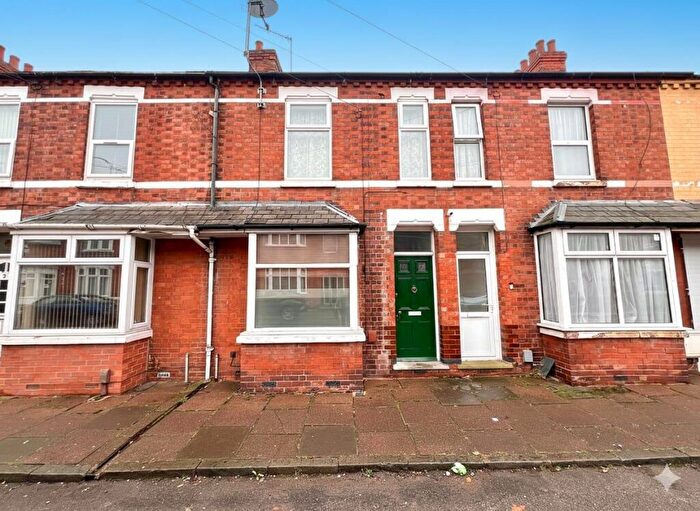
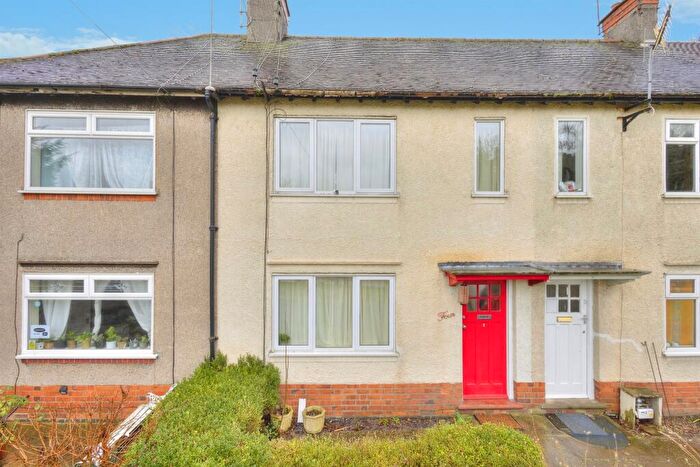
Properties for sale in St James
Roads and Postcodes in St James
Navigate through our locations to find the location of your next house in St James, Northampton for sale or to rent.
| Streets | Postcodes |
|---|---|
| Abbey Mews | NN5 5LP |
| Abbey Street | NN5 5LN NN5 5LR |
| Abbots Way | NN5 5DB |
| Aberdeen Terrace | NN5 7AD |
| Alma Street | NN5 5LS NN5 5LY |
| Althorp Road | NN5 5EF NN5 5EQ |
| Ambush Street | NN5 5DU NN5 5DX |
| Argyle Street | NN5 5LJ NN5 5JG |
| Bowden Road | NN5 5LT |
| Bruce Street | NN5 5BQ |
| Byfield Road | NN5 5HF NN5 5HG NN5 5HH NN5 5HQ NN5 5HR NN5 5HT |
| Dundee Street | NN5 5BP |
| Edgar Mobbs Way | NN5 5JE NN5 5JT |
| Elgin Street | NN5 5BW |
| Far End | NN5 5FN |
| Fife Street | NN5 5BH |
| First Lane | NN5 5FD |
| Forfar Street | NN5 5BJ |
| Franklin Street | NN5 5BZ |
| Glasgow Street | NN5 5BL NN5 5BN |
| Greenwood Road | NN5 5EA NN5 5EB NN5 5EG NN5 5ER |
| Harlestone Road | NN5 7AB NN5 7AE |
| Harvey Reeves Road | NN5 5JR |
| Holyrood Court | NN5 7JR |
| Holyrood Road | NN5 7AH |
| Lincoln Road | NN5 5JS NN5 5LA |
| Marlborough Road | NN5 5DS NN5 5DZ |
| Melbourne Road | NN5 5LL NN5 5LW |
| Millbrook Close | NN5 5JF |
| Muscott Street | NN5 5EY |
| Near Side | NN5 5FJ |
| Old Scholars Close | NN5 5AZ |
| Orchard Street | NN5 5EP |
| Park Corner | NN5 5FL |
| Parkwood Street | NN5 5DW |
| Peverels Way | NN5 5DD |
| Richmond Terrace | NN5 5DP |
| Rosebery Avenue | NN5 5BU |
| Ross Road | NN5 5AY |
| Sandhill Road | NN5 5LH |
| Second Lane | NN5 5FE |
| Seymour Street | NN5 5ET |
| Sharman Road | NN5 5JZ NN5 5LB |
| Spencer Bridge Road | NN5 5HA NN5 7DP |
| Spencer Street | NN5 5JU NN5 5JX |
| St James Mill Road | NN5 5JA NN5 5JH NN5 5JN NN5 5JY NN5 5RA NN5 5TZ NN5 5JP NN5 5JW |
| St James Park Road | NN5 5DQ NN5 5DN NN5 5DR NN5 5EL NN5 5EN NN5 5EU NN5 5DY |
| St James Road | NN5 5HS NN5 5HU NN5 5HW NN5 5HY NN5 5JB NN5 5LD NN5 5LE NN5 5LF NN5 5LQ |
| Standside | NN5 5FG |
| Stanley Road | NN5 5DT NN5 5EH |
| Steene Street | NN5 5EX |
| Stenson Street | NN5 5ED |
| Stirling Street | NN5 5BX |
| Stour Road | NN5 5AA |
| Sunderland Street | NN5 5ES |
| The Approach | NN5 5FF |
| The Business Centre | NN5 5AX |
| Tower Square | NN5 5FH |
| Town Corner | NN5 5BD |
| Tweed Road | NN5 5AJ NN5 5AL |
| Tyne Road | NN5 5AF |
| Walter Tull Way | NN5 5QA NN5 5QJ NN5 5QL |
| Weedon Road | NN5 5BE NN5 5BF NN5 5BG NN5 5BS NN5 5DA NN5 5DE |
| Westfield Road | NN5 5BY |
| Wimbledon Street | NN5 5EW |
| NN5 5QN |
Transport near St James
- FAQ
- Price Paid By Year
- Property Type Price
Frequently asked questions about St James
What is the average price for a property for sale in St James?
The average price for a property for sale in St James is £202,279. This amount is 30% lower than the average price in Northampton. There are 1,109 property listings for sale in St James.
What streets have the most expensive properties for sale in St James?
The streets with the most expensive properties for sale in St James are Holyrood Road at an average of £390,500, Ross Road at an average of £320,000 and Forfar Street at an average of £284,250.
What streets have the most affordable properties for sale in St James?
The streets with the most affordable properties for sale in St James are Byfield Road at an average of £115,500, Abbey Street at an average of £122,000 and Alma Street at an average of £150,000.
Which train stations are available in or near St James?
Some of the train stations available in or near St James are Northampton, Long Buckby and Wellingborough.
Property Price Paid in St James by Year
The average sold property price by year was:
| Year | Average Sold Price | Price Change |
Sold Properties
|
|---|---|---|---|
| 2025 | £198,730 | -2% |
60 Properties |
| 2024 | £202,048 | -1% |
94 Properties |
| 2023 | £205,072 | -5% |
84 Properties |
| 2022 | £215,732 | 13% |
100 Properties |
| 2021 | £186,915 | 9% |
100 Properties |
| 2020 | £169,238 | 2% |
90 Properties |
| 2019 | £165,059 | -2% |
97 Properties |
| 2018 | £168,355 | -1% |
106 Properties |
| 2017 | £170,334 | 12% |
120 Properties |
| 2016 | £150,512 | 10% |
128 Properties |
| 2015 | £135,650 | -2% |
113 Properties |
| 2014 | £138,100 | 13% |
136 Properties |
| 2013 | £119,781 | 7% |
94 Properties |
| 2012 | £111,184 | 1% |
57 Properties |
| 2011 | £109,525 | -3% |
58 Properties |
| 2010 | £113,353 | 6% |
70 Properties |
| 2009 | £106,718 | -21% |
56 Properties |
| 2008 | £129,275 | -2% |
73 Properties |
| 2007 | £131,652 | 2% |
185 Properties |
| 2006 | £129,481 | -2% |
237 Properties |
| 2005 | £131,503 | 3% |
253 Properties |
| 2004 | £127,039 | 15% |
247 Properties |
| 2003 | £107,355 | 13% |
217 Properties |
| 2002 | £93,807 | 20% |
210 Properties |
| 2001 | £75,030 | 23% |
202 Properties |
| 2000 | £57,423 | 12% |
157 Properties |
| 1999 | £50,246 | 11% |
166 Properties |
| 1998 | £44,760 | 8% |
113 Properties |
| 1997 | £41,057 | 5% |
126 Properties |
| 1996 | £38,991 | 13% |
132 Properties |
| 1995 | £33,931 | - |
95 Properties |
Property Price per Property Type in St James
Here you can find historic sold price data in order to help with your property search.
The average Property Paid Price for specific property types in the last three years are:
| Property Type | Average Sold Price | Sold Properties |
|---|---|---|
| Semi Detached House | £284,291.00 | 24 Semi Detached Houses |
| Terraced House | £208,730.00 | 164 Terraced Houses |
| Flat | £139,340.00 | 49 Flats |
| Detached House | £260,000.00 | 1 Detached House |

