
Houses for sale in Northampton, Northamptonshire
House Prices in Northampton
Properties in Northampton have an average house price of £285k and had 11,220 Property Transactions within the last 3 years.¹
Northampton is an area in Northamptonshire with 113,733 households², where the most expensive property was sold for £6.12M.
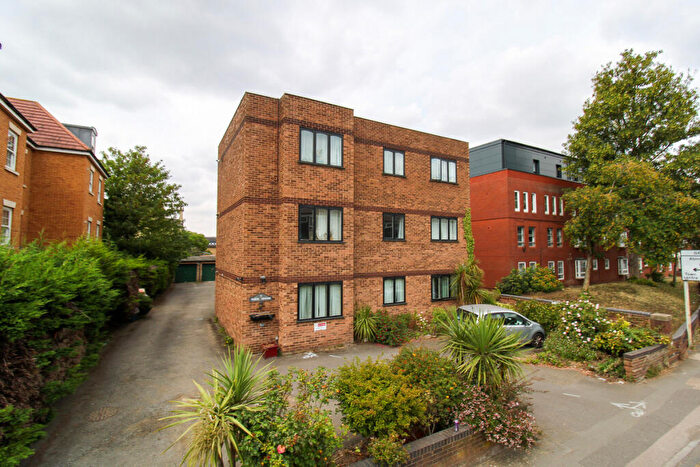
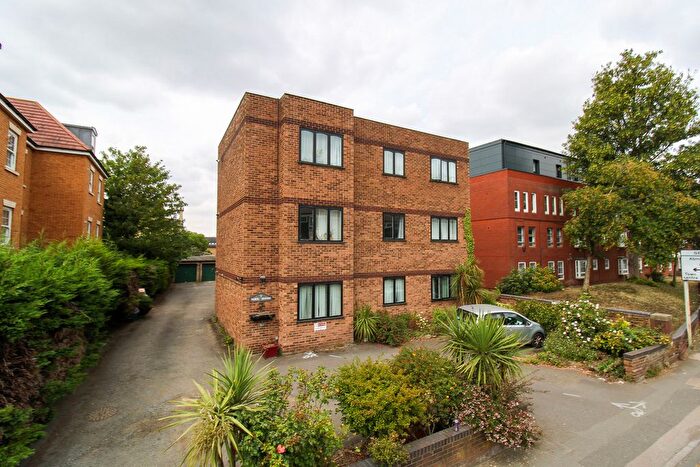
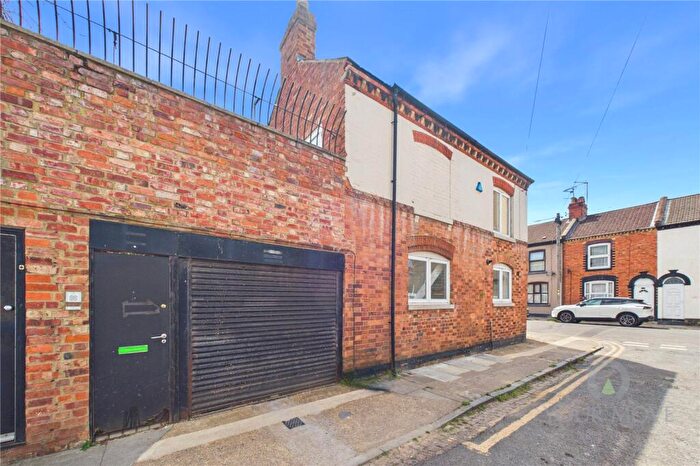
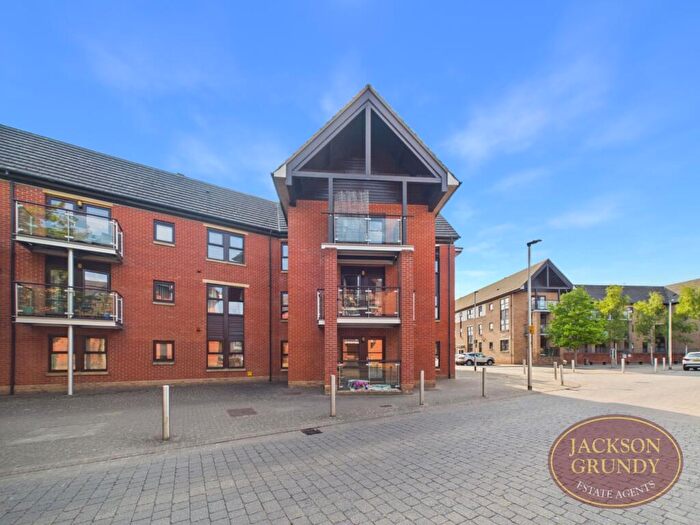
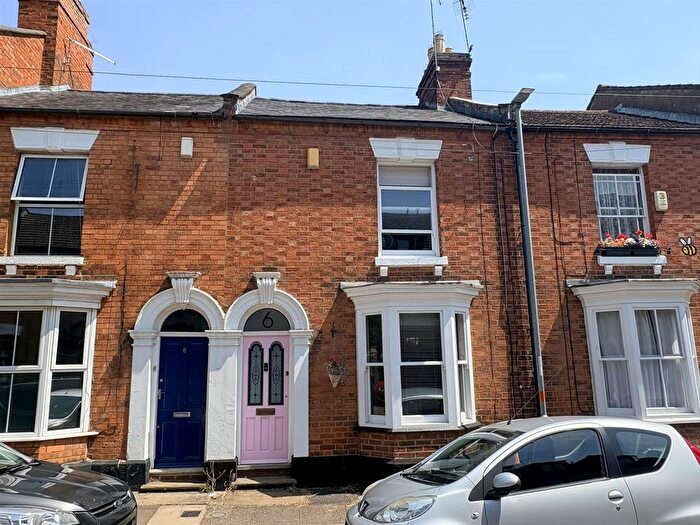
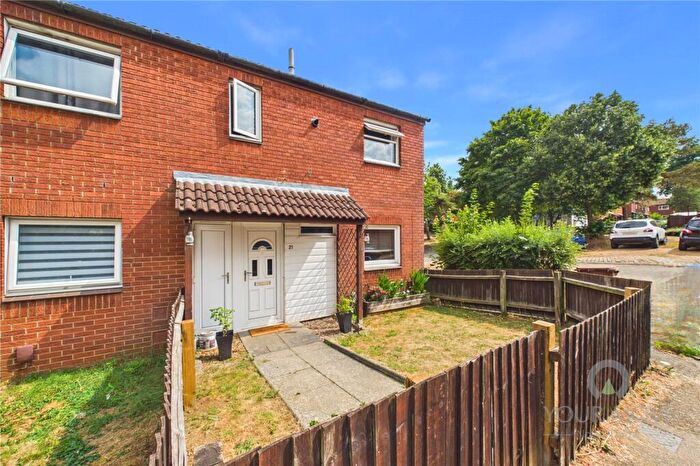
Properties for sale in Northampton
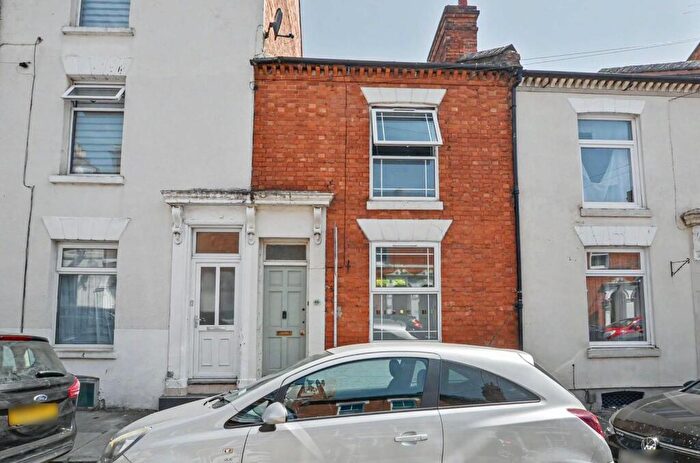
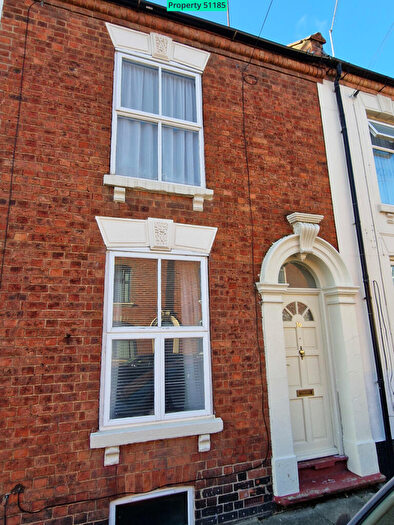

![]()
If you are looking to sell your house, let it out, or receive a property valuation, an expert can help you.
Click the button below to get started.


Neighbourhoods in Northampton
Navigate through our locations to find the location of your next house in Northampton, Northamptonshire for sale or to rent.
- Abington
- Billing
- Blakesley And Cote
- Blisworth And Roade
- Boothville
- Brafield And Yardley
- Brookside
- Castle
- Delapre And Briar Hill
- Earls Barton
- East Hunsbury
- Eastfield
- Grange Park
- Hackleton
- Harpole And Grange
- Headlands
- Heyfords And Bugbrooke
- Kings Heath
- Kingsley
- Kingsthorpe
- Nene Valley
- New Duston
- North
- Obelisk
- Old Duston
- Park
- Parklands
- Phippsville
- Rectory Farm
- Riverside
- Rushmills
- Salcey
- Semilong
- Slade
- Spencer
- Spring Park
- St Davids
- St James
- Sunnyside
- Talavera
- Trinity
- Upton
- West
- West Hunsbury
- Westone
- Wollaston
- Harrowden & Sywell
- Spratton
- Moulton
- Brixworth
- Walgrave
- Ravensthorpe
- Hackleton And Grange Park
- Sixfields
- Duston West And St. Crispin
- Duston East
- Woodford And Weedon
- St. George
- Abington And Phippsville
- Delapre And Rushmere
- Riverside Park
- Kingsthorpe South
- Kingsthorpe North
- Boothville And Parklands
- Billing And Rectory Farm
- East Hunsbury And Shelfleys
- Bugbrooke
- Dallington Spencer
- Long Buckby
- Braunston And Crick
- Irchester
- Towcester And Roade
Property price trends in Northampton
According to the latest Land Registry data, the average home in Northampton sold for £297,687 in 2026. That figure comes from a substantial record of 160,457 sales logged over the past 31 years.
Prices have continued to climb over the last three years. Compared with 2023, when the typical sale came in around £280,800, that's a rise of roughly 6%.
Looking back five years, average prices are up about 10% since 2021, a gain of around £27,059 in cash terms.
Zoom out to the past decade for the fuller picture. Back in 2016, homes here averaged £214,606, so the typical sold price has climbed about 38.7% since then, roughly 3.3% a year. Stretch the view to fifteen years and that annual pace edges up closer to 3.9%.
Frequently asked questions about Northampton
What is the average price for a property for sale in Northampton?
The average price for a property for sale in Northampton is £284,522. This amount is 2% lower than the average price in Northamptonshire. There are more than 10,000 property listings for sale in Northampton.
What locations have the most expensive properties for sale in Northampton?
The locations with the most expensive properties for sale in Northampton are Slade at an average of £660,379, Harrowden & Sywell at an average of £575,000 and Park at an average of £488,244.
What locations have the most affordable properties for sale in Northampton?
The locations with the most affordable properties for sale in Northampton are Castle at an average of £184,598, Semilong at an average of £185,528 and St James at an average of £201,384.
Which train stations are available in or near Northampton?
Some of the train stations available in or near Northampton are Northampton, Long Buckby and Wellingborough.
Property Price Paid in Northampton by Year
The average sold property price by year was:
| Year | Average Sold Price | Price Change |
Sold Properties
|
|---|---|---|---|
| 2026 | £297,687 | 3% |
210 Properties |
| 2025 | £287,412 | 1% |
3,706 Properties |
| 2024 | £284,398 | 1% |
3,809 Properties |
| 2023 | £280,800 | -3% |
3,495 Properties |
| 2022 | £290,483 | 7% |
4,557 Properties |
| 2021 | £270,628 | 8% |
5,464 Properties |
| 2020 | £249,410 | 2% |
3,899 Properties |
| 2019 | £244,294 | -1% |
4,633 Properties |
| 2018 | £245,720 | 3% |
5,115 Properties |
| 2017 | £237,226 | 10% |
5,207 Properties |
Property Price per Property Type in Northampton
Here you can find historic sold price data in order to help with your property search.
The average Property Paid Price for specific property types in the last three years are:
| Property Type | Average Sold Price | Sold Properties |
|---|---|---|
| Semi Detached House | £277,940.00 | 3,337 Semi Detached Houses |
| Terraced House | £230,233.00 | 3,913 Terraced Houses |
| Detached House | £433,684.00 | 2,713 Detached Houses |
| Flat | £149,058.00 | 1,257 Flats |
Transport in Northampton
Please see below transportation links in this area:
