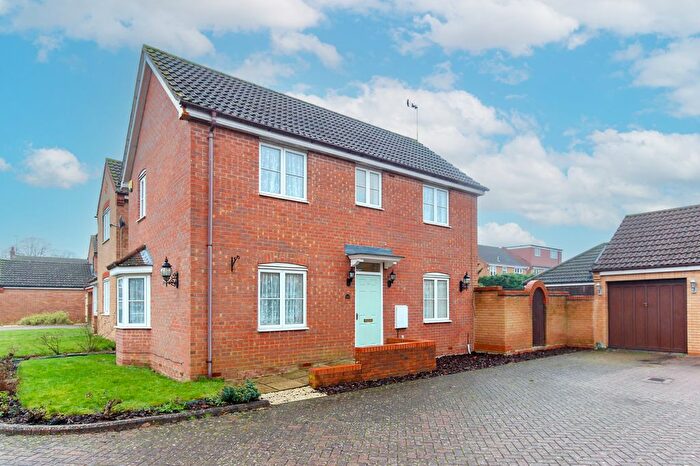
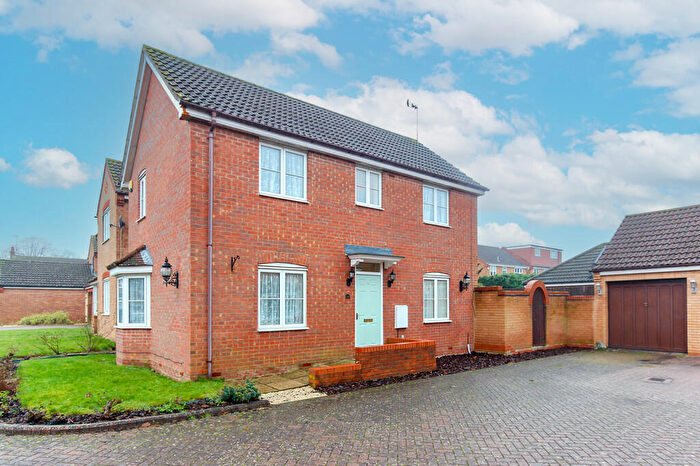
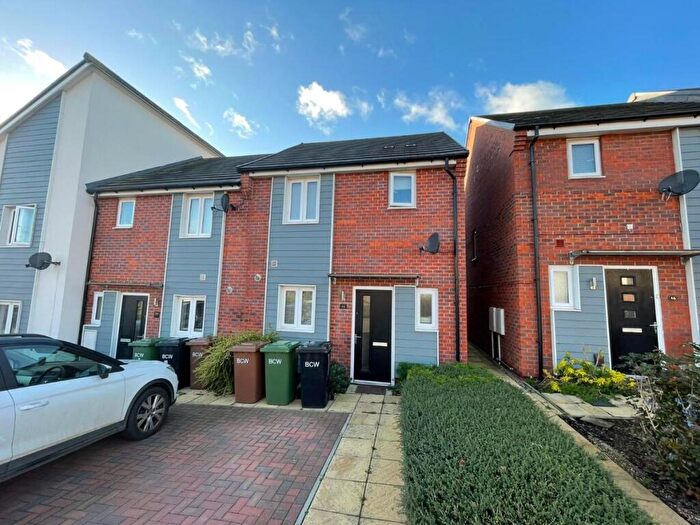
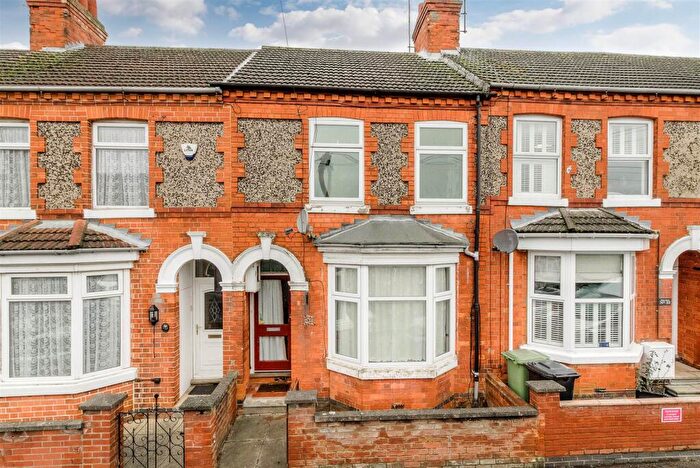
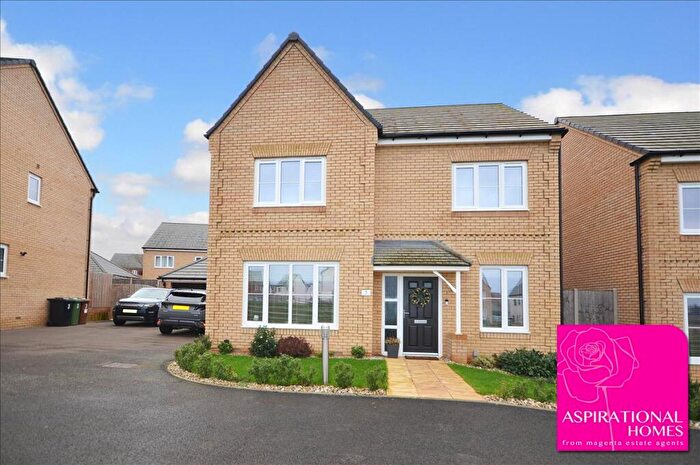
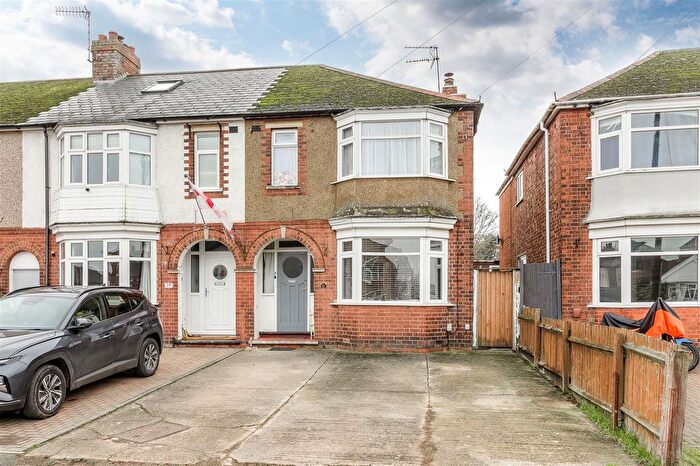
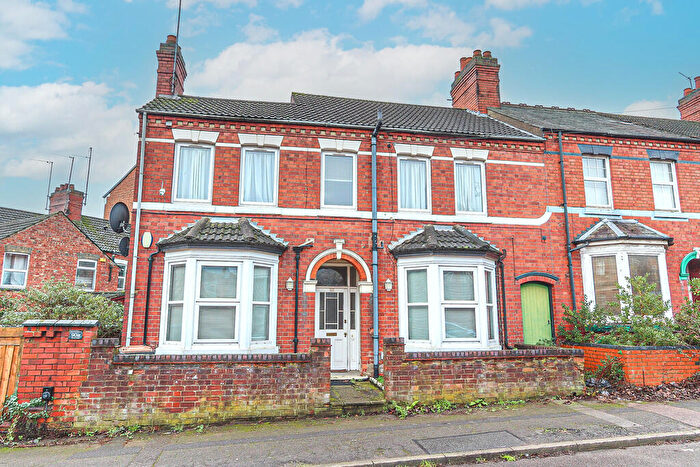
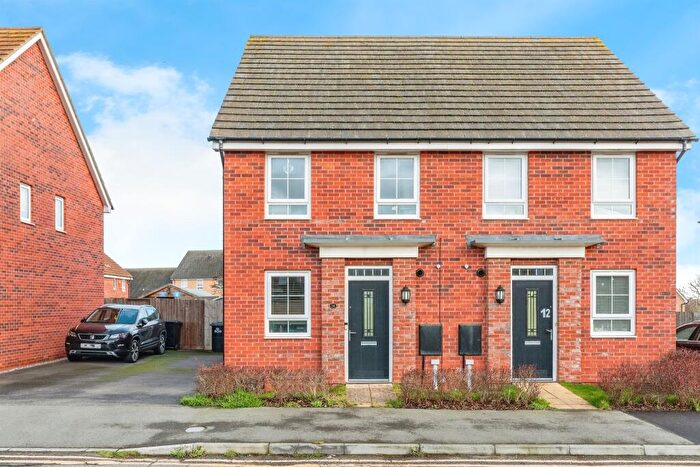
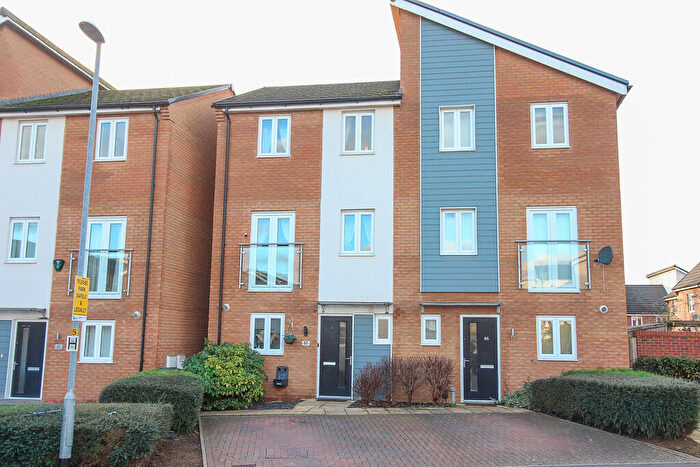
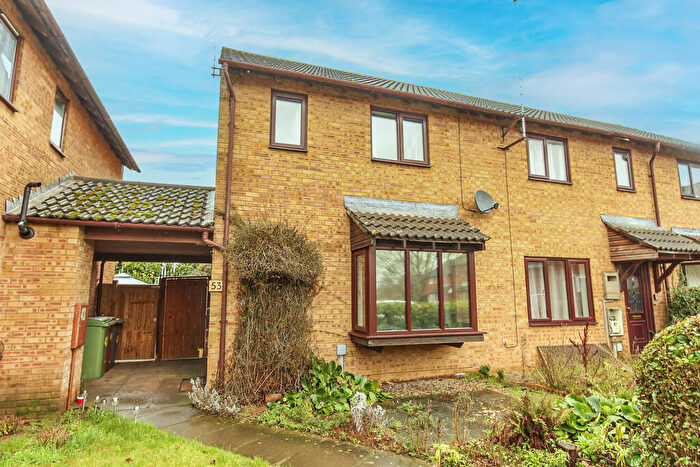
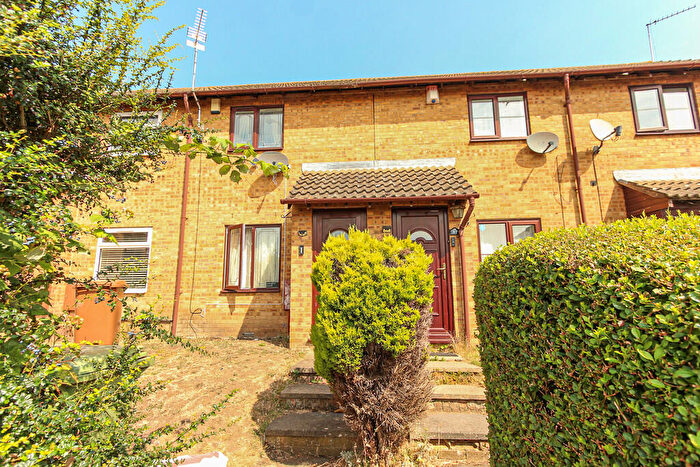
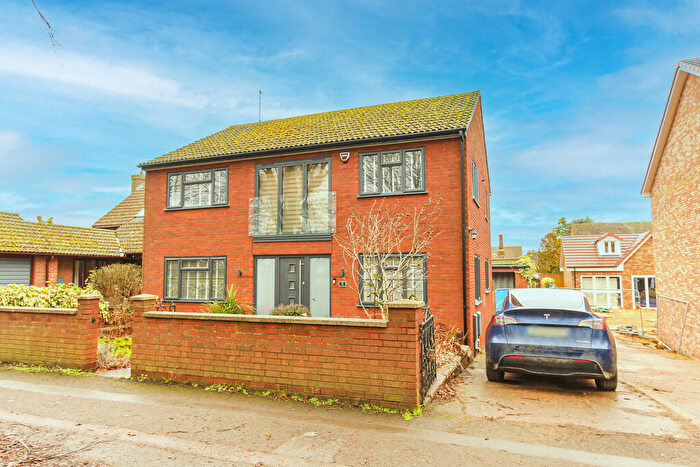
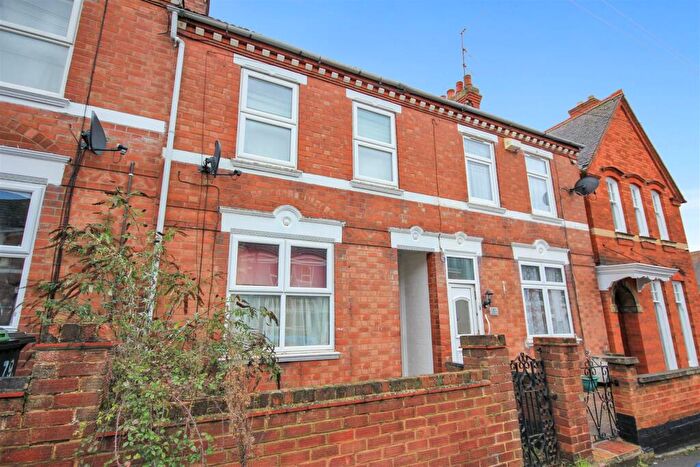
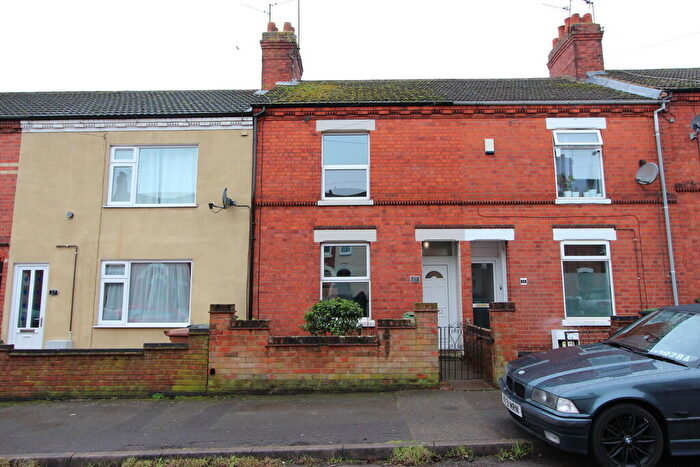
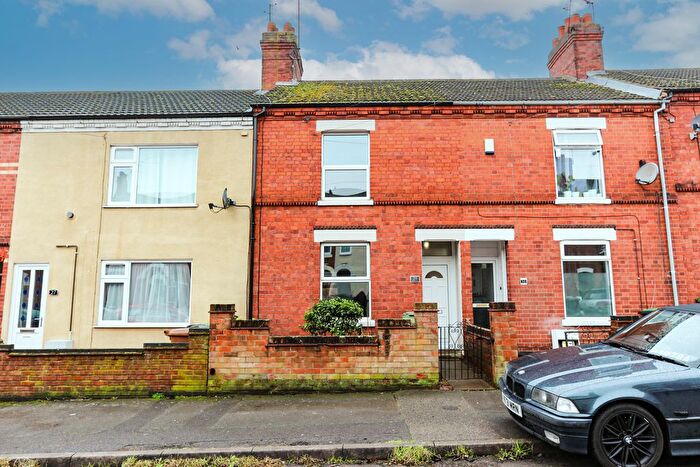
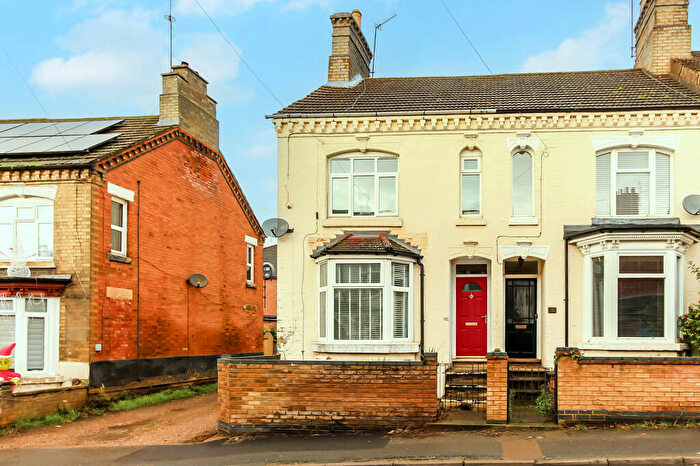
Houses for sale & to rent in Castle, Wellingborough
House Prices in Castle
Properties in Castle have an average house price of £194,043.00 and had 317 Property Transactions within the last 3 years¹.
Castle is an area in Wellingborough, Northamptonshire with 3,151 households², where the most expensive property was sold for £953,926.00.
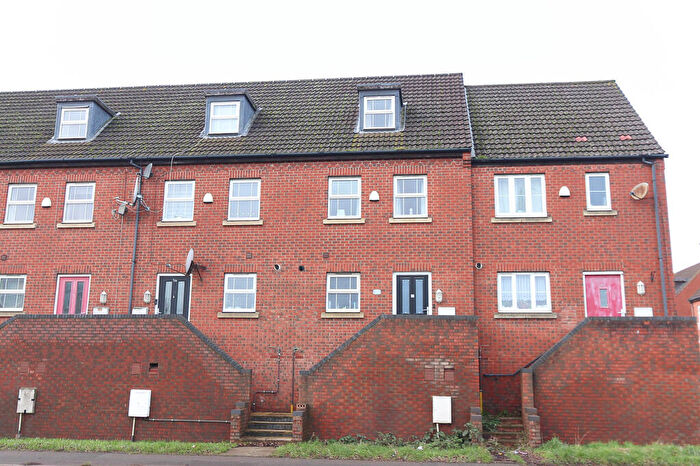
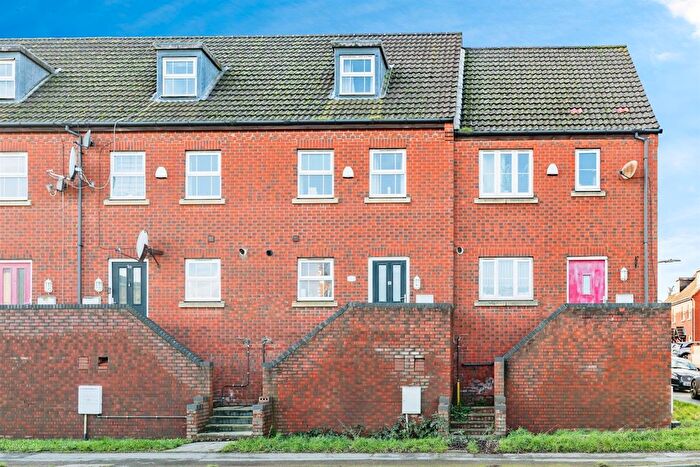
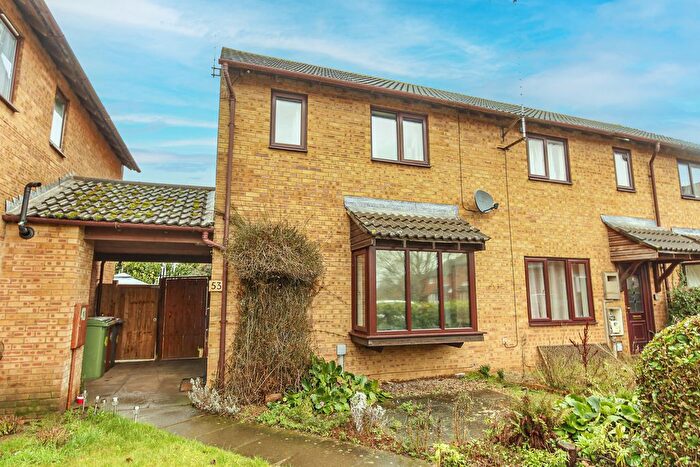
Properties for sale in Castle
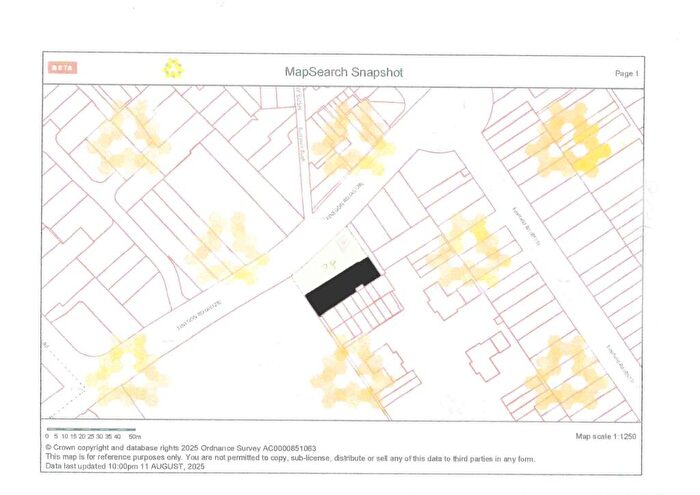
Roads and Postcodes in Castle
Navigate through our locations to find the location of your next house in Castle, Wellingborough for sale or to rent.
| Streets | Postcodes |
|---|---|
| Adams Close | NN8 4EZ |
| Albert Road | NN8 1EJ NN8 1EL NN8 1EN NN8 1EW |
| Alexandra Road | NN8 1EE NN8 1EF NN8 1EG NN8 1EH SA1 5BD |
| Britannia Gardens | NN8 1BG |
| Brook Street East | NN8 1ND |
| Cannon Street | NN8 4DU |
| Castle Street | NN8 1LW |
| Chace Road | NN8 1NR |
| Chapman Road | NN8 1JN |
| Chester Road | NN8 1NS |
| Colwell Road | NN8 1NT |
| Compton Road | NN8 1QG |
| Corn Mill Close | NN8 1FE |
| Dryden Road | NN8 1PZ |
| Eastfield Road | NN8 1PS NN8 1PT NN8 1QU NN8 1QX |
| Elsden Road | NN8 1PY NN8 1QD NN8 1QE |
| Fields View | NN8 1LZ |
| Finedon Road | NN8 4AA NN8 4AB NN8 4AH NN8 4AQ NN8 4EB |
| Gordon Road | NN8 1EP NN8 1ER |
| Grant Road | NN8 1ED NN8 1ES |
| Highfield Road | NN8 1PL |
| Irthlingborough Road | NN8 1LT NN8 1NL NN8 1NP NN8 1NW NN8 1PG NN8 1RA NN8 1RG |
| Knox Road | NN8 1HU NN8 1HW NN8 1HX NN8 1HY NN8 1JA NN8 1PX NN8 1QB |
| Laurence Leyland Complex | NN8 1RT |
| Leyland View | NN8 1LA NN8 1LE |
| Leys Gardens | NN8 1LY |
| Leys Road | NN8 1PN |
| Mars Drive | NN8 1RE NN8 1RJ |
| Melton Road | NN8 1PU |
| Melton Road North | NN8 1PP NN8 1PW |
| Midland Road | NN8 1LU NN8 1NB NN8 1NF NN8 1NG |
| Mill Road | NN8 1PE NN8 1PF NN8 1PH NN8 1PJ NN8 1PQ NN8 1PR NN8 1QN NN8 1QT NN8 1QW |
| Neptune Road | NN8 1RB NN8 1RD |
| Newcomen Road | NN8 1JP NN8 1JT NN8 1JW NN8 1JX |
| Paling Close | NN8 1FB NN8 1FD |
| Palk Road | NN8 1HP NN8 1HR NN8 1HT |
| Park View | NN8 1LS |
| Ranelagh Road | NN8 1HS NN8 1HZ NN8 1JG NN8 1JS |
| Salisbury Road | NN8 1QF |
| Saxby Crescent | NN8 1NN |
| Senwick Drive | NN8 1RU NN8 1RX NN8 1RY NN8 1RZ NN8 1SD NN8 1SE |
| Senwick Road | NN8 1NH NN8 1NJ |
| St Marys Paddock | NN8 1HJ |
| Stanley Road | NN8 1DY NN8 1EA |
| Strode Road | NN8 1DT NN8 1JB NN8 1JE NN8 1JU |
| Talbot Road | NN8 1EQ NN8 1QA NN8 1QH |
| The Embankment | NN8 1PA |
| Thomas Street | NN8 1DU NN8 1DX |
| Ultra Close | NN8 1JY |
| Victoria Road | NN8 1HN |
| Vivian Road | NN8 1JJ NN8 1JL |
| Whitworth Road | NN8 1QQ |
| Winstanley Road | NN8 1JD NN8 1JF NN8 1JH NN8 1JQ |
| York Road | NN8 1DS |
Transport near Castle
- FAQ
- Price Paid By Year
- Property Type Price
Frequently asked questions about Castle
What is the average price for a property for sale in Castle?
The average price for a property for sale in Castle is £194,043. This amount is 26% lower than the average price in Wellingborough. There are 1,357 property listings for sale in Castle.
What streets have the most expensive properties for sale in Castle?
The streets with the most expensive properties for sale in Castle are Castle Street at an average of £319,147, Finedon Road at an average of £283,250 and Neptune Road at an average of £269,666.
What streets have the most affordable properties for sale in Castle?
The streets with the most affordable properties for sale in Castle are The Embankment at an average of £48,000, Paling Close at an average of £88,000 and Fields View at an average of £125,250.
Which train stations are available in or near Castle?
Some of the train stations available in or near Castle are Wellingborough, Kettering and Northampton.
Property Price Paid in Castle by Year
The average sold property price by year was:
| Year | Average Sold Price | Price Change |
Sold Properties
|
|---|---|---|---|
| 2025 | £189,946 | -2% |
83 Properties |
| 2024 | £193,030 | -2% |
113 Properties |
| 2023 | £197,799 | 2% |
121 Properties |
| 2022 | £193,012 | 9% |
140 Properties |
| 2021 | £176,581 | 3% |
138 Properties |
| 2020 | £171,318 | 5% |
99 Properties |
| 2019 | £163,552 | -5% |
119 Properties |
| 2018 | £172,333 | 13% |
150 Properties |
| 2017 | £149,699 | 8% |
156 Properties |
| 2016 | £137,228 | 11% |
176 Properties |
| 2015 | £121,530 | 2% |
134 Properties |
| 2014 | £119,609 | 3% |
155 Properties |
| 2013 | £115,789 | 8% |
141 Properties |
| 2012 | £106,352 | 2% |
93 Properties |
| 2011 | £104,022 | -1% |
88 Properties |
| 2010 | £104,912 | 9% |
82 Properties |
| 2009 | £95,006 | -30% |
86 Properties |
| 2008 | £123,403 | -5% |
134 Properties |
| 2007 | £130,112 | 13% |
291 Properties |
| 2006 | £113,408 | 9% |
268 Properties |
| 2005 | £103,020 | 7% |
201 Properties |
| 2004 | £95,615 | 7% |
221 Properties |
| 2003 | £89,243 | 23% |
225 Properties |
| 2002 | £68,576 | 25% |
299 Properties |
| 2001 | £51,534 | 9% |
255 Properties |
| 2000 | £46,729 | 15% |
253 Properties |
| 1999 | £39,864 | 6% |
272 Properties |
| 1998 | £37,566 | 16% |
209 Properties |
| 1997 | £31,647 | 11% |
176 Properties |
| 1996 | £28,266 | -10% |
187 Properties |
| 1995 | £30,989 | - |
153 Properties |
Property Price per Property Type in Castle
Here you can find historic sold price data in order to help with your property search.
The average Property Paid Price for specific property types in the last three years are:
| Property Type | Average Sold Price | Sold Properties |
|---|---|---|
| Semi Detached House | £231,639.00 | 51 Semi Detached Houses |
| Detached House | £347,663.00 | 12 Detached Houses |
| Terraced House | £188,387.00 | 212 Terraced Houses |
| Flat | £133,047.00 | 42 Flats |

