
Houses for sale in Wellingborough, Northamptonshire
House Prices in Wellingborough
Properties in Wellingborough have an average house price of £260k and had 3,640 Property Transactions within the last 3 years.¹
Wellingborough is an area in Northamptonshire with 39,746 households², where the most expensive property was sold for £2.4M.
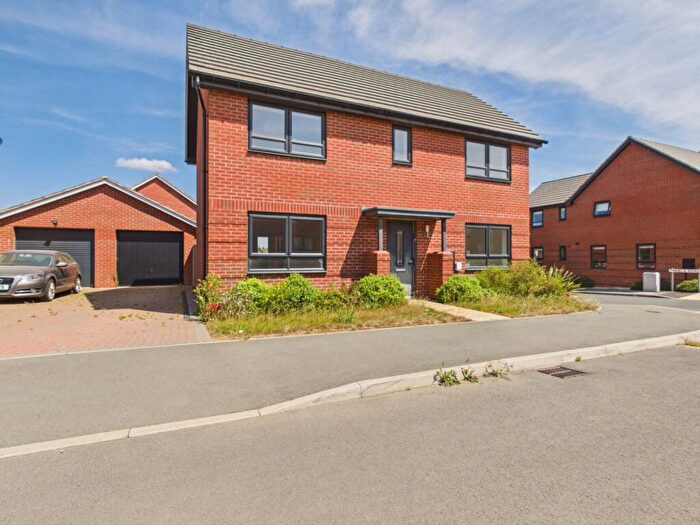
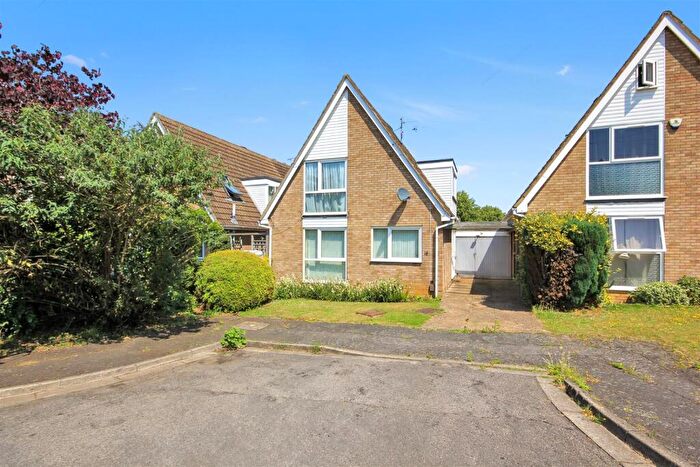
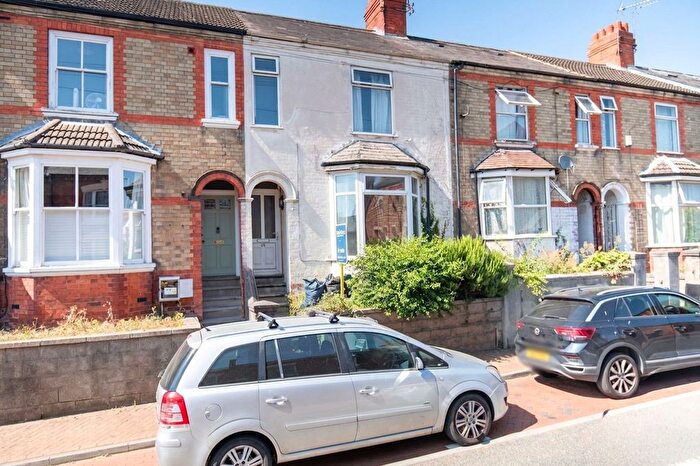
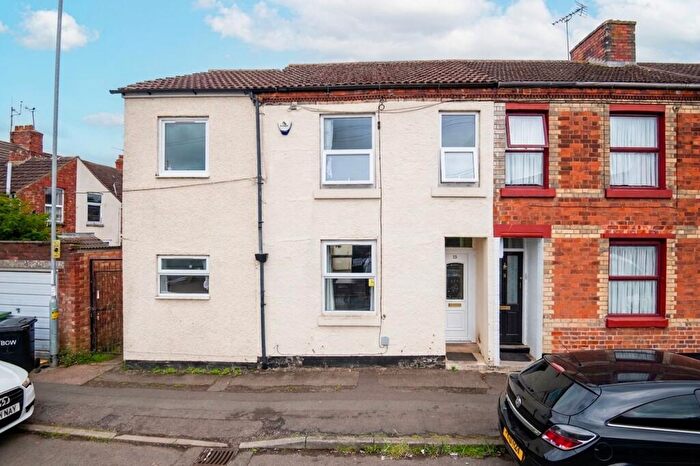
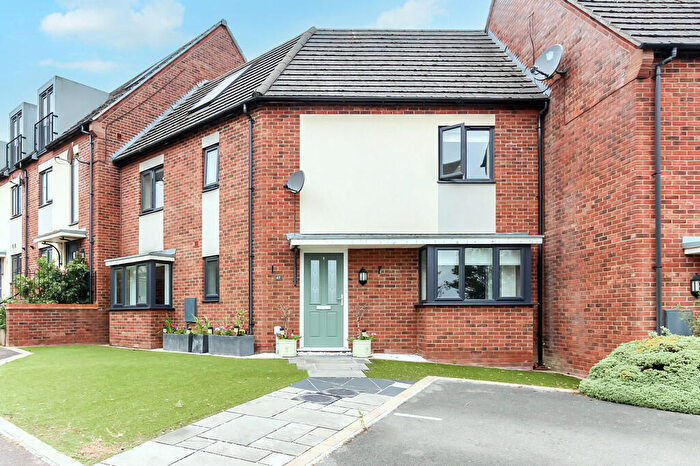
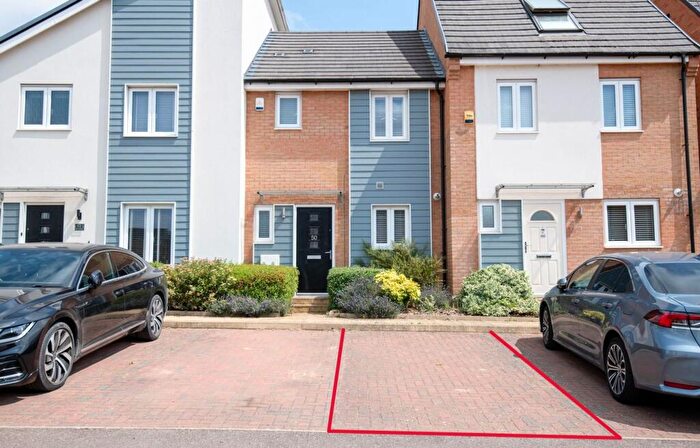
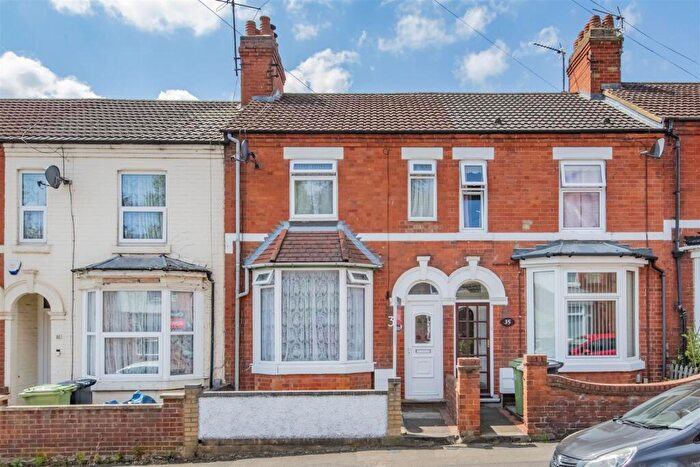
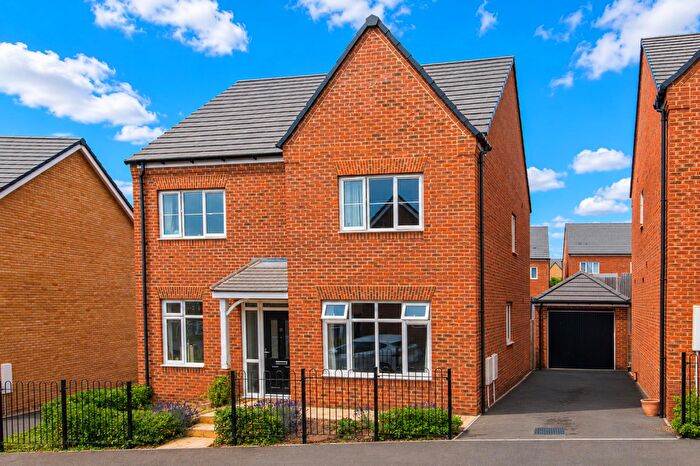
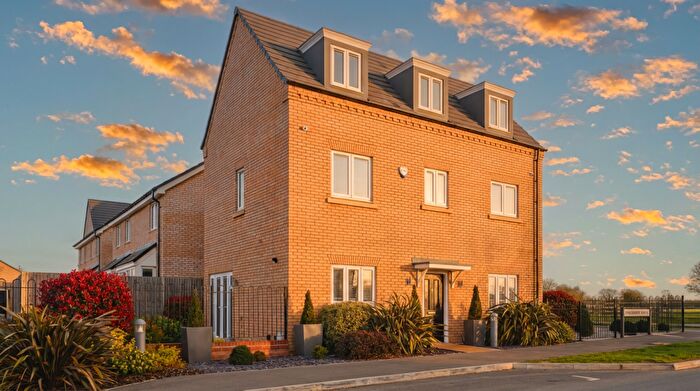
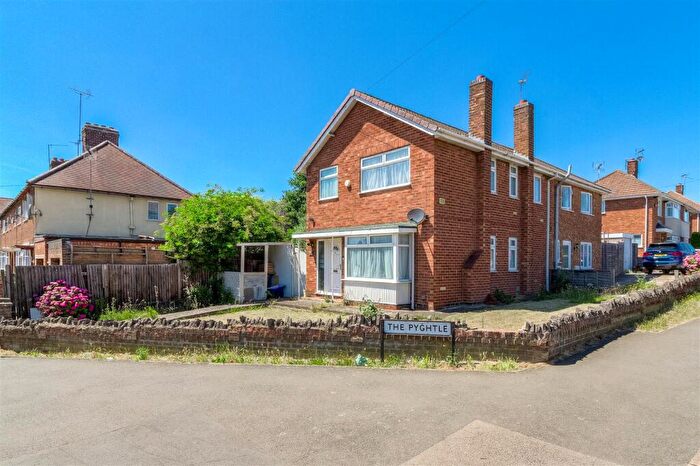
Properties for sale in Wellingborough
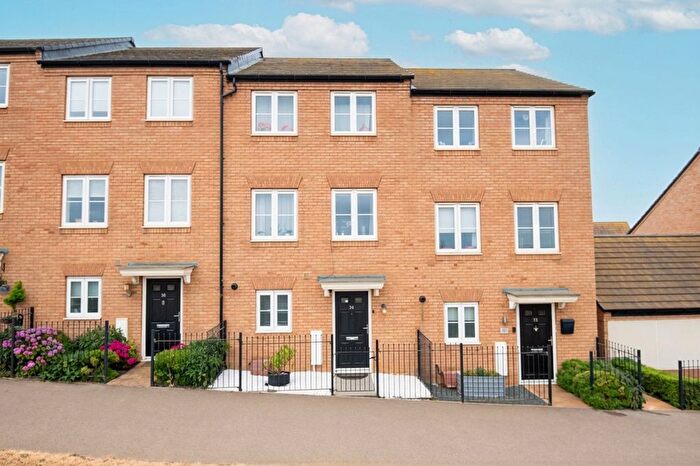

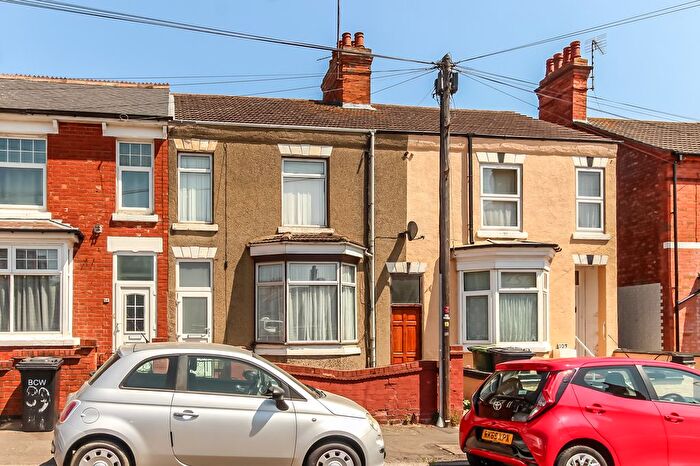
![]()
If you are looking to sell your house, let it out, or receive a property valuation, an expert can help you.
Click the button below to get started.

Neighbourhoods in Wellingborough
Navigate through our locations to find the location of your next house in Wellingborough, Northamptonshire for sale or to rent.
- Brickhill
- Castle
- Croyland
- Earls Barton
- Finedon
- Great Doddington And Wilby
- Hemmingwell
- Higham Ferrers Lancaster
- Irchester
- Irthlingborough John Pyel
- Irthlingborough Waterloo
- North
- Queen Eleanor And Buccleuch
- Queensway
- Raunds Saxon
- Raunds Windmill
- Redwell East
- Redwell West
- South
- Stanwick
- Swanspool
- Thrapston Market
- Wollaston
- Bozeat
- Great Doddington & Wilby
- Isebrook
- Rixon
- Redwell
- Harrowden & Sywell
- Victoria
- Hatton
- Croyland And Swanspool
- Brickhill And Queensway
- Hatton Park
- Irthlingborough
- Raunds
Property price trends in Wellingborough
According to the latest Land Registry data, the average home in Wellingborough sold for £245,254 in 2026. That figure comes from a substantial record of 52,174 sales logged over the past 31 years.
Prices have softened over the last three years. Compared with 2023, when the typical sale came in around £255,456, that's a fall of roughly 4%.
Looking back five years, average prices are up about 1.6% since 2021, a gain of around £3,763 in cash terms.
Zoom out to the past decade for the fuller picture. Back in 2016, homes here averaged £184,879, so the typical sold price has climbed about 32.7% since then, roughly 2.9% a year. Stretch the view to fifteen years and that annual pace edges up closer to 3.6%.
Frequently asked questions about Wellingborough
What is the average price for a property for sale in Wellingborough?
The average price for a property for sale in Wellingborough is £260,163. This amount is 11% lower than the average price in Northamptonshire. There are more than 10,000 property listings for sale in Wellingborough.
What locations have the most expensive properties for sale in Wellingborough?
The locations with the most expensive properties for sale in Wellingborough are Bozeat at an average of £680,000, Redwell at an average of £580,000 and Harrowden & Sywell at an average of £565,000.
What locations have the most affordable properties for sale in Wellingborough?
The locations with the most affordable properties for sale in Wellingborough are Hatton at an average of £107,750, Rixon at an average of £121,000 and Castle at an average of £192,794.
Which train stations are available in or near Wellingborough?
Some of the train stations available in or near Wellingborough are Wellingborough, Kettering and Northampton.
Property Price Paid in Wellingborough by Year
The average sold property price by year was:
| Year | Average Sold Price | Price Change |
Sold Properties
|
|---|---|---|---|
| 2026 | £245,254 | -6% |
79 Properties |
| 2025 | £259,502 | -3% |
1,230 Properties |
| 2024 | £266,250 | 4% |
1,201 Properties |
| 2023 | £255,456 | -2% |
1,130 Properties |
| 2022 | £260,544 | 7% |
1,389 Properties |
| 2021 | £241,491 | 2% |
1,783 Properties |
| 2020 | £235,636 | 5% |
1,328 Properties |
| 2019 | £224,473 | 2% |
1,614 Properties |
| 2018 | £220,603 | 7% |
1,702 Properties |
| 2017 | £204,104 | 9% |
1,699 Properties |
Property Price per Property Type in Wellingborough
Here you can find historic sold price data in order to help with your property search.
The average Property Paid Price for specific property types in the last three years are:
| Property Type | Average Sold Price | Sold Properties |
|---|---|---|
| Semi Detached House | £248,594.00 | 1,381 Semi Detached Houses |
| Terraced House | £204,656.00 | 1,113 Terraced Houses |
| Detached House | £380,054.00 | 905 Detached Houses |
| Flat | £132,590.00 | 241 Flats |
Transport in Wellingborough
Please see below transportation links in this area:
